CRACK PROPAGATION AND FRACTURE ANALYSIS IN ENGINEERING STRUCTURE BY
GENERATIVE PART STRUCTURAL ANALYSIS
1*
Sushovan Chatterjee
1
Department of Mechanical Engineering, National Institute of Technolog
2Assistant Manager-Engineering, Tata Toyo Radiator Ltd., Tata A
ARTICLE INFO ABSTRACT
Crack propagation study is a viable and futuristic criterion to design better and more adaptive engineering structures; hence it becomes imperative to indulge in a concrete study of crack propagation. In this paper, CATIA V5 software is used
order to estimate Critical crack length and the critical load. Further comparative study is done based on critical length between various engineering structures which are rectangular beam, I
shaft and solid shaft from which hollow shaft is been found better over the other structures for engineering design.
Copyright © 2014 Sushovan Chatterjee and Bidyot Doley.
permits unrestricted use, distribution, and reproduction in any medium, provided the original work is properly cited.
INTRODUCTION
Cracks are defects in engineering structure arising mainly due to flaw during manufacturing, and also due to their structural morphology. The crack initiation in different structures had been studied and the critical load and critical crack l
found out to check whether crack starts to propagate by
computing the stress intensity factor (Ki). Cracks were assumed
to propagate via a process of quasi-static incremental steps through the crack tip damage zone (Wang Zhiqiang and Nakamura Toshio 2004)), and the internal stresses decrease as a short crack grows out of the stress field
Vasudevan 1997). We have followed Irwin’s Criterion of crack propagation. According to Irwin a crack can only propagate when the stress concentration factor (K) is equal to
the critical stress concentration factor at fracture
and Miehe Christian 2009). The growth of a crack requires the creation of two new surfaces and hence an increase in the surface energy (Curtin et al., 2010). The fresh surface area produced in each fatigue cycle is in proportion to the crack propagation rate (Shimojo et al., 1993). In ductile materials a plastic zone develops at the tip of the crack. As the applied load increases, the plastic zone increases in size until the crack grows and the material behind the crack tip unloads. The plastic loading and unloading cycle near the crack tip leads to the dissipation of energy as heat. Hence, a dissipative term has
*Corresponding author: Sushovan Chatterjee
Department of Mechanical Engineering, National Institute of Technology Silchar, Assam-788010, India.
ISSN: 0975-833X
Article History:
Received 18th March, 2014 Received in revised form 06th April, 2014 Accepted 09th May, 2014 Published online 25th June,2014
Key words:
Critical crack length, Stress intensity factor, Stress concentration factor, Crack propagation.
RESEARCH ARTICLE
CRACK PROPAGATION AND FRACTURE ANALYSIS IN ENGINEERING STRUCTURE BY
GENERATIVE PART STRUCTURAL ANALYSIS
Sushovan Chatterjee and
2Bidyot Doley
Mechanical Engineering, National Institute of Technology Silchar, Assam
Engineering, Tata Toyo Radiator Ltd., Tata Auto Comp System Ltd Pune, India
ABSTRACT
Crack propagation study is a viable and futuristic criterion to design better and more adaptive engineering structures; hence it becomes imperative to indulge in a concrete study of crack propagation. In this paper, CATIA V5 software is used as a tool for modeling and stress analysis, in order to estimate Critical crack length and the critical load. Further comparative study is done based on critical length between various engineering structures which are rectangular beam, I
t and solid shaft from which hollow shaft is been found better over the other structures for engineering design.
Bidyot Doley. This is an open access article distributed under the Creative Commons Attribution permits unrestricted use, distribution, and reproduction in any medium, provided the original work is properly cited.
Cracks are defects in engineering structure arising mainly due to flaw during manufacturing, and also due to their structural morphology. The crack initiation in different structures had been studied and the critical load and critical crack length were found out to check whether crack starts to propagate by ). Cracks were assumed static incremental steps ang Zhiqiang and , and the internal stresses decrease as a short crack grows out of the stress field (Sadananda and . We have followed Irwin’s Criterion of crack propagation. According to Irwin a crack can only propagate
) is equal to Kc which is
the critical stress concentration factor at fracture (Gürses Ercan . The growth of a crack requires the creation of two new surfaces and hence an increase in the . The fresh surface area produced in each fatigue cycle is in proportion to the crack . In ductile materials a plastic zone develops at the tip of the crack. As the applied ases in size until the crack grows and the material behind the crack tip unloads. The plastic loading and unloading cycle near the crack tip leads to the dissipation of energy as heat. Hence, a dissipative term has
Department of Mechanical Engineering, National Institute of Technology
to be added to the energy balance relation
2004). Crack propagation behavior is highly dependent on the variations of the failure parameters. In non
materials, crack propagation in elastic
never attains a steady state and the fracture energy associated with crack growth continues to vary as the crack propagates through the graded region (Hurley
propagation direction associated with the classical Griffith criterion is identified by the material configurational force which maximizes the local
(Seweryn Andrzej 1994).
Considered Model and Material Parameters
During this analysis, four engineering model structures were taken into consideration viz. Rectangular beam, I
beam, Solid circular shaft, and Hollow
being considered as the material for construction of the aforementioned structures having the mechanical properties as shown in Table 1.
Table1 . Material properties (as per catia v5 library)
Material Young’s modulus(N/m
Poison’s Ratio Density(kg/m3)
Co-efficient of thermal expansion(/°C) Yield Strength (N/m2)
International Journal of Current Research
Vol. 6, Issue, 06, pp.7032-7037, June,2014
INTERNATIONAL
CRACK PROPAGATION AND FRACTURE ANALYSIS IN ENGINEERING STRUCTURE BY
y Silchar, Assam-788010, India
uto Comp System Ltd Pune, India
Crack propagation study is a viable and futuristic criterion to design better and more adaptive engineering structures; hence it becomes imperative to indulge in a concrete study of crack as a tool for modeling and stress analysis, in order to estimate Critical crack length and the critical load. Further comparative study is done based on critical length between various engineering structures which are rectangular beam, I-beam, hollow t and solid shaft from which hollow shaft is been found better over the other structures for
is an open access article distributed under the Creative Commons Attribution License, which
to be added to the energy balance relation (Miserez et al., . Crack propagation behavior is highly dependent on the variations of the failure parameters. In non-homogeneous materials, crack propagation in elastic–plastic graded materials never attains a steady state and the fracture energy associated wth continues to vary as the crack propagates Hurley and Evans 2007). The crack propagation direction associated with the classical Griffith criterion is identified by the material configurational force which maximizes the local dissipation at the crack front
Considered Model and Material Parameters
During this analysis, four engineering model structures were taken into consideration viz. Rectangular beam, I-section beam, Solid circular shaft, and Hollow circular shaft. Steel is being considered as the material for construction of the aforementioned structures having the mechanical properties as
. Material properties (as per catia v5 library)
Steel
Young’s modulus(N/m2) 2 × 10¹¹
0.266 7860 efficient of thermal expansion(/°C) 1.17 × 10-05
) 2.5x1008
Analysis Procedure
Rectangular beam
[image:2.595.316.545.63.188.2]In this case the objective has been framed to study and analyze the crack propagation in a rectangular beam for which a model element is created in CATIA V5. The dimensions of the beam are shown in the Fig.1.
Fig. 1. Basic dimensions of the rectangular beam model element
Now the model is analysed with 18.736 mm mesh size 3.002
mm absolute sag, 42500 N point load. The blue part shows the
[image:2.595.38.283.166.272.2]less stress concentration, green part shows higher stress concentration and red part shows the highest stress concentration which is located on the crack as shown in Fig.2 and also in every model analysed in CATIA V5. Data were collected at different lengths.
Fig. 2. Von Mises Stress Distribution of rectangular beam
The analysis from CATIA V5 has been shown in Table 2 for the rectangular beam. The red marked row of every table indicates the critical stress concentration factor and critical crack length.
Table 2. Result Analysis on Rectangular Beam
Sl. No.
Crack length (mm)
Stress (σ)
N/m2 x 1008 Pa m(K) 1/2 x 1008
1 80 1.83 0.65
2 90 2.26 0.85
3 98 2.50 0.99
4 100 2.72 1.08
5 110 2.69 1.12
[image:2.595.308.553.303.393.2]The variation of stress concentration factor against the computational crack length reveals that there are sudden rise in stress concentration factor, when the crack length reaches at its critical value at 98 mm crack length as is evident from Fig.3.
Fig. 3. Computational Crack length vs. Stress Concentration factor for rectangular beam
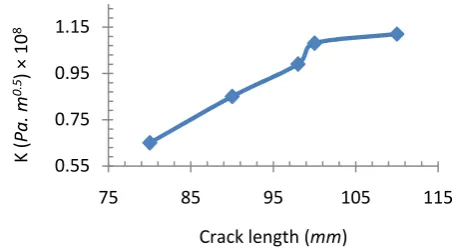
I-beam
[image:2.595.36.295.416.488.2]The I-beam model has been considered having elliptical crack along the axis of the beam with the major axis of the crack and minor axis perpendicular to it. As shown in Fig.4.
Fig. 4. Basic dimensions of the I-Beam model element.
Using the graphical interface of CATIA V5 the distribution of Von Mises stress has been plotted as shown in Fig.5.
Fig. 5. Von Mises Stress Distribution of I-Beam
Here the mesh size is 18.736 mm, absolute sag 3.002 mm and point load 42500 N. The result of the analysis is given in Fig.5 and Table 3.
Table 3. Result Analysis on I-Beam Point Load
Sl. No.
Crack length (mm)
Stress (σ)
N/m2 x 1008 Pa m(K) 1/2 x 1008
1 80 1.13 0.40
2 90 2.15 0.81
3 100 2.50 0.99
4 110 2.62 1.09
5 120 2.53 1.10
0.55 0.75 0.95 1.15
75 85 95 105 115
K
(
P
a
. m
0
.5)
×
1
0
8
[image:2.595.308.562.468.558.2] [image:2.595.51.273.608.678.2] [image:2.595.321.541.661.732.2]The variation of K with Crack length is shown in Fig. 6.
Fig. 6. Computational crack length vs. Stress Concentration Factor for I-beam
Now the I-Beam is subjected to rotational and point load both having crack type elliptical along the major axis diameter 25
mm and minor axis diameter 1 mm and at a distance of 18 mm
[image:3.595.295.569.87.176.2]from the centre and mesh size and absolute sag are 6.236 mm and 1.002 respectively and here also the red part which indicate the highest stress concentration located at the crack shown in Fig.7.
Fig. 7. Von Mises Stress Distribution of I-Beam
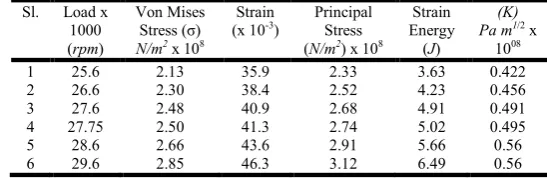
Not only point load consideration, we have also analyzed the same cracked I-beam model by applying rotational load to check the variation of stress in such cases whenever the same structure has to be subjected to an uniform torque or rotational loading. In this case shear stress also will be predominant rather than direct bending stress.
Fig. 8. Angular rotation Vs stress concentration factor (K) for I-Beam
[image:3.595.337.531.246.442.2]Angular rotation Vs stress concentration factor (K) for I-Beam Result of the stress concentration factor and crack length has been shown in Table 4.
Table 4. Result Analysis on I-Beam Under Both Point Load and Rotational Force
Sl. Load x 1000 (rpm)
Von Mises Stress (σ) N/m2 x 108
Strain (x 10-3)
Principal Stress (N/m2) x 108
Strain Energy
(J)
(K) Pa m1/2 x
1008
1 25.6 2.13 35.9 2.33 3.63 0.422
2 26.6 2.30 38.4 2.52 4.23 0.456
3 27.6 2.48 40.9 2.68 4.91 0.491
4 27.75 2.50 41.3 2.74 5.02 0.495
5 28.6 2.66 43.6 2.91 5.66 0.56
6 29.6 2.85 46.3 3.12 6.49 0.56
Solid Circular Shaft
The model element is created in CATIA V5 with height 100
[image:3.595.47.282.346.424.2]mm and radius 37.85 mm Fig. 9.
Fig. 9. Model of Solid Shaft
For rotational speed at 22000 rpm mesh size and absolute sag 6.236 mm and 1.002 mm the CATIA V5 analysis gives Fig.10.
Fig. 10 . Von Mises Stress Distribution of Solid Shaft
The analysis from CATIA V5 has been shown in Table 5 for Solid Shaft. The red-colour marked row in this table indicates the critical stress concentration factor and critical crack length which is 40 mm.
0.2 0.4 0.6 0.8 1 1.2
75 85 95 105 115 125
K
(
P
a
. m
0
.5)
x
1
0
8
Crack length (mm)
0.4 0.45 0.5 0.55 0.6
25 26 27 28 29 30
K
(
P
a.
m
0
..
5)
x
1
0
8
[image:3.595.328.538.509.668.2] [image:3.595.48.268.547.674.2]Table 5. Result analysis on solid shaft
Sl.
No.
Crack length (mm)
Von Mises Stress(σ) N/m2 x 1008
(K) Pa m1/2 x 1008
1 20 0.92 0.163
2 30 1.00 0.271
3 40 2.50 0.626
4 50 2.12 0.594
5 60 2.89 2.11
[image:4.595.49.274.76.156.2]The variation of stress concentration factor against the computational crack length reveals that there are abrupt rise in stress concentration factor, when the crack length reaches at its critical value as is evident from Fig.11.
Fig. 11. Computational crack length vs. Stress Concentration Factor for solid shaft
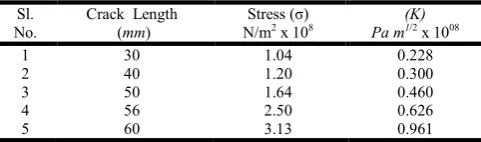
Hollow Circular Shaft
[image:4.595.49.278.231.364.2]The hollow shaft model created in CATIA V5 with 100 mm height and 39.15 mm inner diameter as shown in Fig.12. The other dimensions are same as earlier.
Fig. 12. Model of Hollow Shaft
[image:4.595.312.553.356.427.2]The model is subjected to a rotation at an angular velocity of 2303.835 rad/sec. The crack is of elliptical in shape with the major and minor axis diameters of 62.36 mm and 1.002 mm respectively.
Fig. 13. Von mises stress distribution of hollow shaft
The analysis in the CATIA V5 gives the output for the crack propagation as shown in Fig.13 and Table 6.
Table 6. Result analysis on hollow shaft
Sl. No.
Crack Length (mm)
Stress (σ) N/m2 x 108
(K) Pa m1/2 x 1008
1 30 1.04 0.228
2 40 1.20 0.300
3 50 1.64 0.460
4 56 2.50 0.626
5 60 3.13 0.961
[image:4.595.93.235.490.656.2]The variation of stress concentration factor against the computational crack length reveals that there are abrupt rise in stress concentration factor, when the crack length reaches at its critical value as is evident from Fig.14.
Fig. 14. Computational crack length vs. Stress Concentration Factor for hollow shaft
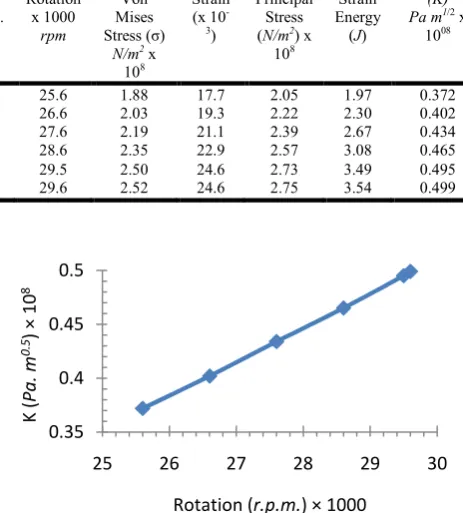
Now for point load 5000 N and varying rotational force both with crack type elliptical along the major diameter of 25 mm and minor diameter of 1 mm at a distance of 18 mm from the centre and mesh size and absolute sag 6.236 mm and 1.002
mm, the stress analysis of which in CATIA V5 is shown in
Fig.15.
-0.25 0.25 0.75 1.25 1.75 2.25
15 25 35 45 55 65
K
(
P
a.
m
0
.5)
×
1
0
5
Crack length (m)
0.2 0.4 0.6 0.8 1
25 35 45 55 65
k
(P
a
. m
0
.5)
×
1
0
8
[image:4.595.337.556.503.633.2]Moreover, the outputs for crack propagation are shown in Fig.16 and Table 7.
Table 7. Result analysis on hollow shaft under rotation
Sl. No.
Rotation x 1000
rpm
Von Mises Stress (σ)
N/m2 x
108
Strain (x 10
-3)
Principal Stress (N/m2) x
108
Strain Energy
(J)
(K) Pa m1/2 x
1008
1 25.6 1.88 17.7 2.05 1.97 0.372
2 26.6 2.03 19.3 2.22 2.30 0.402
3 27.6 2.19 21.1 2.39 2.67 0.434
4 28.6 2.35 22.9 2.57 3.08 0.465
5 29.5 2.50 24.6 2.73 3.49 0.495
6 29.6 2.52 24.6 2.75 3.54 0.499
Fig. 16. Angular rotation Vs Stress concentration factor
Eccentric loading in hollow circular shaft
[image:5.595.34.292.334.444.2]The model in Fig.12 is analysed in CATIA V5 with elliptical crack along the axis major axis diameter 25 mm and minor axis diameter 1 mm and at a distance of 18 mm from the centre having mesh size and absolute sag 6.236 mm and 1.002 mm respectively. The result from CATIA V5 is shown in Fig.16 and also in Table 8.
Fig. 17. Von mises stress distribution at crack propagation with eccentric loading 24 mm
The Von Mises stress developed in the structure is also studied under the combined simultaneous effect of point load of 5000
N under a uniform rotation of 29500 rpm when the eccentric
[image:5.595.49.281.342.599.2]load was applied at a radial offset distance of 24 mm.
Table 8. Analysis of eccentric loading on hollow shaft
Sl. No.
Rotation (rpm)
Eccentricity Von Mises Stress N/m2 x
108
(K) Pa m1/2 x
1008
1 29600 0 2.5 0.495
2 29800 12 2.5 0.495
3 29550 18 2.5 0.495
4 29500 24 2.5 0.495
Fig. 18. Computational eccentricity VS angular rotation for hollow shaft
0.35 0.4 0.45 0.5
25 26 27 28 29 30
K
(
P
a
. m
0
.5)
×
1
0
8
Rotation (r.p.m.) × 1000
0 5 10 15 20 25
29400 29500 29600 29700 29800 29900
Ec
ce
n
tr
ic
it
y
(m
m
)
Rotation (r.p.m.)
[image:5.595.312.552.514.700.2]Discussions under Comparative Persepctive
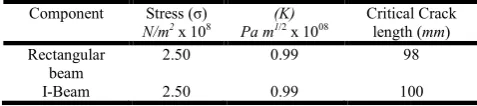
First Case
[image:6.595.42.281.184.237.2]It has been revealed from the comparative study (as shown in Table 9) between a rectangular beam and an I-beam under similar conditions that the I-beam is safer from rectangular beam in order to get rid of crack propagation.
Table 9. Comparison between rectangular beam and i-beam
Component Stress (σ) N/m2 x 108
(K) Pa m1/2 x 1008
Critical Crack length (mm) Rectangular
beam
2.50 0.99 98
I-Beam 2.50 0.99 100
Second Case
[image:6.595.41.285.351.393.2]On the other hand, if we compare between a hollow and a solid circular shaft under the similar conditions, crack propagation will start earlier in case of solid circular shaft than in case of hollow circular shaft as is evident from Table 10.
Table 10. Comparison between solid and hollow shaft
Component Stress (σ)
N/m2 x 108
(K) Pa m1/2 x 1008
Critical Crack length (mm)
Solid shaft 2.50 0.626 40
[image:6.595.40.284.439.482.2]Hollow shaft 2.50 0.626 56
Table 11. Comparison between i-beam and hollow shaft
Component Stress (σ) N/m2 x 108
(K) Pam1/2 x 108
Critical load equivalent (rad. / sec.)
I-Beam 2.50 0.495 2904.50
Hollow Shaft 2.50 0.495 3087.67
Third Case
Finally, on comparison between I-beam and hollow shaft under similar stress field and stress concentration factor, it may be concluded that a hollow circular shaft is safer than an I-beam as it can withstand more amount of equivalent critical load as shown in Table 11.
Conclusion
As seen from the results the crack propagation varies from material to material and the crack propagation is nothing but the process of energy conversion where stress concentration factor or stress intensity factor is the unique parameter which represents the magnitude for stress field severity near a crack tip, it gives the measure of strength at the crack tip. From the result of the analysis on CATIA V5 software it has been seen that, I-beam is better than rectangular beam under point load. For rotational loading between hollow shaft and solid shaft, hollow shaft is better and between I-beam and hollow shaft also hollow shaft is better. Because of the crack length in hollow shaft is much higher than other structure taken so hollow shaft is better in engineering structure compare to I-beam.
REFERENCES
Curtin W. A., Deshpande V. S., Needleman A., Giessen Van der E., Wallin M., 2010. “Hybrid discrete dislocation models for fatigue crack growth”.
Gürses Ercan, Miehe Christian, 2009. “A computational framework of three-dimensional configurational-force-driven brittle crack propagation”. Computer Methods in
Applied Mechanics and Engineering, 198: 1413-1428.
Hurley P.J., Evans W.J., 2007. “A new method for predicting fatigue crack propagation rates”. Materials Science and
Engineering, 466(1–2): 265-273.
Miserez A., Rossoll A., Mortensen A. 2004. “Investigation of crack-tip plasticity in high volume fraction particulate
metal matrix composites”. Engineering Fracture
Mechanics, 71:2385-2406.
Sadananda K., Vasudevan A.K, 1997. “Short crack growth and internal stresses”, International Journal of Fatigue, 19(93): 99-108.
Seweryn Andrzej, 1994. “Brittle fracture criterion for structures with sharp notches.” Engineering Fracture
Mechanics, 47(5):673-681.
Shimojo M., Chujo M., Higo Y., Nunomura S., 1993. “Effect of load ratio on the deformation behaviour of fatigue crack tips”. International Journal of Fatigue, 15(6): 455-459. Wang Zhiqiang, Nakamura Toshio, 2004. “Simulations of
crack propagation in elastic–plastic graded materials”.
Mechanics of Materials, 36(7): 601-622.