Improving the On Time Delivery performance by the
implementation of a Sales Inventory & Operations
Planning process
Taking into account the optimization of inventory parameter settings
of components with different demand patterns
Master Thesis
Final version – 25 November 2015
S. Donderwinkel, BSc
Industrial Engineering and Management
University of Twente
Supervisors University of Twente:
Dr. P.C. Schuur
Dr. Ir. Ahmad Al Hanbali
Supervisors Power-Packer Europe
M. Rindt
i |
P a g e
University of Twente
Power-Packer Europe B.V.
Faculty of Management & Governance
Postbus 217
P.O. Box 327
7500 AE Enschede
7570 AH Oldenzaal
Master Thesis
Improving the On Time Delivery performance by the
implementation of a Sales Inventory & Operations
Planning process
Taking into account the optimization of inventory parameter settings of
components with different demand patterns
Author:
S. Donderwinkel, BSc
Supervisor Power-Packer Europe:
M. Rindt – Logistic Manager
H. Langenhof – Logistic Team Leader
Supervisors University of Twente:
Dr. P.C. Schuur
iii |
P a g e
0% 10% 20% 30% 40% 50% 60% 70% 80% 90% 100% O ct -14 N o v-14 De c-14Jan-15 Feb
-15 Mar -15 A p r-15 May-15 Ju n -15
OTD Performance SV&E
Management summary
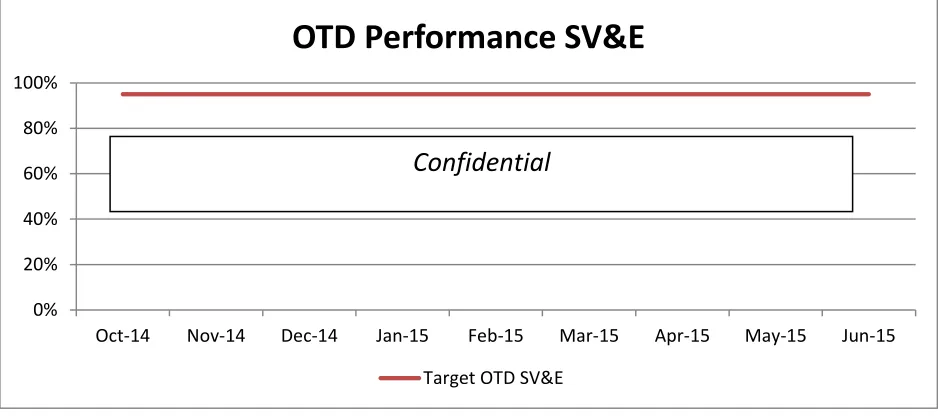
This Master thesis provides an analysis of the On Time Delivery (OTD) performance in the Special Vehicles & Equipment (SV&E) market at Power-Packer Europe and lays a foundation for an improved inventory management system in combination with the set-up of a Sales Inventory & Operations Planning process to improve the OTD performance. The current OTD performance is, with an average of 70% (fictitious number), far below the 95% target, see figure 0-1. The On Time Delivery (OTD) analysis revealed that the major root cause for the poor performance is the material supply, which means not all necessary components are available to start the production of a certain product on time.
Due to lower prices abroad, Power-Packer Europe shifted from
local component sourcing to component sourcing abroad. This resulted in longer supplier lead times and thus a less flexible supply chain. For the serial production in the Automotive and Truck business this does not cause many problems because customers provide forecasts more than 12 months upfront. However, the SV&E market depends on single incoming orders which should be delivered to the customer within 5 weeks. Currently the inventory system is not organized to properly deal with these intermittent demand patterns in the SV&E market, which results in a poor On Time Delivery (OTD) performance towards customers. Therefore the following main research question has been formulated:
“How can Power-Packer Europe improve the On Time Delivery (OTD) performance in the Special Vehicle & Equipment market, based on a customer lead time of maximal 5 weeks?”
This research question is answered quantitatively by (1) the introduction of a component classification model based on the component lead time, value and demand pattern and (2) a foundation for a new inventory replenishment policy and forecasting method suited for the complex intermittent demand pattern which is common in the SV&E market. The qualitative part is represented by the implementation of a Sales Inventory & Operations Planning process.
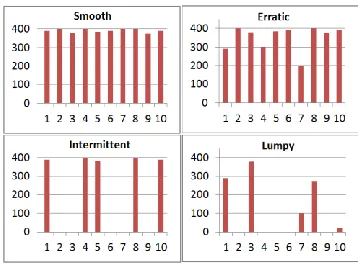
The component classification model at Power-Packer, which is mainly used to determine safety stock, is only based on supplier location and component value but does not take different demand patterns into account. Because of this, the calculation of the safety stock quantities only works for smooth demand patterns. We propose a new component classification model, which distinguishes components also based on lead time and demand pattern. Four main demand patterns can now be classified; Smooth, Erratic, Intermittent and Lumpy, see figure 0-2. Based on this classification the right
inventory parameter settings, like required safety stock quantities and stock on hand, per component can be determined more
[image:5.612.362.541.509.644.2]accurate to meet the On Time Delivery service level. Besides this, the classification gives a good indication which components are risky to purchase abroad. For example, components showing a lumpy demand should be sourced locally if possible.
Figure 0-1 OTD Performance SV&E
iv |
P a g e
Forecasting and setting the right inventory settings for components which show a demand pattern other than a smooth demand pattern is a complex case due to the high uncertainty of when the demand occurs and at what quantity. We propose to use Croston’s forecasting method for components with an intermittent demand pattern. We conducted a forecast accuracy comparison between Croston’s forecasting method and the forecast method currently used at Power-Packer; this numerical experiment indicated that Croston’s forecasting method performed 10-12% better than the forecasting method used at Power-Packer. Besides this, Croston’s forecasting method forms the foundation for the order-up-to inventory replenishment policy we outlined and simulated in this report.
The simulation of this new order-up-to inventory replenishment policy, which is especially designed for components with an intermittent (and lumpy) demand pattern, showed that to obtain the target service level of 95% for these components, the inventory value increases by 53% for components with an intermittent demand and 83% for components with a lumpy demand. This corresponds to an extra investment of 199,000 (fictitious number) euro in inventory value to attain the 95% availability target. This investment would be needed for the 37 components with an intermittent demand pattern and the 20 components with a lumpy demand pattern, which were embedded in a product which had an On Time Delivery problem in the period July 2014 up to and including May 2015. Assuming that these critical components caused the On Time Delivery problem and all other components were on stock, this investment would be needed to obtain the On Time Delivery target of 95%.
Although an optimal inventory replenishment policy could improve the On Time Delivery performance, it is recommended to use our proposed classification method to identify the critical components with an intermittent and lumpy demand pattern, and find local suppliers for these components which can deliver them within 10 workdays. However, further research is needed to determine the cost of local sourcing compared to holding the extra amount of inventory proposed by our new inventory replenishment policy.
Besides the quantitative part, the more qualitative Sales Inventory & Operations Planning (SIOP) process, implemented during the execution of this master thesis, forms a new foundation for setting correct inventory parameter settings while taking inventory holding costs into account. This will result in an improved On Time Delivery performance and higher customer satisfaction. A cross functional team monthly reviews, discusses and takes appropriate action based on six main topics: “Forecast accuracy performance”, “Inventory and forecast settings of the top 10 selling products”, “On Time Delivery performance and problem causes”, “Cost of expedited freight”, “Upcoming unusual sales”, and “Safety stock settings”.
Quantitative inventory models provide a good basis for parameter settings, but the human knowledge and interaction is still needed, the SIOP meetings provide a basis for reviewing, discussing and making agreements about these parameter settings. Eventually this must lead to consensus between all stakeholders and improve the On Time Delivery performance in the SV&E market.
Recommendations: Responsible Deadline
Implement our proposed component classification model (classify based on value, supplier lead time and demand pattern).
Hans Langenhof
01-02-2016
Source components with an intermittent and lumpy demand pattern locally to reduce the supplier lead time to a maximum of 10 workdays.
Purchasing 01-12-2016
Implement Croston’s forecasting method for products with an intermittent demand pattern which (eventually) cannot be supplied within 10 workdays
Sales 01-02 2016
Go on with the implemented SIOP process and optimize discussion topics based on experience during the SIOP meetings.
Hans Langenhof
01-01-2016
Validate supplier lead times. LSE team 01-02-2016
Register forecasted demand versus actual demand to determine the forecast error, and use this forecast error to determine optimal safety stock quantities.
v |
P a g e
Preface
After an amazing time in Enschede and at the University of Twente, this Master thesis finalizes my master program Industrial Engineering and Management with the specialization Production and Logistics Management. This final research has been conducted at the headquarters of Power-Packer Europe in Oldenzaal.
First of all I would like to acknowledge all people that contributed to the successful fulfillment of my Master’s degree: my roommates who kept me awake when I desperately needed my sleep, the boys from my fraternity Χάος (Chaos) who called me a pussy when I did not drink every Wednesday evening, my car which broke down several times during my time at Power-Packer, my boyfriend Jordi who is always late, my best friend Yvet who left me alone at the University after my Bachelor and of course my parents who stopped paying my school fee last year. Luckily it took me hours to think about the previous sentences, because without all of you, and all others I needed but did not mention by name, I would not have been able to finish my Master thesis successfully: I love you all!
It took a lot of energy and sleepless nights, but despite that I had a nice and educational time at Power-Packer Europe. I would like to thank my supervisor Martien Rindt for this opportunity and his support. But also Hans Langenhof should not be forgotten; he spent a lot of time with me both during workhours and breaks and taught me all ins and outs of the logistics at Power-Packer. And although I thought I was an Excel expert, Albert van Wezel was able to support me with all complicated Excel issues.
It was a pleasure to work with all people at the logistical department, where I was not the only one who got to get coffee for everyone. We even ate pancake rolls on Thursdays with a select group. Every day, at my desk, I had the pleasure to look at my right, where lovely Karin was sitting. Only after a few weeks she realized I was not looking at her but at the Car Dealership outside, fortunately we had a good laugh about it.
Of course I would also like to thank all other people at Power-Packer who supported me and my research, especially all people who attended the Sales Inventory and Operation Planning (SIOP) meeting I set up during my time at Power-Packer.
Next to all others I would like to thank my supervisors Peter Schuur and Ahmad Al Hanbali from the University of Twente, who reviewed my work and gave good advice about how to proceed and improve.
Although I mentioned him before, Jordi Huirne deserves special thanks for the hard time I sometimes gave him. I, a busy man who got to work at Bleeker Occasions even after 5 o’clock, a precisian and someone who does not sleep very well, can be quite a pain in the ass. But he survived, and so did we.
I’m ready for the next challenge.
Steven Donderwinkel
vi |
P a g e
vii |
P a g e
Abbreviation List
Abbreviation Explanation
ADI Average inter-Demand Interval Average interval between two consecutive demands
ASCP Advanced Supply Chain Planning ERP planning module in Oracle
BOM Bill Of Materials List of all components embedded in the end product
CV Coefficient of Variation Measure of dispersion (of a probability distribution)
EDI Electronic Data Interchange Used to process demand schedules send by customers
ERP Enterprise Resource Planning Business management software, used to collect, store and manage data
FG Finished Goods Products which are ready to be shipped
KPI Key Performance Indicator A performance measurement
LOB Line Of Business The different market segments: SV&E, Automotive, Medical, Truck
LSE Logistics System Engineer Function within the Logistics department
LT Lead Time Time it takes from ordering to delivery of a product
MAD Mean Absolute Deviation Accuracy measure: average of the absolute difference between forecast and actual demand
MOQ Minimum Order Quantity The minimum quantity a customer must order
MSE Mean Squared Error Accuracy measure: average of the squared errors
OTD On Time Delivery Performance indicator for on time delivery of products
NOTD Not On Time Delivery Performance indicator for not on time delivered products
PO Purchase Order Purchase Order Power-Packer places at the supplier
RASCI Responsible, Accountable, Supportive, Consulted, and Informed
Describes who is responsible for certain tasks and deliverables in a project
SFFG Shop Floor Finished Goods Finished products which are not yet booked in inventory
SLOB Slow Moving and Obsolete Products which are in inventory but (nearly) not used
SOP Sales Order Processing Department which processes all incoming orders
SIOP Sales Inventory & Inventory Planning See section 4.3 for a detailed description
viii |
P a g e
ix |
P a g e
Contents
Management summary ... iii
Preface ... v
Abbreviation List ... vii
1.
Introduction ... 1
1.1
Company profile ... 1
1.2
Research topic and motivation ... 1
1.3
Research Questions ... 2
1.4
Research Approach ... 3
1.4.1
Research goal ... 4
1.4.2
Deliverables ... 4
1.4.3
Research method ... 4
1.5
Scope and assumptions ... 4
2.
Current situation ... 7
2.1
Flow chart departments ... 7
2.1.1
Sales Order Processing (SOP) ... 7
2.1.2
Planning ... 7
2.1.3
Oracle ... 8
2.1.4
Expeditors ... 8
2.1.5
Warehouse ... 8
2.1.6
Lead Times ... 8
2.2
Current replenishment policy and determination of safety stocks ... 9
2.2.1
Non-MRP planned safety stock ... 9
2.2.2
MRP planned safety stock ... 11
2.2.3
Replenishment policy ... 12
2.3
Current forecasting methods ... 12
2.4
Conclusion ... 13
3.
Problem description ... 15
3.1
Problem identification ... 15
3.1.1
OTD and Overdue ... 15
3.1.2
Current situation ... 16
x |
P a g e
3.1.4
On Time Delivery Analysis ... 17
3.2
Problem diagram ... 19
3.3
Identification of the core problem ... 19
3.4
Involved parties ... 20
3.5
Conclusion ... 20
4.
Literature Study ... 21
4.1
MRP and corresponding system parameters ... 21
4.1.1
MRP Approach ... 21
4.1.2
Oracle MRP inventory support ... 21
4.1.3
Parameter settings in an MRP system ... 22
4.1.4
Safety stock calculation using Mean Absolute Deviation (MAD) ... 23
4.2
Demand pattern and inventory model classification ... 23
4.2.1
Demand pattern classification ... 25
4.2.2
Forecasting methods for intermittent demand ... 26
4.2.3
Inventory policy for intermittent demand ... 27
4.3
Sales Inventory & Operations Planning (SIOP)... 29
4.4
Conclusion ... 31
5.
Component classification methods... 33
5.1
NOTD component analysis ... 33
5.1.1
Bill Of Materials (BOM) ... 33
5.1.2
Component value ... 33
5.1.3
Supplier lead time (risk) ... 34
5.1.4
Demand patterns ... 34
5.1.5
The component classification model ... 35
5.2 Conclusion - Quantitative part 1 ... 36
6.
The foundation for an improved inventory management system ... 37
6.1
Inventory parameter settings and inventory replenishment ... 37
6.1.1
Demand Time Fence (DTF) ... 37
6.1.2
Safety stock parameter settings ... 38
6.1.3
Comparison of forecasting methods (Croston versus Demantra) ... 38
6.1.4
Inventory Replenishment – Order-up-to Levels based on Croston ... 39
xi |
P a g e
6.1.6
Conclusion – Quantitative part 2 ... 46
6.2
Sales Inventory & Operations Planning (SIOP)... 49
6.2.1
Team Members ... 49
6.2.2
Product scope of the SIOP meeting ... 49
6.2.3
SIOP Process ... 50
6.2.4
SIOP Implementation plan ... 54
6.3
Conclusion – Qualitative part ... 55
7.
Conclusion and Recommendations... 56
7.1
Conclusions ... 56
7.2
Recommendations ... 57
7.3
Discussion / (Limitations) ... 58
7.4
Further research ... 59
References ... 60
Appendix A – Overdue per SV&E customer ... 62
Appendix B – Overdue Analysis ... 63
Appendix C – Products with OTD problems ... 66
Appendix D – Literature search ... 67
Appendix E – Forecast methods based on Croston ... 68
Appendix F – Demand pattern classification ... 69
Appendix G – Forecast accuracy comparison ... 70
Appendix H – Simulation output ... 71
Appendix I – Sensitivity analysis output ... 72
1 |
P a g e
1.
Introduction
1.1 Company profile
Power-Packer Europe is founded in 1970, with its headquarters in Oldenzaal the Netherlands. Power-Packer is an independent subsidiary of the US based Corporation Actuant. The Actuant Corporation is listed on the NYSE and is a 1.5 billion multinational company.
Power-Packer manufactures (electro) hydraulic actuation systems for convertible roofs, lifting cabins of trucks, medical equipment, marine doors, stabilizing legs, wire ropes, latches and engine air flow management solutions. Power-Packer develops, assembles and markets systems for customers on a global basis including OEM’s and Tier 1’s in diverse end-markets. Renowned car and truck manufactures are among their regular customers. Power-Packer Europe is ISO/TS certified and has been granted many supplier awards (Power-Packer, 2015) .
Power-Packer markets served include: Automotive, Truck, Medical, Marine, Special Vehicles & Equipment (SV&E).
Besides the headquarters in Oldenzaal, Power-Packer has facilities in, Germany, France, Spain, Turkey, India, Brazil, Mexico and the USA, employing over 1000 people. At Power-Packer in Oldenzaal the production focus is on the Trucking, Special Vehicles & Equipment (SV&E) and Medical applications. The production of the automotive related parts has been reallocated to Turkey, but all other activities, like sales, forecasting and purchasing, are still performed in Oldenzaal.
Within the framework of the Master of Science program Industrial Engineering & Management, I performed research on the On Time Delivery (OTD) problems at the Logistics department of Power-Packer in Oldenzaal.
1.2 Research topic and motivation
[image:15.612.329.545.242.360.2]The start of this thesis was initiated by the logistics department at Power-Packer Oldenzaal, who faces severe problems with the on time delivery of products and high overdue in the Special Vehicles & Equipment market. The Automotive and Truck market demand can be forecasted quite reliably because the system is constantly updated using the so called EDI schemes provided by the customers. These EDI schemes are filled with the customer forecast. The SV&E market on the other hand depends on single incoming orders from smaller customers, these orders must be shipped to the customer within the maximum lead time of 5 weeks, with an On Time Delivery (OTD) target service level of 95%. Although material sourcing from abroad seemed a good and cheaper option in the past, the longer supplier lead times in combination with the unpredictable demand and inconsistent inventory
[image:15.612.77.548.434.562.2]Figure 1-1 Cabrio hydraulic system
2 |
P a g e
levels are causing expensive emergency transportation costs and the inability to start the production on time. The exact causes of the low OTD performance however, will be researched and analyzed in this thesis. Besides the low OTD performance, Power-Packer faces high Overdue which is partly caused by the low OTD performance. Overdue is a measure in euros of the total value of orders which cannot be invoiced before the order due date because they are not shipped to the customer before the order due date.
Also the project initiators, Martien Rindt and Hans Langenhof, are supporting the lack of proper internal procedures (way of working) and indicate that the current system set-ups are not completely supporting the demand conditions of the customer (single orders, max lead time of 5 weeks, 95% OTD). Based on experience and the recommendations of external consultants which visited Power-Packer previous year, the implementation of a Sales Operations & Inventory Planning (SIOP) is initiated as a possible solution to improve current parameter settings and enhanced cooperation between different departments.
In short, within Power-Packer there is demand for an adjusted inventory management model which suits the demand patterns and conditions in the SV&E market. Besides this quantitative approach, the implementation of a Sales Inventory & Operations Planning procedure should support the decision making of parameter settings based on the combined knowledge within the different departments. Together this should form the foundation for an improved On Time Delivery (OTD) to customers.
1.3 Research Questions
In order to address the issues mentioned in section 1.2 and to properly determine how to optimize the processes and procedures at the logistical department at Power-Packer Oldenzaal, the following core research question is formulated:
Core research question:
“How can Power-Packer Europe improve the On Time Delivery (OTD) performance in the Special Vehicle & Equipment market, based on a customer lead time which is at maximum 5 weeks?”
To answer this core research question, the core research question is divided in multiple sub research questions; the so called knowledge questions (Heerkens J. , 2005). These questions will be answered by interviews, available data analysis from Power-Packer and reviewing related literature. Section 1.4.2 provides the research method corresponding to each sub question. The following research questions are formulated:
Research questions:
1. What is the current way of working from order acceptance up to and including shipment within the SV&E market?
a. What does the current flow chart of the involved departments look like?
b. What are the internal lead times from the different departments and what do they actually do in this lead time?
c. How much lead time remains for the suppliers if all internal lead times are subtracted from the maximum customer lead time of 5 weeks?
d. What does the current replenishment policy look like? e. How are the current safety stock levels determined?
f. How is the current forecast method built-up and what is the performance of this forecast?
2. What are the underlying main problems that cause the poor OTD and Overdue performance in the SV&E market?
a. How are On Time Delivery (OTD) and Overdue defined and related within Power-Packer Europe? b. How does the current overall OTD perform?
3 |
P a g e
d. What are the main problems which cause the poor On Time Delivery and Overdue performance? e. What are the underlying causes of these main problems?
f. Which specific products cause the poor On Time Delivery performance?
3. Based on the literature, how can a Sales Inventory & Operations Planning (SIOP) process improve the On Time Delivery and which inventory replenishment policy can be used for the demand pattern corresponding to the uncertain single order SV&E market?
a. What is Sales Operations & inventory Planning (SIOP) and how can it improve the overall supply chain in general?
b. Which inventory replenishment models are supported by the Oracle ERP system which Power-Packer currently uses?
c. How can the different component demand patterns be distinguished?
d. Which inventory replenishment model is able to determine appropriate inventory and safety stock levels in the uncertain single order SV&E market?
4. Which component classification model is able to determine the high risk components for the On Time delivery performance in the selected NOTD products?
a. Which components are embedded in the NOTD products?
b. Which components have a too high supplier lead time in order to react fast to changes? c. How can components be valuated based on their purchase value?
d. Which components do not have sufficient safety stock to cover for uncertainties?
e. What are the demand patterns corresponding to the components used in the SV&E market?
5. How does the new inventory replenishment policy for intermittent demand patterns perform and what are the corresponding parameters settings per component in the NOTD products?”
a. Which inventory replenishment method should be applied to the different components? b. What are appropriate safety stock methods?
c. What is the impact on cost of implementing this new inventory replenishment method?
d. What are possible options, besides adding extra stock or the implementation of a new inventory replenishment method, to improve the On Time Delivery?
6. What is the appropriate set-up of the Sales Inventor & Operations Planning (SIOP) for Power-Packer Europe in order to be able to increase the On Time Delivery performance in the SV&E market?
a. Which departments/people should be part of the SIOP meetings and what are their responsibilities? b. What subjects should be handled during the SIOP meetings?
c. Which tools should be developed to support the SIOP decision making process? d. Which information should the departments share at the SIOP meetings? e. How should the implemented procedure and system set-up be maintained?
7.
What is the impact of implementing the new inventory model and SIOP process compared to the current situation?1.4 Research Approach
4 |
P a g e
Doorewaard, 2010). Section 1.4.1 states the research goal and research objects. In section 1.4.2 the research method for each research (sub) question is provided.
1.4.1
Research goal
The goal of this research is to lay a foundation to improve the On Time Delivery (and corresponding Overdue) performance within the SV&E market. The processes, procedures and parameters used to streamline the logistical performance must be reviewed and improved where possible. This includes identifying critical components, optimally assigning inventory methods to products / components and the implementation of a Sales Inventory and Operations Planning (SIOP) process to support decision making about inventory parameter settings.
1.4.2
Deliverables
This thesis should deliver the following:
Quantitative:
Product / component (demand pattern) classification model which forms the foundation for the selection of the appropriate inventory method and inventory parameter settings.
Foundation for an improved forecasting method for items with an intermittent demand pattern.
Foundation for an improved inventory replenishment policy for components with an intermittent demand pattern.
Simulation model of the new inventory replenishment including the new safety stock determination method and Croston’s forecasting method.
Qualitative:
Sales Inventory & Operations Planning (SIOP) proposal and implementation.
Tools which support the analysis of discrepancies between incoming orders, the forecast, current on hand inventory and safety stock settings, in order to make correct decisions about logistical parameter settings during the SIOP meetings.
1.4.3
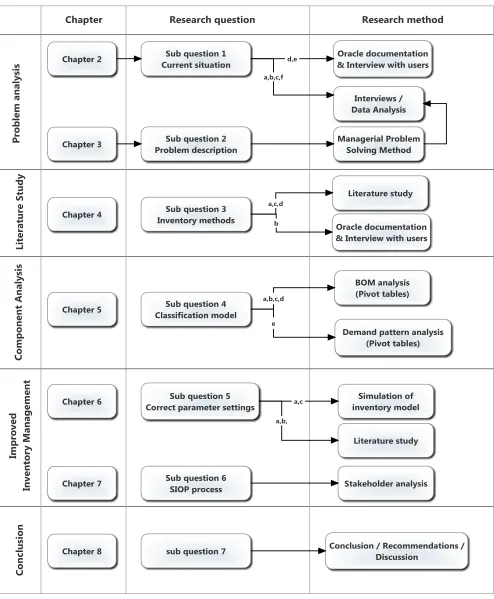
Research method
This section provides a clear and simple matrix with the used research method per research question, see figure 1-4 on the next page. The use of these methods gives the ability to answer each research question, which eventually should answer the core research question.
1.5 Scope and assumptions
In this section the scope (boundaries) and assumptions of this research will be outlined:
The research will focus on the Special Vehicles & Equipment (SV&E) market. Although the processes and procedures in the SV&E market are comparable to the Medical market Power-Packer serves, the scope is limited to the SV&E market because the number of components to review is already over a hundred. However, the developed tools and procedures could also be used in these other markets.
To limit the scope, the indebt analysis of products will only focus on products which caused an On Time Delivery problem in the period July 2014 – June 2015.
The in-depth analysis of the Not On Time Delivery (NOTD) causes will only be executed for the major cause of the Not On time Delivery; the material shortage, see paragraph 3.1.4.
Production planning will be left out of scope.5 |
P a g e
The impact of the Warehouse move from the “Hanzepoort” to the production site a few kilometers away [image:19.612.76.570.108.707.2]will be left out of scope.
6 |
P a g e
7 |
P a g e
2.
Current situation
In this chapter the current situation at Power-Packer Oldenzaal is described. Section 2.1 provides a short overview and description of the departments which could have an effect on the target customer lead time of 5 weeks. In section 2.2 the current determination of safety stocks and inventory levels is outlined. Finally section 2.3 elaborates on the forecast method currently used. Research question 1 and the accompanying sub questions are thereby answered.
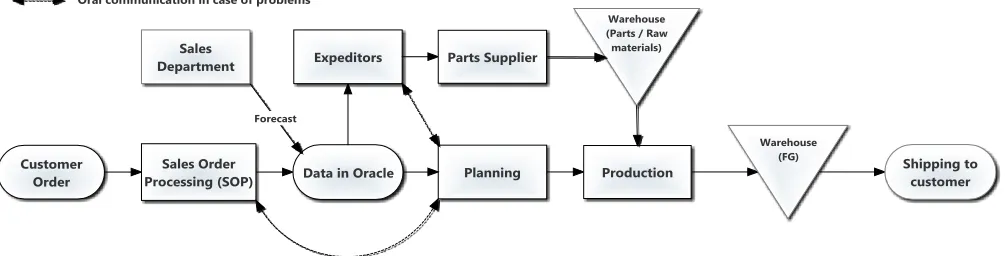
2.1 Flow chart departments
In figure 2-1 a flow chart of the current situation is depicted. Only the steps which relate to the current internal lead time are taken into account. In the next paragraphs each step is discussed in more detail. Finally, the remaining supplier lead time is determined, which is equal to the five weeks customer lead time minus the internal lead times. Based on this calculation, it is possible to identify which suppliers are critical in the supply chain to reach the objective: a maximum customer lead time of five weeks, with 95% On Time Delivery (OTD).
2.1.1
Sales Order Processing (SOP)
The Sales Order Processing (SOP) department processes all incoming orders. As opposed to the Automotive and Truck orders which come in via Electronic Data Interchange (EDI), the orders from SV&E customers come in by email. These orders need to be processed manually into the ERP system (Oracle). This is quite a time consuming task, in which a mistake is easily made. Normally the SOP department processes the incoming orders within 24 hours. Some customers deliver order schedules with an additional number of weeks with a demand forecast. However, in the SV&E market these schedules are rare; only 3 customers provide a forecast with a maximum of 6 months. These weekly schedules can change a little each week, but enable Power-Packer to make a more reliable forecast for the coming weeks. Based on the product lead time, the SOP department sets a due date for the order. In general this lead time is 5-6 weeks. If a customer order requests a due date within the normal lead time, SOP contacts the planning department to ask whether it is possible to deliver the order on the requested due date.
2.1.2
Planning
After the SOP department processed all incoming orders, the planning department can make an aggregated planning. Although the production of one single order normally does not take more than one day, the planner provides production with the overall demand schedule of the upcoming week. This gives production some flexibility; they can plan the sequence of the orders themselves. For example, an order with a due date on Monday
[image:21.612.75.579.275.403.2]June 15 must be produced somewhere in the week before (June 8 until 12), see figure 2-2. Figure 2-1: Flow chart departments
8 |
P a g e
2.1.3
Oracle
Since November 2013 Power-Packer Oldenzaal uses a new ERP system called Oracle. Previously they used the ERP system BAAN, but the parent company Actuant Corporation uses Oracle. This system connects all business activities, like Sales, Planning, Logistics, Production and Warehousing.
2.1.4
Expeditors
The expeditors are responsible for the material planning and purchase. Of course, the Purchasing department is responsible for supplier selection, contracts, prices and agreements about reserved raw material for Power-Packer. The purchasing department handles all material purchases for which no contract is available yet, in all other situations the materials are automatically order when the expeditors run the MRP system, which calculates the required materials. In the ideal situation this task would be nothing more than just purchasing the material requirements which are calculated by Oracle, but unfortunately this job becomes much more complicated and challenging due to suppliers which cannot deliver on time or rush orders. As mentioned before, sometimes SOP gets a customer request to deliver the products within the specified customer lead time. If this is the case, the planner gets in contact with the expeditors to verify if they can get the required materials on time.
2.1.5
Warehouse
While writing this report, Power-Packer Oldenzaal is executing a big warehouse project. The warehouse, which is currently situated at the Hanzepoort, will be moved to the production location which is a few kilometres away. This project should save a lot of (transportation) time and money, but is out of the scope of this project.
2.1.6
Lead Times
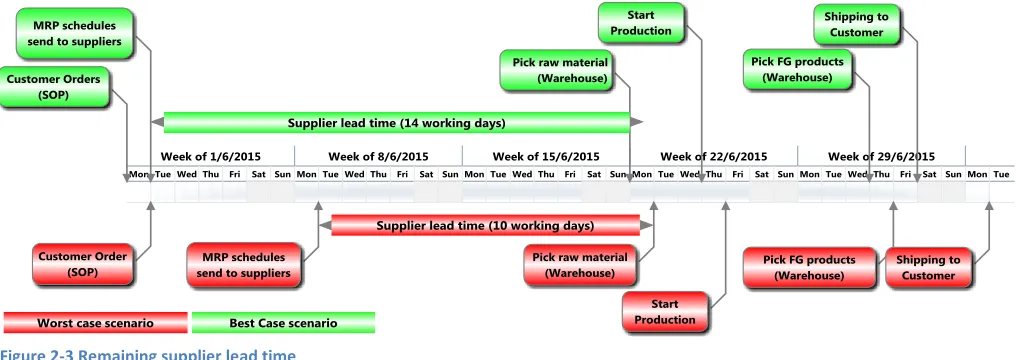
[image:22.612.67.575.542.722.2]Power-Packer’s ultimate goal is to deliver 95% of all SV&E products within a customer lead time of 5 weeks. To be able to determine which items and suppliers are critical in achieving this objective, the current situation must be analysed to determine the remaining supplier lead time. As was previously mentioned, SOP normally needs only one day to process the incoming orders. In the ideal situation the required parts will be ordered the same or the next day, but the current system only orders on Tuesday morning (MRP runs in the night of Monday – Tuesday). So, if an order is processed on Monday the materials will be ordered the next day. But if SOP processes the order on Tuesday the required materials will be ordered a week later on Tuesday. Taking into account the three days currently required to pick and inspect the raw materials from the internal warehouse, the 7 days required for production and the 2 days needed to move and pick the finished goods, only 10 working days are leftover for the supplier to deliver the parts! This means that if Power-Packer wants to meet the target customer lead time of five weeks, in the worst case all parts which cannot be supplied within 10 working days must be on stock when the order comes in or should have been ordered already based on an (accurate) forecast, see figure 2-3.
9 |
P a g e
2.2 Current replenishment policy and determination of safety stocks
In this section the current determination of safety stock and inventory base stock levels on component level is described. Oracle provides several options to calculate the safety stock of a component. Within Power-Packer they make use of the option “MRP planned percent” and “Non-MRP planned”. Within SV&E more than 90% of the items have a fixed safety stock which is calculated based on the “Non-MRP planned” method, see section 2.2.1. The other 10% is calculated based on the “MRP planned” option, see section 2.2.2.
2.2.1
Non-MRP planned safety stock
In case of the “Non-MRP planned” option, the safety stock is a fixed quantity which is calculated on the basis of an ABC/DE classification and the supplier location.
The ABC/DE analysis is used to determine the impact of a certain component on the total inventory costs. For example, 20% of the components are accountable for 80% of the total inventory costs. Within Power-Packer the ABC/DE analysis is based on the next two months forecasted inventory costs. The total value per component in the inventory is sorted from high to low. The components in this sorted list, which
together account for 80% of the total inventory value, get an A classification. The components which account for the next 80 till 95% of the total inventory are classified as B components. The remaining 95-100% gets a C classification, see table 2-1.
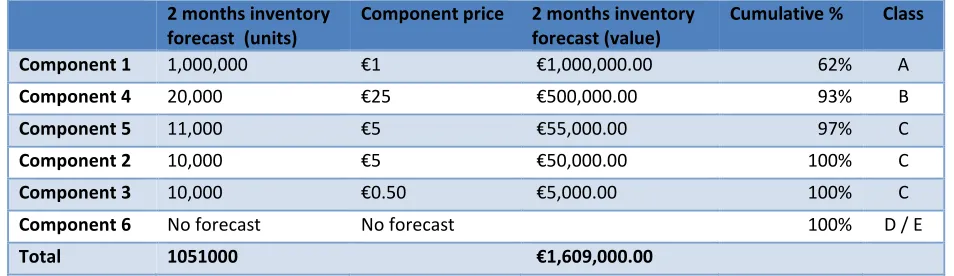
A simplified example of the ABC/DE classification heuristic will be explained below (see table 2-2):
1. Suppose the complete inventory consist of 6 components (see column 1)
2. Take the forecast in units per component for the next two months (see column 2)
3. Calculate the forecasted inventory value per component: column 2 times column 3 (see column 4) 4. The 2 months forecasted inventory value (column 4) is sorted from high to low
5. Next the cumulative percentage per component from the total forecasted inventory value is calculated: Component 1: (€1,000,000.00 / €1,609,000.00)*100% = 62%
Component 2: ((€1,000,000.00 + €500,000.00)/ €1,609,000.00) * 100% = 93% 6. Based on this cumulative percentage and table 2-1 the component gets an A,B or C classification:
Component 1: cumulative percentage is 62% see table 2-1 classification A Component 2: cumulative percentage is 93% see table 2-1 classification B
ABC/DE Classification
A Cumulative 0-80%
B Cumulative 80-95%
C Cumulative 95-100%
D Items with no forecast but with physical available stock
E Items with no forecast and without physical available stock
[image:23.612.68.545.560.698.2]Table 2-1 ABC/DE Classification
Table 2-2 Example ABC/DE Analysis
2 months inventory forecast (units)
Component price 2 months inventory forecast (value)
Cumulative % Class
Component 1 1,000,000 €1 €1,000,000.00 62% A
Component 4 20,000 €25 €500,000.00 93% B
Component 5 11,000 €5 €55,000.00 97% C
Component 2 10,000 €5 €50,000.00 100% C
Component 3 10,000 €0.50 €5,000.00 100% C
Component 6 No forecast No forecast 100% D / E
10 |
P a g e
This ABC/DE classification is the first part which is used to determine the fixed safety stock level. The next criterion is the location of the component supplier. The locations of the suppliers are divided in Europa (EUR), the Netherlands (NL), Turkey (TR), Overseas by Air (OverseasAir) and Overseas by boat (Overseas).
To calculate the safety stock quantity, the ABC/DE classification and the supplier location are merged. So if a component is produced in Europe and has an A classification, the merged term becomes: EurA. Based on this merged term the number of Safety Stock days (SS Days) can be looked up in a table, see table 2-3. For example: a component with an A classification with a supplier location in Europe needs 2 Safety Stocks days according to the table. The number of Safety Stock days in the table is based on experience without a proper foundation.
Location +ABC SS days Location +ABC SS days Location +ABC SS days Location +ABC SS days Location +ABC SS days
EurA 2 NLA 2 TRA 3 OverseasAirA 5 OverseasA 15
EurB 3 NLB 3 TRB 5 OverseasAirB 7 OverseasB 20
EurC 12 NLC 12 TRC 15 OverseasAirC 15 OverseasC 25
EurD - NLD - TRD - OverseasAirD - Overseas
D
-
Table 2-3 Number of Safety Stock days based on supplier location and ABC/DE classification for a component Eventually the fixed safety stock quantity is calculated using the following formula:
𝑭𝒊𝒙𝒆𝒅 𝑺𝒂𝒇𝒆𝒕𝒚 𝑺𝒕𝒐𝒄𝒌 = (𝟐 𝒎𝒐𝒏𝒕𝒉𝒔 𝒇𝒐𝒓𝒆𝒄𝒂𝒔𝒕 𝒊𝒏 𝒖𝒏𝒊𝒕𝒔
𝟖 𝒘𝒆𝒆𝒌𝒔 ∗ 𝟓 𝒅𝒂𝒚𝒔 ) ∗ 𝑺𝑺 𝒅𝒂𝒚𝒔
Fixed Safety Stock heuristic:
1. Determine if a component has an A,B,C,D or E classification 2. Determine the component supplier location
3. Merge the ABC/DE classification and the supplier location 4. Lookup the corresponding Safety Stock days in table 2-3
5. Determine the average daily forecasted inventory in units over the next two months
6. Multiply the average daily forecasted inventory in units with the number of Safety Stock days
In practice, these fixed safety stock amounts are updated only 4 times a year.
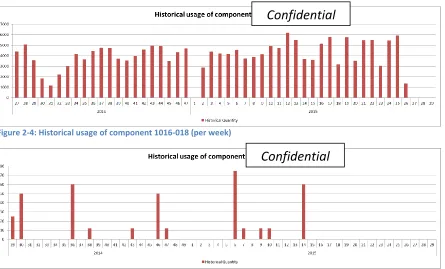
Running example: safety stock calculation in combination with intermittent demand patterns
The current safety stock determination method, described above, depends on the demand in the upcoming two months and was designed mainly for items which are used each week, see figure 2-4. However, within the SV&E market many components show a so called intermittent demand; a period with demand is followed by periods with zero demand. These periods with zero demand have a huge impact on the current safety stock calculation. Take for example component DSA8029-041 (Figure 2-5), which has a Spanish supplier and is categorized as a C-component, which results in 12 SS days according to table 2-3. Calculation of the safety stock on 14 September 2015 in the current situation will be as follows:𝑭𝒊𝒙𝒆𝒅 𝑺𝒂𝒇𝒆𝒕𝒚 𝑺𝒕𝒐𝒄𝒌 = (𝟐 𝒎𝒐𝒏𝒕𝒉𝒔 𝒇𝒐𝒓𝒆𝒄𝒂𝒔𝒕 𝒊𝒏 𝒖𝒏𝒊𝒕𝒔
𝟖 𝒘𝒆𝒆𝒌𝒔 ∗ 𝟓 𝒅𝒂𝒚𝒔 ) ∗ 𝑺𝑺 𝒅𝒂𝒚𝒔 = (
𝟏𝟓
𝟖 ∗ 𝟓 ) ∗ 𝟏𝟐 = 𝟒. 𝟓
11 |
P a g e
date. To be able to react on sales orders without a forecast, the supplier should have been able to supply within 10 working days. If this is not the case, the safety stock should cover this in the current situation because there is no stock held if there is no frequent demand. One of the logistical managers indicated this situation as playing “Russian Roulette”, in the best case there is still some inventory left from previous orders, but in the worst case there is no inventory at all to be able to supply the customer within the 5 weeks lead time.
2.2.2
MRP planned safety stock
The “MRP planned percent” safety stock is determined using safety stock buckets and safety stock percentages. In this case the safety stock is dynamic and will be updated by Oracle. The safety stock will be calculated as a user-defined percentage (called Safety Stock Percent) of the average gross requirements for a user-defined number of days. This user-defined number of days is equal to the Safety Stock Bucket Days. So if the user defined number of Safety Stock Bucket Days is equal to 5, Oracle will average the gross requirement over these 5 days. The average gross requirement per day is multiplied by the user defined percentage (Oracle, 2013). See table 2-4 for a simple example:
Average over 5 Bucket days (200)* Safety Stock Percentage (150%) = Safety Stock (300)
A small side note: the value of the safety stock in the inventory report of Power-Packer is not based on the average gross requirement over the specified number of bucket days, but is based on the average gross requirement over 2 months. The actual safety stock however, is calculated by Oracle, so this way of reporting has no influence on the safety stock calculation.
Safety Stock Bucket days
5
Safety Stock Percentage
150%
Demand 1-Jul-15
200
Demand 2-Jul-15
100
Demand 3-Jul-15
100
Demand 4-Jul-15
250
Demand 5-Jul-15
350
Average over 5 Bucket days 200
[image:25.612.75.520.146.415.2]Safety Stock
300
Table 2-4: Example MRP planned safety stock Figure 2-4: Historical usage of component 1016-018 (per week)
Figure 2-5: Historical usage of component DSA8029-041 (per week)
[image:25.612.368.545.459.606.2]12 |
P a g e
2.2.3
Replenishment policy
As mentioned in section 2.1.6 the required materials are ordered every Tuesday morning, based on the MRP calculations which run on Monday night. The MRP demand calculations are based on the forecast and sales orders. Of course, the sales orders which are already in the order book consume part of this forecast. Based on the forecast and the sales orders in the order book (+ safety stock), the MRP system calculates exactly when components need to be ordered to be on stock in time. Parts should be in inventory 2 weeks prior to shipping to the customer; this time is needed for production and warehouse activities. The MRP system works with a Demand Time Fence (DTF). Oracles user’s manual describes the DRF as follows: “The demand time fence is bordered by the current date and a date within which the planning process does not consider forecast demand when calculating actual demand. Within the demand time fence, Oracle Master Scheduling/MRP and Supply Chain Planning only consider actual demand. Outside the demand time fence, the planning process considers forecast demand” (Oracle, 2013). Figure 2-6 provides an example of the current situation with a DTF of 8 weeks. In the SV&E market, the Customer demand is generally only known for 6 weeks. The Advanced Supply Chain Planner (ASCP) sees zero demand after week 6. So using a Demand Time Fence of 8 weeks could result in a serious underestimation of demand.
Figure 2-6: ASCP demand translation of customer and forecast demand
The MRP replenishment policy used by Power-Packer Oldenzaal can be described by the so called Periodic review policy with variable order quantities. (R,s,S policy). The Review period is 1 week (ordering every Tuesday).
Generally the MRP module (part of the Oracle ERP system) calculates the combined demand of a hole week into one single purchase request. In most of the cases the purchased components have a Minimum Order Quantity (MOQ) and a Fixed Lot size. Due to these Minimum Order Quantities and Fixed Lot sizes it is possible that the on hand inventory level becomes higher than the actual quantities needed.
In short, the inventory level depends completely on the requirements entered in the MRP system, which take into account safety stock, Minimum Order quantities, Fixed Lot Sizes, forecasted demand and actual demand. However, the DTF settings determine which demand (customer or forecast) is used to calculate the demand requirements.
2.3 Current forecasting methods
The unsophisticated forecast method is mainly based on historical sales. The forecast could be updated every month based on information from the customer, which could for example be information about a customer increasing its production due to a big new order. The forecast, with a time horizon of 17 months, provides the number of units per product in a certain month and is mainly based on the history of the previous year. The monthly forecasted demand is sent to the ASCP module. ASCP, which is used by the planning and material
Week 1 2 3 4 5 6 7 8 9 10 11 12 13 14 15 16 17 18
Customer 100 100 100 100 100 100 ? ? ? ? ? ? ? ? ? ? ? ?
Forecast 100 200 50 100 70 100 100 100 100 100 100 100 100 100 100 100 100 100
ASCP 100 100 100 100 100 100 0 0 100 100 100 100 100 100 100 100 100 100
Production 100 100 100 100 0 0 100 100 100 100 100 100 100 100 100 100 100 100 Supplier 100 100 100 100 0 0 100 100 100 100 100 100 100 100 100 100 100 100
13 |
P a g e
purchasing department, divides the forecast into week buckets, which is not optimal as will be illustrated with the following running example:
The monthly forecast is 100 units; ASCP translates this to 25 units per week. If the monthly forecast of 100 units is based on one single customer who always orders 100 units at the same time, this translation into 25 units each week results in unnecessary ordering and handling costs. Besides this, the on hand inventory will be too low to supply the 100 units at the same time (except if the order is placed in the fourth week of course). This issue, caused by a setting in the “Demantra” forecasting module, is not yet solved and is beyond the scope of this thesis.
The responsible person for the SV&E forecast indicated that the overall forecast error is about 20%. Unfortunately this does not provide any information whether the amount was right per SKU! The Forecasted versus the Actual numbers per product are registered, but the validity of these numbers should be questioned. The person responsible for the forecast indicated that these numbers are manually saved and that wrong numbers could have been used in the past. So unfortunately the performance of the forecast cannot be determined and/or validated.
2.4 Conclusion
Chapter 2 gave answer to sub question 1: “What is the current way of working from order acceptance up to and including shipment within the SV&E market?”
Currently the Sales Order Processors (SOP) receives single incoming orders by email for the SV&E market and processes them in the ERP system Oracle, promising the customer a lead time of 5 weeks. Planning uses this input to make a production planning for one week. So, the production lead time is one week for all products. The expeditors / material planners run the MRP system which calculates what materials need to be ordered. If all internal lead times are subtracted from the customer lead time, 10 workdays are left for the supplier to deliver the materials. Besides the current way of working, the analysis of the current situation already revealed some serious problems which could harm the On Time Delivery performance:
The remaining supplier lead time for components which do not have an accurate forecast is only 10 days. This means components which cannot be supplied within 10 working days need to be on stock.
The current safety stock method only works for items with a smooth demand pattern. A serious availability problem for components with an intermittent demand pattern could be the result.
The replenishment policy is based on smooth demand patterns and accurate forecasts which are common in the Automotive and Truck market, but not in the SV&E market!
The Demand Time Fence (DTF) of eight weeks does not suit the sales order book which is filled for a maximum of 6 weeks, this results in a gap of 2 weeks without demand in the DTF.
Forecasting the SV&E market is a hard task for the Sales department and is currently mainly based on historical sales in a certain period.
14 |
P a g e
15 |
P a g e
3.
Problem description
This section provides the problem description related to the insufficient On Time Delivery performance and high Overdue at Power-Packer Oldenzaal. This description is based on the Managerial Problem Solving Method (MPSM) (Heerkens H. , 2012). In section 3.1 the problem identification is described. Section 3.2 provides the problem diagram which indicates main problem and the underlying causes of this problem. Section 3.3 outlines the core problem and finally section 3.4 describes the involved parties in this main problem.
3.1 Problem identification
This section elaborates on the On Time Delivery Problem and Overdue problem which were briefly mentioned in chapter 1 and 2. Paragraph 3.1.1 elaborates on the performance indicators OTD and Overdue and how they are related. The current situation, which has been discussed in chapter 2 and is further analyzed and outlined in section 3.1.2, is not in line with the desired situation. Therefore, paragraph 3.1.3 provides a short description of the desired situation. And finally paragraph 3.1.4 analyses the major underlying cause of the poor OTD performance. Based on this, the scope of this thesis can be narrowed to the most important issue.
3.1.1
OTD and Overdue
Power-packer uses On Time Delivery and Overdue as their main key performance indicators (KPI’s) for their logistical activities. These KPI’s are imposed by the Parent Company, Actuant. Although both indicators are related to each other, there are some important differences which need to be addressed. The On Time Delivery (OTD) KPI indicates whether an order is ready to be shipped before or on the due date. In most of the cases, products which are ready must be picked up by the customer themselves, which in practice means they need to arrange the transportation to their production plant. If the customer does not pick up the ready products before the due date, the order becomes Overdue. Power-Packer cannot invoice the customer before the order has been shipped. So, Overdue orders are orders which have not been invoiced before the due date. In short, orders get a Not On Time Delivery (NOTD) status if they are not ready before the due date, orders get an Overdue status if the order is not invoiced before the due date.
The On Time Delivery KPI can be defined as: All order lines which are produced on time and ready to be shipped from the warehouse before or on the due date specified on the order.
The Overdue KPI can be defined as: All order lines which could not be invoiced before the due date specified on the order (where invoicing is only possible after the products are shipped, unless the payment term is “prepayment”, in this case the customer needs to pay before the products are shipped).
The Sales Order Processing (SOP) department makes the On Time Delivery (OTD) reports. There are of course multiple reasons why a certain product could not be produced on time, see table 3-1 below for an overview of the Not On Time Delivery (NOTD) categories specified and registered by the SOP department.
HOLDS / QUALITY Engineering holds, Design related Quality issues, line move quality, part change raw.
CUST_ORDER < LEAD TIME Customer dropped in EDI orders less than Power Packer lead time.
MFG_CAPACITY Equipment and/or people related output constraints
MFG_EQUIP All issues related to Manufacturing equipment, tooling, spare parts shortage, etc.
MFG_QUAL Manufacturing quality defects, delays, extra inspection, etc.
MAT_SUP_CAPACITY / DELIVERY
Supplier capacity issue constraining their output and causing Power Packer customer NOTD events / Parts are not on time available at Power Packer
MAT_SUP_QUALITY Supplier quality issue resulting in a late delivery or unusable parts
16 |
P a g e
0% 20% 40% 60% 80% 100%
Oct-14 Nov-14 Dec-14 Jan-15 Feb-15 Mar-15 Apr-15 May-15 Jun-15
OTD Performance SV&E
Target OTD SV&E
LOGISTICS_EXPEDITION Log issues resulting in delay of having goods on time at shipping dock
ENGINEERING Engineering holds, Design related Quality issues, line move quality, part change raw, projects
SOP OE/update errors, delay SOP release/pick approve, auto Customer feed errors missed, decision not to ship due to consolidated shipments
CUST_CONV_OR_NEW_FG New part start-up/conversion (including RAW LT/available ,BOM delays, engineering release)
PUR_REQ Purchase requisition sent to supplier too late
[image:30.612.72.541.298.507.2]CUST_PAYMENT Customer is on credit hold or prepayment on shipment
Table 3-1: Not On Time Delivery root cause classification
Section 3.1.4 analyzes the frequency of occurrence in each category. This provides an indication about the major causes of the poor OTD performance were this thesis should focus on.
3.1.2
Current situation
The On Time Delivery performance is currently far below the target of 95%. After analysis of the On Time and Late shipments in the period October 2014 until June 2015, the average On Time Delivery was only X%, see Figure 3-1.
The average Overdue amount over the period December 2014 until May 2015 was €293,978.61 (fictitious number), see Appendix A. Every time an order is too late, this immediately causes Overdue. But besides late orders, there are also other causes for the Overdue (for example a customer paying too late). Determining all exact proportions of Overdue causes per case would be a very time consuming task because this data is not always available for each Overdue issue and if it is available the format is just a text note. However, as is discussed in section 3.1.1, the Overdue is correlated to the OTD performance, increasing the OTD performance would immediately result in a lower Overdue. A more in-depth analysis of the Overdue can therefore be found in Appendix B and will not be further handled in this thesis.
Currently the parameter settings and procedures to set and maintain these parameters seem to be a major problem. The following running example illustrates a case in which products are not delivered on time because the required items to produce the product were out of stock, although this should not have caused any problems when looking at the parameters in the ERP system.
Figure 3-1 Current OTD performance
17 |
P a g e
Running example:
After subtracting all internal lead times from the maximum customer lead time of 5 weeks, there remain 10 days for the external supplier to produce and deliver the parts to Power-Packer (see figure 2-3). In theory this would mean that all components from suppliers with a lead time of 10 days or less can be delivered on time and Power-Packer would not need any stock or safety stock for these components at all (ignoring lead time variability). Unfortunately, not all lead times in the ERP system seem to be correct. For example, a small sample of components was taken which were identified by the SOP employees as the Not On Time Delivery cause. Surprisingly, several components had a lead time of 10 days1! Theoretically these components should not cause any problems! After an interview with one of the Expeditors, it became clear that the lead times in the system were incorrect in some cases. But these are the numbers which the MRP system uses to calculate the order dates! Besides this it was mentioned that the 10 days lead time is no problem if the supplier gets a forecast from Power-Packer, but in the SV&E market the forecast is quite unreliable and in some cases not available at all!
This is just one simple example which shows that the parameters in the ERP system are not correct and could cause On Time Delivery problems. Besides this, there seems to be no procedure to improve and maintain the system parameters. Both the SOP employees and the Expeditors observe these problems, but no one has the responsibility or time to update these incorrect parameters.
3.1.3
Desired situation
In the desired situation each customer is supplied within 5 weeks after the order has been placed, with a target customer service level of 95 percent. In practice this means that 95% of the customer orders must be produced and ready for shipment before the due date. In this situation the inventory settings in Oracle are correct and there are processes and procedures available to maintain these correct settings. Besides this, the communication and conformity between departments should be improved using a Sales Inventory and Operations Planning method. If this can be accomplished, all needed parts are available at the right place, in the right amount and at the right time to start the production on time.
3.1.4
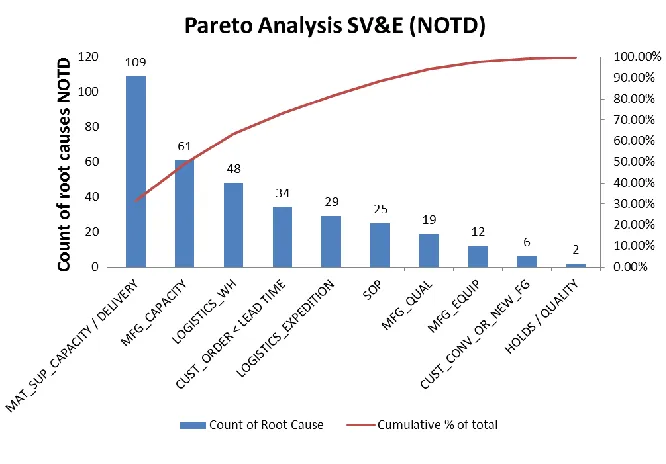
On Time Delivery Analysis
In order to get a clear view about the major causes of the OTD problems within the SV&E market, we conducted a Pareto analysis. This analysis identifies the most frequent causes of the “Not On Time Delivery”. The Pareto analysis is based on the OTD data collected by the SOP department in the period July 2014 up to and including May 2015, intercompany transactions were left out.As can be seen in figure 3-2, MAT_SUP_CAPACITY / DELIVERY can be regarded as the major cause of the OTD problems. In 31.5% of the NOTD cases, there is a problem with the on time delivery of materials needed during
1 [image:31.612.243.576.447.679.2]
18 |
P a g e
Row Labels
Count of Root Cause
Cum. % of Total MAT_SUP_CAPACITY
/ DELIVERY 109
DPE7-111301 5 4.59% DCF2-104831 4 8.26% DHP2-109309 4 11.93% DPE6031-02-80/1 4 15.60% DCM2-104830 3 18.35% DCD2-108875 3 21.10% DAC5-103763 3 23.85% DCD1714-76-96/1 3 26.61% DHP2-106947 3 29.36% DCD1715-76-95/1 2 31.19% DCD1618-76-99 2 33.03% DHP2-109306 2 34.86% DHP2-111633 2 36.70% DPE7-107925 2 38.53% DAI8-108618 2 40.37% 560-104 2 42.20% DPE2-111638 2 44.04% DVM5-100294 2 45.87% DCD5-109467 2 47.71% DPE7-111300 2 49.54% DHP2-113507 1 50.46%
production at Power-Packer. This is equal to 109 MAT_SUP_CAPACITY / DELIVERY issues out of a total of 345 OTD problems in all categories. In the interview with an employee of the SOP department it was mentioned that in this category no distinction is made between a supplier who delivered the materials too late and Power-Packer ordering the materials within the supplier lead time. For example, the customer orders products from Packer with a lead time of 5 weeks, if the supplier lead time of the raw materials exceeds this 5 weeks Power-Packer should have ordered the materials earlier. This immediately underpins and substantiates the problem issued in the introduction of this thesis: If a supplier lead time exceeds the customer lead time and there is no proper stock quantity available, this will immediately result in a Not On Time Delivery (not taking any possible emergency shipments into account).
The second cause, MFG_CAPACITY, is related to the capacity constraint of people and equipment. But as was mentioned in paragraph 1.5, the capacity constraint will be left out of scope. The third cause, LOGISTICS_WH, corresponds to problems in the warehouse of Power-Packer Oldenzaal, for example, Finished Goods arriving in the warehouse must have a status update to FG (Finished Good) in the ERP system before they can be released to the customer. Activities corresponding to the warehouse will also be left out of scope.
As the focus of this thesis will be on the first category, this category will be elaborated in more detail in the following sub paragraph.
MAT_SUP_CAPACITY / DELIVERY by Customer
The Pareto Analysis indicated that on time delivery of materials from suppliers is the major cause for the poor OTD performance towards the customers of Power-Packer. Going one step further in the analysis means the identification of the customers and products which are involved. Each product again consists of multiple components, and one or more of these components causes the delayed production start. An analysis of the products within the MAT_SUP_CAPACITY / DELIVERY category resulted in 75 different products which caused an On Time Delivery problem in the period July 2014 up to and including May 2015. The frequency in which these products caused an OTD problem is partly summarized in figure 3-3 (see Appendix C for the complete overview of the 75 products). The major problem is not caused by the product itself but by one or more of the components within these products, these were not available at the start of the production. Unfortunately, the data about which components caused the delay is incomplete. Therefore the Bill Of Material (BOM) of each of the 75 products will be analyzed in the next sections to identify the current high risk components.
19 |
P a g e
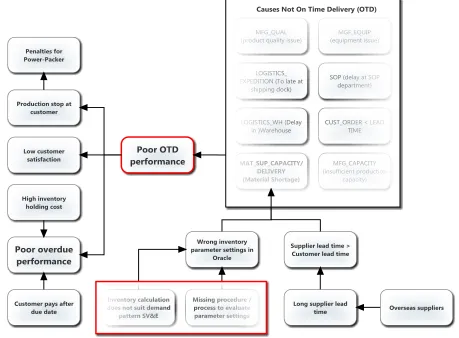
3.2 Problem diagram
To get a clear inside in the problems and causes of the low OTD performance, we performed an analysis of the most frequent root causes in section 3.1.4. This resulted in the material supply as major cause of the OTD problems. The underlying analysis of the problem diagram (see figure 3-4) can be found in section 3.1.4. By identifying the most frequent cause of the OTD problem, it was possible to narrow the scope of this thesis. The focus of this thesis is on the underlying problems of the material supply indicated in the red rectangle, see figure 3-4.