To What Extent do Predictive, Descriptive and
Prescriptive Supply Chain Analytics Affect
Organizational Performance?
Dennis Oliver Huisman
University of Twente P.O. Box 217, 7500AE EnschedeThe Netherlands
ABSTRACT
Computational tools for performing businesses have only recently become a major commercial concern. Rising amounts of data throughout industries have led to the emergence of Big Data. Not only have data variety and size increased significantly as of late but also their timeliness, and most importantly, the reaction timeliness executives can have upon this information. These phenomena lead supply chain managers to be increasingly reliant on these data to gain insight into expenditures, identify trends in costs and performance, and support process control, inventory monitoring, product optimization, and process improvement efforts. Currently, literature discusses early state-of-the-art Supply Chain Analytics that gives room for a broader overview and research. This paper attempts to address this gap by investigating the effects of supply chain analytical tools on business performance whilst also studying the perceived improvement associated to adopting these technologies by supply chain managers. This study is performed by means of a literary review in conjunction with a survey distributed to supply chain and purchasing managers throughout the retail sector in The Netherlands. Despite broad distribution, the survey did not obtain sufficient response to draw significant conclusions with respect to the hypotheses presented in this study. This paper concludes, based on literature, that Descriptive, Predictive and Prescriptive analytics all have positive influence on business performance and is unable to draw empirical conclusions as to the effects these tools have on the retail sector in The Netherlands and how their adoption is perceived by the relevant managers.
Supervisors:
Prof. Dr. Jos van Hillegersberg
Dr. Fons Wijnhoven
Drs. Corrie Huijs
Keywords
Permission to make digital or hard copies of all or part of this work for personal or classroom use is granted without fee provided that copies are not made or distributed for profit or commercial advantage and that copies bear this notice and the full citation on the first page. To copy otherwise, or republish, to post on servers or to redistribute to lists, requires prior specific permission and/or a fee.
5th IBA Bachelor Thesis Conference, July 2nd, 2015, Enschede, The Netherlands.
1.
INTRODUCTION
Although it has been many years since the initial conceptualization of business intelligence, business computing and their implications on business performance (Luhn, 1958), computational tools for performing businesses have only recently become a major commercial concern (McBride, 2013). Rising amounts of data throughout industries (Robak, Franczyk, & Robak, 2013) have led to the emergence of Big Data, defined as an immeasurable size of data whose scale is too varied and growth is extremely quick such that conventional information technologies cannot deal with the data efficiently (Olhorst, 2012). This can be illustrated by noting that in the year 2000, 800,000 petabytes of data were stored in the world (IBM, 2013) and this number is expected to reach 35 zettabytes by 2020 (Wong, 2012; Yiu, 2012). This data is comprised of a diverse range of data types such as texts, weblogs, GPS locations, sensor information, graphs, videos, audio and more online data (Forsyth, 2012).
Not only have data variety and size increased significantly as of late but also their timeliness, and most importantly, the reaction timeliness executives can have upon this information (Sahay & Ranjan, 2008). These phenomena lead supply chain managers to be increasingly reliant on these data to gain insight into expenditures, identify trends in costs and performance, and support process control, inventory monitoring, product optimization, and process improvement efforts (Hazen, Boone, Ezell, & Jones-Farmer, 2014). Analytic tools have allowed companies like Procter & Gamble to reduce deadhead movement (i.e., when trucks travel empty) in transportation occurring in its near supply chain (i.e., inbound, outbound, raw materials, and finished product) by 15% and therefore also reducing costs (McDonald, 2011). Similarly, Tesco, a major retail firm in the United Kingdom, has reported to have experienced considerable savings throughout time (Clark, 2013). The use of dynamic data in combination with analytical tools have sparked the interest of industries with perishable capacities such as airlines, transportation and hospitality which must engage their changing demand by adapting pricing, otherwise known as revenue management or dynamic pricing (Souza, 2014). Moreover, these tools have also aided manufacturers to overcome the challenges if improving productivity in industries that are already efficient (Manyika, 2011).
The rapid surge in amounts of data together with a need for fact-based decision-making and new technology advancement open possibilities for analytics throughout business (SAS, 2015). The use of in-memory analytics and their advancement have further fueled growth for the use of analytics and thus SCA throughout business with examples of processing times that used to last over 20 hours to be achieved in 20 seconds by in-memory applications (Hahn & Packowski, 2015; SAS, 2015). The use of aforementioned applications has lead to improvement in performance throughout the business setting, one example of this can be seen in corporate marketing lift campaigns of which one has obtained an increase of 50% in maerketing lift (SAS, 2015). Retail analytics papers have also noted examples of reduced inventory size as a result of analytics including the Brooks Brothers example where the company was able to reduce inventory by 27% and reduce the average weeks of supply in hand by seven (SAS, 2015).
Further examples include Staples’ 137% response rate and Macy’s $500,000 cost-savings in labor costs (SAS, 2015).The use of metrics and insight generation via analytics (revealing, for example, that low-volume customer purchasing in retail has been growing in popularity) enable companies such as aforementioned Brooks Brothers to achieve unrealised objectives (SAS, 2015).
Cabela’s uses analytics to for marketing campaigns, despite these not being associated to supply chain operations, Cabela’s could realize a 60% response rate increase through the use of analytics for targeted marketing activities (SAS, 2015).
A median five-year return on investment (ROI) of 112 percent was reported for companies implementing Business Intelligence (BI) tools to their operations with a mean payback of 1.6 years on average costs of (USD) $4.5 million (Eastwood, Vesset, & Morris, 2005). From the participating companies in this research, 54 percent had an ROI of 101 percent or higher. This was mostly attributed to ‘business process enhancement’ where BI was applied to distinct areas for example logistics, call centres, fraud detection and marketing campaign management (Eastwood, Vesset, & Morris, 2005). Similar past studies have also investigated the business value of BI through Supply Chain Analytics (SCA) (Kumar & Deshmukh, 2005). Not only are data analytical tools important for supply chain improvement but also the quality of the data itself, it has been estimated that poor data quality can lead to revenue costs as high as 8% to 12% for a typical organization and may generate up to 40% to 60% of a service organization’s expenses (Redman, 1998).
Further studies, investigating the impact of Business Analytics in a supply chain on the improvement of supply chain performance, report the degree of influence of the different areas of the SCOR (Supply Chain Operations Reference) framework on supply chain performance. Namely, Plan Analytics (19.43%), Source Analytics (16.73%), Make Analytics (28.14%) and Delivery Analytics (8.84%) constitute a large degree of the influencing analytical factors on supply chain performance (Trkman, McCormak, Oliveira, & Ladeira, 2010). Similarly, another study has shown that the ROI of predictive mining applications is close to being five times greater than that of non-predictive applications using standard query, analysis and reporting tools (Eckerson, 2006). Use of Markov logic models in crop rotations cycles have led to a 60% increase in performance in comparison to remote sensing methods (Osman, Inglada, & Dejoux, 2015).
A similar study later revealed different degrees of impact varying throughout different maturity levels (on basis of the Supply Chain Management Maturity Model--SCPM3 classification) with this being lower for lowest maturity levels and highest for higher maturity levels (Trkman, Ladeira, Oliveira, & McCormak, 2012). SCPM3 provides classification levels and respective characterization of supply chain management processes. SCPM3 breaks down a phenomenon’s evolution into five distinct stages being Foundation (at level 1), Structure (at level 2), Vision (at level 3), Integration (at level 4) and Dynamics (at level 5) (M. P. V. Oliveira, 2008). Despite the varying levels of influence, the aforementioned study does not neglect analytics of being a viable investment for firms seeking to optimise supply chain processes. It is also known that companies with relatively more advanced SCA reduce their costs faster and achieve higher profit margins than their peers (Hoole, 2005). Not only are analytics important for improving processes within organisations but they have also been of use for fraud detection and thus sparked demand for their use for this purpose additional to that of improving operational performance (Kraus & Valverde, 2014).
performance, provide possibilities for research investigating the overarching principles that arise from the application of such tools in different sectors in retail. Currently, literature discusses early state-of-the-art Supply Chain Analytics that gives room for a broader overview and future research. Hence, it is the objective of this paper to investigate the effects of such tools on business profit structure and perceived change, which under the context if this paper are defined under operational performance. This issue is to be investigated in this paper by means of a literature review gathered through Scopus1 and an industry survey directed to supply chain managers making use of analytical tools.
2.
LITERATURE
2.1
Supply Chain Analytics
Sahay and Ranjan (2008) define SCA as a concept that promises, ‘to extract and generate meaningful information for decision makers in the enterprise from the enormous amounts of data generated and captured by supply chains’. Sahay and Ranjan (2008) further go into explaining that data across the supply chain is crunched, analyzed and generated for decision makers to decide on configuring supply chain functions. SCA is further defined as providing a singular view across the supply chain and including prepackaged Key Performance Indicator (KPI) analytics whilst helping organizations on the primary drivers behind supply chain process planning, procurement, manufacturing, logistics and returns (Sahay & Ranjan, 2008). SCA is also defined as being synonymous to Business Analytics (BA) and defining them as referring to the use of data and quantitative tools and techniques to improve operational performance indicated by metrics (such as order fulfilment and flexibility) (Chae, Olson, & Sheu, 2013; Handfield, 2006; Davis-Sramek, Germain, & Iyer, 2010; Davenport & O'dwyer, 2011; O'dwyer & Renner, 2011).
BA has also been defined as an application of various advanced analytic techniques to data to answer questions or solve problems related to Supply Chain Management (Trkman, McCormak, Oliveira, & Ladeira, 2010). Additionally, BA has also been defined as a group of approaches, organizational procedures and tools used in combination with one another to gain information, analyze it, and predict outcomes of problem solutions in any of SCOR’s four areas (Bose, 2009). Another definition for BA describes it as entailing concepts that describe the analysis of business data for decision-making purposes (Hahn & Packowski, 2015).
From literature, and for the purposes of this paper, SCA entails gaining information, analyzing and predicting or displaying this information within supply chains for decision-makers to improve operational and strategic performance indicated by metrics. In order to determine in detail the effects of SCA on organizational operational performance, further detail must be added to this concept of SCA. For these purposes, this paper shall build on the same conceptualization used by Hahn and Packowski (2015) who use a conceptual deductive approach built on two recent publications that discussed the fundamentals of BA (Holsapple, Lee-Post, & Pakath, 2014; Mortenson, Doherty, & Robinson, 2014).
Three analytics orientation taxonomies are described that differentiate them with respect to the analytics task, result, or benefit (Holsapple, Lee-Post, & Pakath, 2014). The task-oriented analytics taxonomy shall be adopted in this paper to structure the measurable dimensions of this paper since it serves the purposes of this paper best by providing a functional-oriented approach
1 For reference, the reader is requested to visit
www.scopus.com
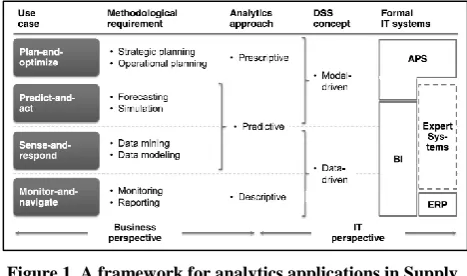
[image:4.595.309.543.149.287.2]that can be easily observed and applied in a practical setting. Three distinct analytics approaches are distinguished by the task-oriented taxonomy, these are: Descriptive, Predictive and Prescriptive analytics (Holsapple, Lee-Post, & Pakath, 2014; Evans, 2012). Figures 1 and 2 below from literature help further illustrate the distinction between these taxonomies which are to be explained in further detail hereafter in this paper.
[image:4.595.309.545.301.380.2]Figure 1. A framework for analytics applications in Supply Chain Management (Hahn & Packowski, 2015).
Figure 2. Analytic techniques used in Supply Chain Management (Souza, 2014).
2.2
Descriptive Analytics
One definition given to descriptive analytics is that it summarizes and converts data into meaningful information for reporting and monitoring but also allows for detailed investigation to answer questions such as “what has happened?” and “what is currently happening?” (Mortenson, Doherty, & Robinson, 2014). Descriptive analytics can be seen in dashboard applications that support process execution in sales and operations management, allowing for real-time tracking and KPI investigation (SAP, 2014). This mostly covers periodic reporting and/or continuous monitoring of performance metrics as well as data drill-down to navigate root causes on a granular level (Chen, Chiang, & Storey, 2012; Sahay & Ranjan, 2008). RFID tags and GPS data can be used to increase visibility into supply chain assets and material flows (Tan, Zhan, Ji, Ye, & Chang, 2015; Souza, 2014). Previously mentioned Procter & Gamble’s cost reductions were attributed to Descriptive analytics, also known as “Control Tower” (McDonald, 2011).
2.3
Predictive Analytics
supply chain design and competitiveness” (Waller & Fawcett, 2013). Waller and Fawcett further build on this definition by explaining that this type of analytics involves “the application of quantitative and qualitative methods from a variety of disciplines in combination with SCM theory to solve relevant SCM problems and predict outcomes, taking into account data quality and availability issues.” A different study, investigating a domain-specific framework for Predictive analytics in manufacturing, defines Predictive analytics as a tool that “uses statistical techniques, machine learning2, and data mining to discover facts in order to make predictions about unknown future events.” (Lechevalier, Narayanan, & Rachuri, 2014).
Predictive analytics includes making use of simulations and mathematical modelling such as Monte Carlo simulations used in Cundus Bandbreitenplanung (Range Planning) to quantify the risk impact of given parameters and discrete-event simulations (Anderson, Sweeney, Williams, Camm, & Kipp, 2012; Cundus Bandbreitenplanung, 2014). This is closely tied to the intended functionality of providing proactive and applying business forecasting as well as simulation methods to support business decisions (O'dwyer & Renner, 2011; Waller & Fawcett, 2013). Other applications such as providing insight into changes of purchase volumes and pricing discounts on demand (SAP, 2014). Additionally, tools that investigate the trade-off between distribution and price efficacy using predictive analytics to connect these to performance metrics are also further applications for these tools (Makad, 2014).
Data Mining3 and Modelling4 have also been noted to be key components in Predictive analytics (Hahn & Packowski, 2015). Data mining methods such as cluster analysis (k-means, self-organizing maps, etc.), market basket analysis, association rule learning (link analysis, sequence mining, etc.), neural networks, discriminant analysis, support vector machines and genetic algorithms are used throughout the SCOR framework in organisations to enhance Supply Chain Management performance (Holimchayachotikul, Derrouiche, Damand, & Leksakul, 2014; Souza, 2014; Turban, Sharda, Delen, & King, 2011). Other methods such as utilizing Benford’s Law to detect fraud in Data Warehouses have also been studied in which the methods are described as being both Descriptive and Predictive (Kraus & Valverde, 2014). Further applications include failure prediction, applications of Markov logic models for predictive crop rotations, forecasting and product demand, cost modeling for product pricing, analytics for predicting warranty and product maintenance (Lechevalier, Narayanan, & Rachuri, 2014; Osman, Inglada, & Dejoux, 2015).
2.4
Prescriptive Analytics
Prescriptive analytics is defined as involving deriving optimal planning decisions given the predicted future and addressing questions such as “what shall we do?” and “why shall we do it?” (Evans, 2012).
Interactive logistic network analysis and scenario simulation are examples of the practical uses of Prescriptive analytics in business (CAMELOT Management Consultants, 2014; Oracle, 2014). These include what-if analyses in respect to operational
2 Machine learning has been defined as “a branch of
artificial intelligence […] involves building systems that can learn from data to make inferences and predictions about the future” (Lechevalier, Narayanan, & Rachuri, 2014).
3 Data mining has been defined as ‘the process through
which previously unknown patterns in data are discovered’ (Turban, Sharda, Delen, & King, 2011).
performance metrics such as delivery service levels and impact analyses of external factors such as exchange rates, fuel prices, and carrier rates (Hahn & Packowski, 2015). Moreover, further applications include evaluating strategic network configurations with respect to location, route or product-market selections (Hahn & Packowski, 2015). Other applications include collaborative Sales and Operations Planning (S&OP) by connecting statistical forecasting methods for demand planning with rough-cut multi-level supply planning that uses heuristic and optimization-based apporaches (Gunasekaran & Ngai, 2004). Scenario simulation in which metric variation can be used to create scenarios for basis of comparison to baseline scenarios also falls under Prescriptive analytics (SAP, 2014). Techniques such as analytic hierarchy process and game theory (e.g., auction design and contract design) have been described to lie within the ‘Source’ classification of the SCOR framework (Souza, 2014). Non-linear programming has been defined as belonging to the ‘Make’ aspect of the SCOR framework, while network flow algorithms and stochastic dynamic programming have been defined as belonging under ‘Deliver’ and ‘Return’ (Souza, 2014).
3.
METHOD
3.1
Variable Conceptualization and
Clarification on Causal Relationships
The effects of the three aforementioned taxonomies will be investigated on terms of firm profit structure and perceived change in an organization. This paper has previously defined profit structure to be interchangeably used with operational performance along with perceived change.
However, in order to provide detail on operational performance as defined in this paper, the difference between profit structure change and perceived performance change must be established. Profit structure change refers to the direct5 change that can be seen on cost reduction and efficiency increase within the firm. In this case, this does not account for the time-lapse it might take for the first noticeable financial improvements to be noticed.
Perceived performance change refers to the changes that are felt by individuals directly involved with the analytic technologies that are not necessarily related to financial or procedural improvements. This study also intends to investigate on the difference between the tangible changes in an organization’s adoption of SCA and the intangible, perceived, changes that are felt by its members.
3.1.1
Descriptive analytics on profit structure
This is the effect that Descriptive analytics, as previously mentioned, has on profit structure. As also already seen, P&G could generate cost savings by visualizing transport use and carry-levels for their transport units (McDonald, 2011). Therefore, it is expected for these analytical methods to have a positive relationship with profit margin augmentation.
H1: Descriptive analytics has a positive effect on profit margins.
4 Data modelling is defined as involving a ‘broad set of
multivariate statistical methods’ (Chen, Chiang, & Storey, 2012).
5 To the extent that are seen after the technology was
3.1.2
Descriptive analytics on perceived change
Since the investment to adopt a new technology like Descriptive analytics has been made within an organization, it could be expected that the individuals involved with utilizing this technology as well as decision-makers would perceive the change as being positive independent of results on firm financial performance (Hsu, 2014).H2: Descriptive analytics has a positive effect on perceived change independent of change in procedural or financial performance.
3.1.3
Predictive analytics on profit structure
Previously mentioned studies elaborated on the effects of Predictive analytics on both financial as procedural operations within businesses (Eastwood, Vesset, & Morris, 2005; Eckerson, 2006; Osman, Inglada, & Dejoux, 2015; Trkman, Ladeira, Oliveira, & McCormak, 2012). Therefore, it is also expected for Predictive analytics to have a positive effect on business profit margins.
H3: Predictive analytics has a positive effect on profit margins.
3.1.4
Predictive analytics on perceived change
Under the same reasoning that investing in a new technology and adopting it can lead to expectations of it improving processes and thus creating a self-fulfilling prophecy for stakeholders, it is expected that Predictive analytics will have a positive effect on the perceived change independent of procedural or financial performance changes.
H4: Predictive analytics has a positive effect on perceived change independent of change in procedural or financial performance.
3.1.5
Prescriptive analytics on profit structure
Through the use of Prescriptive methods that diagnose situations derived from SCA tools, it would seem reasonable to expect that Prescriptive analytical methods would lead to an improvement in organizational profit margins. It is therefore hypothesized that Predictive analytics have a positive effect on organizational profit margins.
H5: Predictive analytics has a positive effect on profit margins.
3.1.6
Prescriptive analytics on perceived change
As with the previously mentioned tools, investment in these tools can also lead to belief of improvement that is not necessarily reflected on other organizational metrics. Therefore it is also hypothesized that Prescriptive analytics has a positive effect on perceived change independent of external metrics.
H4: Prescriptive analytics has a positive effect on perceived change independent of change in procedural or financial performance.
3.2
Measurement and Validation
This paper makes use of knowledge gathered from academic literature found through Scopus. Additional to that, a survey was created through Qualtrics6 of which participants could provide information as to the effects of the different SCA tool taxonomies on operational performance.
The purpose was to create a survey that could be completed in roughly five minutes by purchasing managers throughout the corporate setting in The Netherlands. This timeframe would have ensured answers to be provided with sufficient depth for
6 For reference, the reader is requested to visit
www.qualtrics.com
discussion whilst also minimizing the time spent on filling answers to minimize the degree to which managerial agendas were to be disturbed.
3.2.1
Survey structure and contents
The survey was intended to provide information on the age of the technology within a firm, the industry within the company is operating and details on the improvements obtained by utilizing SCA divided into the three aforementioned taxonomies.
Under these notions, the survey was structured into five main blocks explained below.
3.2.1.1
Introductory statement
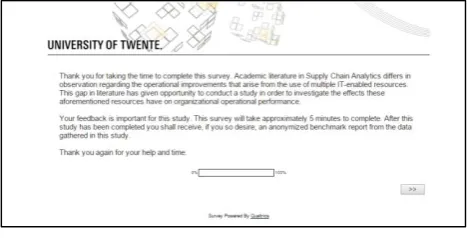
[image:6.595.310.545.259.378.2]Initially, a welcome message is displayed to all participants highlighting the objectives of the study, the time it will take to complete the survey (approximately), and the possibility or receiving an anonymized benchmark report upon completion of the entire study.
Figure 3. Survey welcome message
3.2.1.2
Preliminary questions
In this section, the respondent answers questions concerning his/her company, preference towards receiving an anonymized benchmark report, whether their company makes use of SCA, how many years have passed since the implementation of SCA tools in the firm, and what SCA tools are currently used by the company.
In case the respondent answered that they do not make use of SCA, the survey is halted and the respondent is brought to an ending thank you message.
3.2.1.3
Predictive, Prescriptive and Descriptive
analytics sections
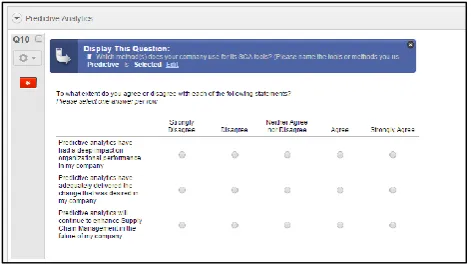
In case the respondent had previously indicated that he/she made use of Predictive, Prescriptive and/or Descriptive analytics for his/her SCA tools, the corresponding analytics question sections are made available for response. Each section addresses one classification of SCA. Every section is composed of five questions of which the first is a 5-point Likert scale assessing perceived impact, level of satisfaction and belief in the future use of the tool. These assessments were evaluated by means of the following statement responses:
1) “[X classification of SCA] analytics have had a deep impact on organizational performance in my company”
Figure 4. Likert scale section for Predictive analytics
Thereafter, the respondent is presented with four open-ended questions to be answered in a text-box. The intention behind creating open-ended questions was to allow the most information to be obtained possible regardless of company setting and operational procedures. In effect, open-ended questions were introduced to create a degree flexibility within the report. The open-ended questions were then:
1) What differences have been realized ever since the implementation of [X classification of SCA] analytics methods within your company’s SCA? (e.g., are processes performed faster? By how much? Please provide as much detail as possible)
2) To what extent are these reflected upon the company’s operational performance? (Has there been a decrease in costs? If so, what is the percentage decrease? To what are these attributed? Please provide as much detail as possible)
3) To what extent are these changes reflected upon your company’s Key Performance Indicators (KPIs)? (If KPI goals have been set, have they all been met? If not, which have not? Please provide as much detail as possible)
4) Has the investment on the new [X classification of SCA] method tools reached break-even? If not, why not? (Please illustrate this as clearly as possible)
The questionnaire was constructed such that if the respondent had indicated that the respondent made use of all three taxonomies then he would receive the same block of questions for the three different types. Once the survey is complete, the respondent is redirected to a thank you message similar to that shown in Figure 4.
3.2.2
Survey distribution and information channels
The resulting questionnaire was then distributed via multiple channels making use of contact databases belonging to local groups and institutions including DINALOG (Dutch Institute for Advanced Logistics), FNLI (Federatie Nederlandse Levensmiddelen Industrie) and SAS in the Netherlands.
4.
RESULTS
4.1
Survey
Despite the survey’s broad distribution, six responses were recorded in total in a two-week time lapse. Two out of the six respondents made use of IT-enabled SCA; one had implemented the technology for two years to date and the other for four; one was not aware of the distinction between the three SCA taxonomies. One made use of all three taxonomies of SCA and the other did not use Descriptive analytical tools as part of its SCA methods.
Of the two respondents, both “Agreed” on all three statements presented for the Likert-scale section on Predictive and
Prescriptive analytics. The results were identical for the respondent that indicated to make use of Descriptive analytics.
Figure 5. Time lapse (in years) since first implementation of SCA (response summary)
5.
CONCLUSION
Despite the low amount of information obtained from the information gathering methods introduced in this paper, literature on the topic of analytics in business indicates a positive trend between its use and positive firm operational outcomes. Literature has shown some of the effects SCA had on firm performance. Within Descriptive analytics, P&G’s “Control Tower” was a visible example of the positive influence of these tools granting the company reduced deadhead movement of 15% thus leading to cost reduction and a more efficient logistic operation scheme (McDonald, 2011). Within Predictive analytics, Brooks Brothers’ 27% reduction in inventory, 50% marketing lift increase, $500,000 in labor cost-savings for Macy’s, 137% response rates for Staples and Cabela’s 60% response rate increase for marketing activities highlight the operational improvements realized by the use of SCA tools (SAS, 2015). Prescriptive analytics is shown to have improved crop rotation cycles by 60% with the use of Markov logic models (Osman, Inglada, & Dejoux, 2015).
Financially, literature has also indicated ROI for analytics applications to be 112% with a mean payback of 1.6 years on average costs of (USD) $4.5 million (Eastwood, Vesset, & Morris, 2005). Another study has shown that the ROI of predictive mining applications is close to being five times greater than that of non-predictive applications using standard query, analysis and reporting tools (Eckerson, 2006). Further studies also indicate a positive influence of these tools on financial returns (Kumar & Deshmukh, 2005).
This hints towards proof on SCA’s positive effect on firm performance. However, practical literature and other supplementary information in this paper does not provide direct evidence to fully prove or disprove the previously stated hypotheses. Moreover, Hsu’s work on perceived change could be expanded to hypothesize on the perception supply chain managers have on SCA however do not serve as representative evidence to verify these propositions. It was expected that perceived change would have been noticed when results would have indicated same levels of perceived improvements among industries as results for performance improvements varied among industries for respondents that have realized an investment in SCA (Hsu, 2014).
5.1
Limitations and Future Improvement
[image:7.595.310.544.98.202.2]encountered in the field. Considering the aforementioned, the questions presented by this study’s survey would have only been feasible for uncommonly mature and quantitatively managed companies.
Moreover, as previously mentioned, current literature discusses early state-of-the-art use of SCA, which leads to the possibility of creating such a study as the one conducted in this paper. The approach this paper adopts seeks to investigate the broader overview of the uses of SCA. However, as observed by the results of this study, it is currently perhaps too early, as advanced use of these tools is not well spread.
The SCA field is constantly evolving and reaching a contemporary, insightful conclusion is thus mutating as its uses change through time (McBride, 2013; Robak, Franczyk, & Robak, 2013). Further studies could consider making more extensive use of supply chain networks among industries to act as distribution channels for the gathering of information.
6.
ACKNOWLEDGMENTS
Special thanks to Murk Boerstra from FNLI, to Sophie Zijp and Ruby Limburg from DINALOG, Michael Otten from SAS Institute B.V. and Jos van Hillegersberg, supervising professor, for their support and collaboration in this study.
7.
REFERENCES
Anderson, D. R., Sweeney, D. J., Williams, T. A., Camm, J. D., & Kipp, M. (2012). An Introduction to Management Science: Quantitative Approaches to Decision Making . Mason: South-Western/Cengage.
Bose, R. (2009). Advanced analytics: opportunities and challenges. Industrial Management & Data Systems , 155-172.
CAMELOT Management Consultants. (2014, 05 31).
CAMELOT Logistic Transport Cost Analyzer.
Retrieved from CAMELOT Management Consultants: http://www.youtube.com/watch?v=XZ9PjKphsZ4201 3
Chae, B., Olson, D., & Sheu, C. (2013). The impact of supply chain analytics on operational performance: a resource-based view. International Journal of Production Research, 4695-4710.
Chen, H., Chiang, R. H., & Storey, V. C. (2012). Business intelligence and analytics: From big data to big impact.
MIS Quarterly , 1165-1188.
Clark, L. (2013, 05 19). Tesco uses supply chain analytics to save 100m a year . Retrieved from Computer Weekly: http://www.computerweekly.com/news/2240182951/ Tesco-uses-supply-chain-analytics-to-save-100 m-a-year
Cundus Bandbreitenplanung. (2014, 5 31). Verzahnung von Planung und Risikomanagement. Retrieved from
Cundus Bandbreitenplanung:
http://www.youtube.com/watch?v=ENNaAWZZONE 2013
Davenport, T., & O'dwyer, J. (2011). Tap into the Power of Analytics. Supply Chain Quarterly, 28-31.
Davis-Sramek, B., Germain, R., & Iyer, K. (2010). Supply Chain Technology: The Role of Environment in Predicting Performance . Journal of the Academy of Marketing Science, 42-55.
Delen, D., & Demirkan, H. (2013). Data, infomation and analytics as services. Decision Support Systems, 359-363.
Eastwood, M., Vesset, D., & Morris, D. H. (2005, March 13).
Delivering value in business intelligence . Retrieved from HP : http://research.ittoolbox.com/white-papers/lg.asp?grid=3374
Eckerson, W. W. (2006). Performance Dashboards Measuring, Monitoring, and Managing Your Business. New York: John Wiley & Sons .
Elbashir, M. Z., Collier, P. A., & Davern, M. J. (2008). Measuring the effects of business intelligence systems: the relationship between business process and organizational performance. International Journal of Accounting Information Systems, 135-153.
Evans, J. R. (2012). Business analytics: the next frontier for decision sciences . Decision Line , 4-6.
Forsyth, C. (2012, 06 03). For Big Data Analytics There is No Such Thing as Too Big. Retrieved from 4sythcomm: 4sythcomm.com
Gunasekaran, A., & Ngai, E. (2004). Information systems in supply chain integration and management . European Journal of Operational Research, 269-295.
Hahn, G. J., & Packowski, J. (2015). A perspective on applications of in-memory analytics in supply chain management . Decision Support Systems.
Handfield, R. (2006). Supply Market Intelligence: A Managerial Handbook for Building Sourcing Strategies. New York: Taylor & Francis.
Hazen, B. T., Boone, C. A., Ezell, J. D., & Jones-Farmer, L. A. (2014). Data quality for data science, predictive analytics, and big data in supply chain management: An introduction to the problem and suggestions for research and applications. International Journal of Production Economics , 72-80.
Holimchayachotikul, P., Derrouiche, R., Damand, D., & Leksakul, K. (2014). Value creation through collaborative supply chain: holistic performance enhancement road map. Production Planning & Control: The Management of Operations, 912-922.
Holsapple, C., Lee-Post, A., & Pakath, R. (2014). A unified foundation for business analytics. Decision Support Systems , 131-141.
Hoole, R. (2005). Five ways to simplify your supply chain.
Supply Chain Management: An International Journal, 3-6.
Hsu, J. (2014). Understanding the role of satisfaction in the formation of perceived switching value. Decision Support Systems, 152-162.
IBM. (2013, 08 10). What is Big Data? - Bringing Big Data to The Enterprise. Retrieved from IBM: www.IBM.com
Kraus, C., & Valverde, R. (2014). A data warehouse design for the detection of fraud in the supply chain by using the benford's law. American Journal of Applied Sciences, 1507-1518.
Lechevalier, D., Narayanan, A., & Rachuri, S. (2014). Towards a Domain-Specific Framework for Predictive Analytics in Manufacturing. 2014 IEEE International Conference on Big Data (pp. 987-995). Gaithersburg: National Institute of Standards and Technology.
Luhn, H. P. (1958). A business intelligence system . IBM Journal of Research and Development , 14-31.
M. P. V. Oliveira, M. B. (2008). Managing the five tensions of IT-enabled decision support in turbulent and high-velocity environments. Information Systems and E-Business Management , 225-237.
Makad, R. (2014, 05 31). In-memory purchasing: a case study.
Retrieved from MIT TechTV:
http://techtv.mit.edu/genres/20- entrepreneurship/videos/21692-supply-chain- innovation-conference-in-memory-processing-a-case-study
Manyika, J. (2011). Big data: the next frontier for innovation, competition and productivity. New York: McKinsey Global Institute.
McBride, N. (2013). Business Intelligence in Magazine Distribution . International Journal of Information Management , 58-62.
McDonald, R. (2011, November 7). Inside P&G's digital revolution. Retrieved from McKinsey Quarterly: http://www.mckinsey.com/insights/consumer_and_ret ail/inside_p_and_ampgs_digital_revolution
Mortenson, M. J., Doherty, N. F., & Robinson, S. (2014). Operational research from taylorism to terabytes: a research agenda for the analytics age. European Journal of Operational Research, 583-595.
O'dwyer, J., & Renner, R. (2011). The Promise of Advanced Supply Chain Analytics. Supply Chain Management Review, 32-37.
Olhorst, F. J. (2012). Big Data Analytics: Turning Big Data Into Big Money . John Wiley & Sons .
Oracle. (2014, 05 31). Collaborative resource library. Retrieved
from Oracle:
http://www.oracle.com/us/products/applications/
Osman, J., Inglada, J., & Dejoux, J. (2015). Assessment of a Markov logic model of crop rotations for early crop mapping. Computers and Electronics in Agriculture, 234-243.
Redman, T. C. (1998). The impact of poor data quality on the typical enterprise . Commun. ACM, 79-82.
Robak, S., Franczyk, B., & Robak, M. (2013). Applying Big Data and Linked Data Concepts in Supply Chain Management . Federated Conference on Computer Science and Information Systems , 1203-1209.
Sahay, B. S., & Ranjan, J. (2008). Real time business intelligence in supply chain analytics. Information Management & Computer Security, 28-48.
SAP. (2014, 05 31). SAP HANA certified partners. Retrieved
from SAP:
http://www.saphana.com/community/learn/partners/c ertified-partners2014
SAP. (2014, 05 31). SAP HANA Marketplace. Retrieved from SAP: http://marketplace.saphana.com
SAP. (2014, 05 31). SAP HANA partner race`. Retrieved from SAP:
http://global.sap.com/germany/campaigns/2012_in-memory/partner-race/race.epx
SAP. (2014, 05 31). SAP help portal: SAP HANA innovations for SAP business suite. Retrieved from SAP: http://help.sap.com/in_memory2014
SAS. (2015, 06 20). Analytics on a Grand Scale. Retrieved from SAS: sas.com/reg/web/corp/1826285
SAS. (2015, 06 21). Banking on Analytics: How High-Performance Analytics Tackle Big Data Challenges in Banking. Retrieved from SAS: www.sas.com
SAS. (2015, 06 21). The Art of Knowing the Customer . Retrieved from SAS: www.sas.com/retail
Souza, G. C. (2014). 2014. Business Horizons, 595-605.
Tan, K. H., Zhan, Y., Ji, G., Ye, F., & Chang, C. (2015). Harvesting big data to enhance supply chain innovation capabilities: An analytic infrastructure based on deduction graph. International Journal of Production Economics.
Trkman, P., Ladeira, M. B., Oliveira, M. P., & McCormak, K. (2012). Business Analytics, Process Maturity and Supply Chain Performance . Business Process Management Workshops , 111-122.
Trkman, P., McCormak, K., Oliveira, M. P., & Ladeira, M. B. (2010). The impact of business analytics on supply chain performance . Decision Support Systems , 318-327.
Turban, E., Sharda, R., Delen, D., & King, D. (2011). Business Intelligence: A Managerial Approach. Upper Saddle River: Prentice Hall.
Waller, M. A., & Fawcett, S. E. (2013). Data science, predictive analytics, and big data: a revolution that will transform supply chain design and management . Journal of Business Logistics, 77-84.
Wong, D. (2012). Data is The Next Frontier, Analytics the New Tool: Five Trends in Big Data and Analytics, and Their Implications for Innovation and Organisations.
London: Big Innovation Centre.