Assessing the effectiveness of hands-on lessons, online lessons or combinations
of both for tackling students’ misconceptions about Newton’s first law
Maaike Otten
University of Twente
Supervised by:
S.A.N. van Riesen, Msc.
Dr. A.H. Gijlers
2
Acknowledgment
I would like to thank a lot of people who have supported and helped me throughout my final project for the master Psychology, Learning sciences. Firstly, I would like to give thanks to my supervisors Siswa van Riesen and Hannie Gijlers. I am glad that I met Siswa van Riesen and visit her to talk about opportunities for research projects at the IST department. I liked the open attitude and thinking along about possible topics for the research projects, which also characterised the support during the project by offering freedom and also pointing attention to possible areas for improvement. I am glad that she introduced me to Hannie Gijlers, who could quickly answer my questions and
provided valuable feedback to bring my thesis to the next level.
Secondly, I am grateful that I was given the opportunity to be part of the project Miss to Hit. I liked that I could contribute to the project and enjoyed the first project meetings. The project Miss to Hit also enabled me to pre-test the instruments and materials at NEMO Science Museum, which was a nice location for the pre-testing.
Thirdly, I would also like to thank Veluwscollege Mheenpark and Veluwscollege Walterbosch for conducting my research at their school and especially the teachers and students that participated in this research.
Moreover, I am grateful that I could use the inquiry spaces from Go-lab and the racing tracks for the lessons. Special thanks to the people of the Go-lab platform for answering questions and to
make it possible to integrate labs in the inquiry spaces.
Finally, the process of meeting one person who can help me to get in touch with someone else, seemed to portray my journey of the whole thesis. When I talked about my thesis to friends or fellow students, they could offer me great tips for my thesis and also suggestions for meeting other people who could help me. I am grateful for the advice of family, friends and fellow students but also for the feedback of the several kind strangers.
Thanks to all of you.
3 Abstract
Students hold on misconceptions about Newton’s first law which are tenacious and are often hard to change. Scientists are debating what the most effective method is to tackle those misconceptions. This research inquires what the most effective method is, comparing hands-on lessons, online lessons or combinations of both, to tackle students’ misconceptions about Newton’s first law. Secondary school students at the third grade level (N= 127) were assigned to four different conditions (1. hands-on lessons, 2. online lessons, 3. online lesson and then hands-on lesson, 4. hand-on lesson and then online lesson). Science curiosity scales and four-tier tests measuring (mis)conceptions and confidence were used as instruments. This study showed that no method or combination of methods was superior to another for student’s performances and confidence about Newton’s firs law and altering students’ science curiosity. The findings contribute to the scientific debate about which method is the most effective for acquiring conceptual change and stimulating science curiosity. The study offers educational practises and initiatives for promoting science curiosity insights if preferred instruction methods would exist. Furthermore, by implementing a four-tier test including open questions which gains insights in students’ confidence, it contributes as a methodological development of the four-tier diagnostic multiple choice test for research practices in the domain of misconceptions.
4
Introduction
Technologies are gaining an increasingly important role in modern society, which as a result demand more technical labour instead of unskilled workers (Wysocki, McDonald, Fanto & McEwen, 2013). In the growth of modern society, science, technology, engineering and mathematics (STEM) jobs are necessary for growth (Wysocki et al., 2013). Students’ viewpoints on science impact their future career choices (Jocz, Zhai & Tan, 2014; Morais, 2015). Besides that, Jocz et al. (2014) suggest that disinterest in science may impede students to become scientific literate citizens who can handle socioscientific issues. Unfortunately, children tend to show negative perceptions towards science (Morais, 2015), this is especially the case for girls (Heard, Divall, & Johnson, 2000; Smiley, 2011). Children’s opinions about science are rooted early in their education and are difficult to change later on (Kermani & Aldemir, 2015; Morais, 2015).
On a positive note, early multidisciplinary science instruction raises awareness and interests towards science and promotes their overall school performance even years later (Kermani & Aldemir, 2015). Besides that, young children are intrinsically interested in science because they are eager to learn about the world around them and the underlying causes, processes and mechanisms of phenomena (Zacharia, Loizou & Papaevripidou, 2012).
However, children’s interests or own investigations can cause problems for their conceptions about scientific phenomena. Children attempt to make sense of the world around them and set up their
5 Kozhevnikov, Gurlitt & Kozhevnikov, 2013; Mayer, 2008; Vosniadou, Ioannides, Dimitrakopoulou, Papademetriou, 2001). Teachers and textbooks also hold misconceptions, which in turn can even accumulate students’ misconceptions (Bursal, 2012; King, 2010; Bulunuz & Jarret, 2010; Garbett, 2003; Treagust & Duit, 2008). Being aware of misconceptions can contribute to the adaption of instructions to help students acquire scientific conceptions (Pine, Messer & St. John, 2001).
Additional, research shows that traditional methods, involving primarily lectures alone, are not able to tackle students’ misconceptions effectively but that hands-on lessons, in which would be experimented with physical material, are considered as more effective and enjoyable in order to clarify misconceptions (Marinopoulos & Stavridou, 2002; Hadzigeorgiou, 2001; Weaver, 1998).
Furthermore, hands-on lessons promote students’ interest in science (Klahr, Triona & Williams, 2007; Unal, 2008; Zardetto-Smith, Mu, Phelps, Houtz & Royeen, 2002). Though hands-on lessons also hold disadvantages such as students having problems to recognise underlying principles and phenomena (Lazonder & Ehrenhard, 2014; Smith & Puntambekar, 2010). Online lessons can provide solutions, such as showing phenomena that are not readily visible or manipulated (Klahr et al., 2007; De Jong, Linn & Zacharia, 2013; Wysocki et al., 2013). Nevertheless, online lessons also hold drawbacks such as missing the tactile cues that can be derived from physical experimentation (Klahr et al., 2007; Lazonder & Ehrenhard, 2014; Zacharia et al., 2012). Combinations of hands-on lessons and online lessons are proposed in order to use the best of both worlds (e.g. De Jong et al., 2013; Olympiou & Zacharia, 2011). The literature do not show consensus about what type of method (comparing hands-on lesshands-ons, hands-online lesshands-ons or combinatihands-ons of both) the most affordances has (Klahr et al., 2007; Lazonder & Ehrenhard, 2014; Zacharia, 2007). Whereas science education need to know when, what and how to teach, using hands-on and or online material in order to optimize students achievements, because there is a lack of a framework in science curricula about acquiring scientific conceptions using hands-on and online material (Zacharia et al., 2008; Zacharia et al., 2012).
6 effectiveness of hands-on lessons, online lessons and combinations of both (Klahr et al., 2007). This study also measures students’ long-term recall, confidence in their (mis)conception, and students’ interest in science. Misconceptions are very resistant to change thus it will be worthwhile to detect even small shifts in conceptual change. Confidence measures can help to determine shifts in
conceptual change in nature and strength (Gurel et al., 2015). Measuring students’ (mis)conceptions and confidence at different times would also enable to measure the degree of tenacity of the
(mis)conceptions. Taking into account affective factors, such as science curiosity and confidence, besides the performances measures when conducting research about conceptual change is
recommended by Duit and Treagust (2003). Furthermore, previous studies primarily measure conceptual understanding but do not pay attention to science curiosity (De Jong et al., 2013). Even though science curiosity is an interesting topic in the current society to examine because of the need for more STEM jobs and the influence of students’ interest on their future career choices (Jocz et al.,
2014; Morais, 2015; Wysocki et al., 2013).
Theoretical framework
Misconceptions
Levin and Druyan (1993, p.1572) describe misconceptions as “intuitive conceptions
incompatible with scientific knowledge and [...] particularly resistant to change through schooling and other daily experiences”. Schmidt, Spaaij and De Grave (1988) add to these characteristics of
misconceptions that those views emerge kind of spontaneously in an early stage of development through prior experiences. Synonyms that are often used for the term misconceptions are; naive views, alternative conceptions, children’s ideas, preconceptions or common sense conceptions (Clement, 1982; Garbett, 2003; Gurel et al., 2015; Unal, 2008).
Students hold misconceptions about a lot of topics in science. Mayer (2008) summarize that the known misconceptions are about gravity, acceleration, motion, density, living versus non-living, chemical equilibrium, energy, the sky and the earth as a cosmic body (Mayer, 2008). Other
7 and floating concepts and rules (Unal, 2008). Many researchers refer to misconceptions about motion as an example of possible misconceptions (e.g. Digisi & Yore 1992; Kozhevnikov et al., 2013; Vosniadou et al., 2001). Related to the misconceptions of motion are misconceptions about vision and light (Winer, Rader & Cottrell, 2003; Pompea et al, 2007). Specifically, misconceptions about motion for example include that static objects cannot exert forces, an unbalanced force is necessary to keep an object moving with constant velocity and that objects shoot through a curved tube will follow a circular path instead of going in a straight line (Clement, 1982; McCloskey, 1983; Muller, Bewes, Sharma & Reimann, 2008). Abstract concepts, such as forces, are considered as the hardest topics for students to understand (Bulunuz, Jarret & Bulunuz, 2009; Pine et al., 2001; Unal, 2008). This is especially the case for misconceptions about motion because students must discriminate between concrete, observable events and unobservable properties that cause them (Unal, 2008). These misconceptions about motion are tenacious (McCloskey, 1983; Mildenhall, & Williams, 2001;
Treagust & Duit, 2008). For example, Hynd and Alverman (1986), as cited in Digisi and Yore (1992), show that even when misconceptions are explicitly stated, students will remember the information but still have problems to apply the theory to new situations. The theory of impetus underlines the
misconceptions of motion (Mayer, 2008). This theory involves that a moving object acquires some force or impetus that keeps it moving until the impetus gradually will dissipate. Accordingly, students who believe the theory of impetus supports the idea that motion requires a force. Despite the fact that Newton’s first law is considered as the scientific conceptions about motion (Mayer, 2008). Newton’s
first law which encompasses that an object in motion will continue in his current state until some external force acts upon it. Besides that, an object in rest will also stay in rest until some external force acts upon it. Thus, objects do not require any force to continue moving at a constant speed but an external force is necessary to change the velocity and direction of a moving object (Mayer, 2008). The current study aims to tackle those misconceptions about motion which are underlined by a lack of knowledge of Newton’s first law because those misconceptions frequently occur and are tenacious.
Moreover, Newton’s scientific conceptions are the base of classical physics and usually are the groundwork of introductory physics curricula (Galili & Tseitlin, 2003).
8 2001; Pompea et al., 2007). In general, there is a consensus that misconceptions should be identified and student’s awareness should be raised for their own misconceptions (Mildenhall & Williams, 2001;
9 misconceptions, varying from textbooks, concept maps, field trips to computer simulations (Bulunuz & Jarret, 2010; Mildenhall & Williams, 2001).
Hands-on lessons
While considering the diversity of approaches and mediums, hands-on lessons is considered as one of the most popular and effective type of lessons to change misconceptions over the last decades (Bulunuz & Jarret, 2010; Bulunuz, Jarret & Bulunuz, 2009;Hadzigeorgiou, 2001; Wysocki et al, 2013; Weaver, 1998). Hands-on lessons are characterised as an instructional strategy that encourage students to be actively engaged in scientific processes by manipulating objects while using their senses (Inan & Inan, 2015;Klahr et al., 2007).
10 troubleshooting (De Jong et al., 2013; Smith & Puntambekar, 2010). Furthermore, hands-on lessons can stimulate interest in science (Klahr et al., 2007; Unal, 2008; Zardetto-Smith et al., 2002). Reasons why hands-on activities are motivating is because students can directly experience and acquire a sense of ownership (Zardetto-Smith et al., 2002). This is especially the case when the activities are relevant to daily life or experience (Weaver, 1998). Using simple materials to challenge students’
misconceptions are in line with Piaget’s ideas of equilibration (Bulunuz, Jarret & Bulunuz, 2009). Familiarity which can support assimilation in combination with incongruent experiences can encourage disequilibrium.
Online lessons
Hands-on lessons also have drawbacks (Klahr et al., 2007; Lazonder & Ehrenhard, 2014; Wysocki et al., 2013). Therefore, the preference is not always given to hands-on lessons (Klahr et al., 2007; Wysocki et al., 2013). For example, when phenomena are not readily visible or manipulated, such as atoms (Wysocki et al., 2013; Zacharia et al., 2012). Another drawback is that students can fail to recognise and apply the abstract principle underlying a concrete problem or situation while using concrete materials (Gick & Holyoak, 1980; Smith & Puntambekar, 2010).
Online lessons can be a solution for the downsides of hands-on lessons, especially for inquiry-based classrooms (e.g. Smith & Puntambekar, 2010; Zacharia & Olympiou, 2011). Online
11 Zacharia, 2012; Smith & Puntambekar, 2010). Besides that, characteristics like the time scale can be adapted in order to make interpretations easier and students can be encouraged to draw conclusions about several observations and linking them to symbolic equations (De Jong et al., 2013). Online lessons have several different affordances than hands-on lessons, such as safety, cost-efficiency, scaffolding, making or repeating measurements quickly and minimisation of errors (De Jong et al., 2013; Smith & Puntambekar, 2010; Triona & Klahr, 2003; Zacharia, 2007; Zacharia et al., 2015). Online lessons show to have a positive impact on students’ skills, attitudes and conceptual
understanding (Zacharia, 2007). Yang et al. (2012) indicate that participants like the ability to self-pace and flexibility of the schedule, such as repeating material whenever he or she prefers, about online learning. Furthermore, online lessons can provide multiple representations (verbal, numerical, pictorial, conceptual and graphical) and immediate feedback (Olympia & Zacharia, 2012; Smith & Puntambekar, 2010; Zacharia, 2007). Moreover, online lessons are less time consuming because they usually require less setup time and provide results of lengthy investigations instantaneously (De Jong et al., 2013; Smith & Puntambekar, 2010). As a result students are able to perform more experiments within the same amount of time and thereby gather more information or examples (De Jong et al., 2013; Olympia & Zacharia, 2012; Zacharia, 2007).
On the other hand, online lessons also include weaknesses for dealing with misconceptions, like the lack of tactile cues (Lazonder & Ehrenhard, 2014; Zacharia et al., 2012). Moreover, the perceived credibility of the online lessons can impede conceptual change (Lazonder & Ehrenhard, 2014). Students often regard the conflicting data as being unworthy of consideration in order to protect their incorrect initial beliefs (Chinn & Brewer, 1993). For example, students reject the findings by pointing out towards methodological issues (e.g. moving objects in a simulation are not affected by friction) or reinterpret the data in line with their misconceptions (e.g. the findings are correct for an ideal, online world but in real life things work differently)(Lazonder & Ehrenhard, 2014).
Hands-on lessons and online lessons
12 hands-on lessons and situations in which hands-on lessons are most appropriate (De Jong et al., 2013; Klahr et al., 2007; Olympia & Zacharia, 2012; Triona & Klahr, 2003; Zacharia & Olympiou, 2011). For example, Chini, Madsen, Gire, Rebello and Puntambekar’s (2012) study indicate that the concept of the lessons and the timing of the post-test influence the results which type of lesson is more beneficial. In their case, the topics force and mechanical advantage do not show any difference between the hands-on or online condition, but the topic ‘work’ shows better results for the online condition directly after the activity but similarly on the test one week later.
Hands-on lessons and online lessons have both their own pros and cons (Olympia & Zacharia, 2012). Combinations of hands-on lesson and online lessons can build on each other’s affordances (De Jong et al., 2013; Zacharia, Olympiou & Papaevripidou, 2008). Any combinations of hands-on lessons and online lessons produce higher learning gains than either of its constituents (Chini et al., 2012; Zacharia, 2007; De Jong et al., 2013; Zacharia et al., 2012; Zacharia et al., 2008). Lazonder and Ehrenhard (2014) suggest that the combination of hands-on and online lessons will produce the best learning outcomes because of the benefits of multiple representations rather than the single
representation of only the hands-on lesson or online lesson.
13
Research question
The current study aims to answer the following primary research question:
What is the most effective method, comparing hands-on lessons, online lessons or combinations of both (online lesson and then hands-on lesson; hand-on lesson and then online lesson) to tackle students’ misconceptions about Newton’s first law?
Other secondary questions are taken into account:
1. Which method will decrease students’ misconceptions about Newton’s first law to scientific conceptions the most, hands-on lessons, online lessons or combinations of both?
2. Which method has the best retention effect in maintaining scientific conceptions of students about Newton’s first law over time, hands-on lessons, online lessons or combinations of both? 3. Which method will change students’ confidence in their (mis)conceptions about Newton’s
first law the most, hands-on lessons, online lessons or combinations of both?
4. Which method will increase students’ interest in science the most, hands-on lessons, online lessons or combinations of both?
Method
Respondents
The research was conducted on two locations of a school at the HAVO (Higher General Secondary Education) and VWO (Pre-university education) level in The Netherlands. In total participated 183 students, but a number of students were removed from the dataset for the analyses based on the following criteria: Students did not attend or complete all the lessons or assessments of the (mis)conception test; students had inadvertently acquainted with another condition; students who had the online lesson when the online learning environment did not work properly and students who were not willing to fill in their own name on the questionnaires and misconception test. After
14 remained in the sample but their data was assigned as missing for relevant analyses. With the pre-test 19 questionnaires were missing and 5 questionnaires were missing at the post-test 2.
Based on the pre-test of the whole sample (N=183), students were matched to the four
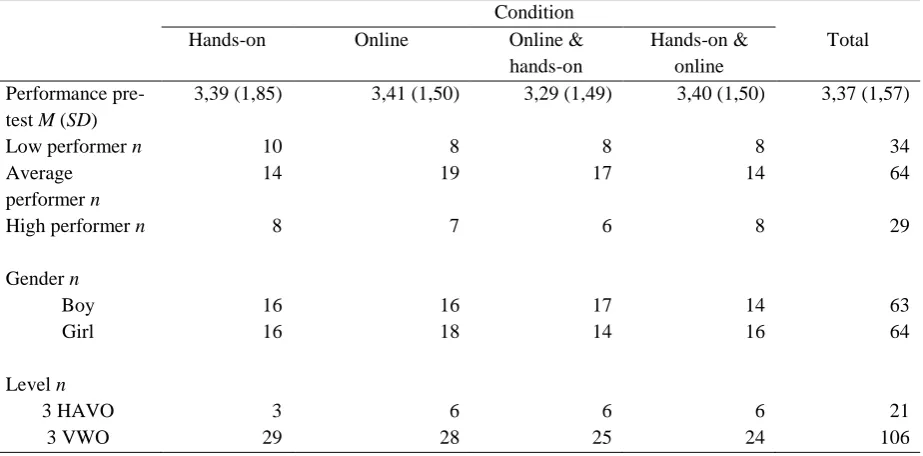
[image:14.595.68.530.414.642.2]different conditions based on their performance on the pre-test. Students were divided in groups by the performances at the pre-test, namely 25% low performing students, 50% average performing students, 25% high performing students. Subsequently, students were randomly assigned to each condition which resulted in the following distribution of participants to the conditions for the analysis (see Table 1): 32 students for the hands- on lesson condition; 34 students for the online lessons condition; 31 students for the online lesson and then hands-on lesson condition and 30 students for the hands-on lesson and then online lesson condition. From the selected sample for the analysis, 63 boys and 64 girls participated. Furthermore, 21 students were at the 3 Havo level and 106 students at the 3 Vwo level.
Table 1
Characteristics participants
Condition
Hands-on Online Online &
hands-on
Hands-on & online
Total
Performance pre-test M (SD)
3,39 (1,85) 3,41 (1,50) 3,29 (1,49) 3,40 (1,50) 3,37 (1,57)
Low performer n 10 8 8 8 34
Average performer n
14 19 17 14 64
High performer n 8 7 6 8 29
Gender n
Boy 16 16 17 14 63
Girl 16 18 14 16 64
Level n
3 HAVO 3 6 6 6 21
3 VWO 29 28 25 24 106
Materials
15 same type of material. For example, condition 3 started with the first online lesson that also condition 2 had and subsequently followed the second hands-on lesson as the same as condition 1 had.
The learning and teaching materials for all conditions were based on design principles that were derived from literature about misconceptions such as introducing anomalous data (Chinn and Brewer, 1993), introducing scientific conceptions that are intelligible, fruitful and plausible (Posner et al., 1982) and adopting inquiry-based learning as an educational strategy (e.g. Zacharia et al., 2015). The hands-on lesson and online lesson were designed to use the same type of knowledge (domain specific knowledge about Newton’s first law) and type of instruction (inquiry learning) and differed only at the aspect of using physical vs. online material in order to have an appropriate comparison as recommended by Klahr et al. (2007). Inquiry-based learning has been characterised as an educational strategy in which students were adopting a scientific approach in order to discover and construct new knowledge (De Jong, 2006; Pedaste et al., 2015). The five main phases of inquiry learning (namely orientation, conceptualization, investigation, conclusion and discussion) as described by Pedaste et al. (2015) were used to guide the inquiry learning in the hands-on lesson as well as the online lesson. The first phase orientation is intended to stimulate interest and curiosity in students for a new topic to investigate. Concretely this means for the lessons of the present research that the lessons were started plenary by orienting on the topic of Newton’s first law by asking question(s) to students about concrete examples. Secondly, the students started with the learning activities in pairs. Each learning activity went through the phases conceptualisation, investigation, conclusion and discussion. The conceptualization phase started with question(s) which incited predictions of the students.
16 were used for the experimentation phase.
The designed instruction materials were pre-tested. One primary school teacher and
educational scientist, one physics teacher in training, and one physics teacher and researcher evaluated the instruction. Furthermore, three educational science students and one physics student offered feedback on the instruction materials. The learning materials were tested by 46 students from primary school as well as secondary school. As of result of the pre-testing, among other extra information about the resulting force was given, images were added and sentences rephrased.
Hands- on learning materials.
The hands-on lessons used a model of a roller coaster to explain Newton’s first law. Students could experiment by moving a roller coaster cart on different roller coaster setups (e.g. hill and looping) and experimenting with masses on a cart. The theme of the lessons was roller coasters and started with questions from the teacher about examples of Newton’s first law with regard to roller coasters. A worksheet guided the students through the phases of inquiry learning during the learning activities. Figure 1 shows the hands-on material of the first learning activity of the first lesson. In concrete terms this meant for the first learning activity that
students predicted if the car continue moving as long on a track with fine sandpaper as on rough sandpaper or a on a track without sandpaper. Secondly, students released the cart on the different tracks and counted how many times the cart would move back and forth till the cart stopped. Those results and conclusions were written down on the worksheets and also their evaluation of their findings. Furthermore, a final conclusion at the end of the lesson was written and after each learning activity a plenary discussion was lead by the teacher.
Online learning materials
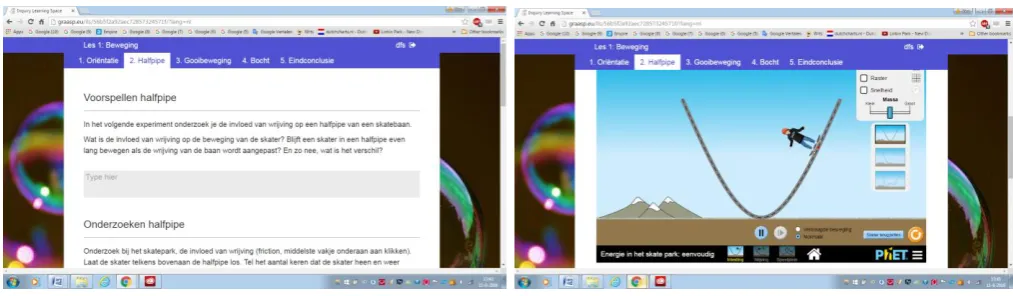
17 Figure 2. Online learning environment
http://graasp.eu/ils/56b5ece72aec72857324571e/?lang=nl). Each lesson started with a movie that introduced Newton’s first law. Subsequently, the learning activities followed the structure of inquiry
learning, which were the same as the phases in the worksheet of the hands-on lesson. The different aspect was that the online learning environment addressed Newton’s first law by allowing students to
experiment with simulations. Figure 2 shows a screenshot of the first learning activity of the first lesson. For example, students had to predict what the influence of friction on a halfpipe would be for a skateboarder. Secondly, students released the skateboarder on the halfpipe in a simulation and counted how many times the cart would move back and forth till the skateboarder stopped. Students could change the friction on the halfpipe. Their findings, conclusions and evaluation could be filled in online. Moreover, after each topic a classroom discussion was lead by the teacher. Finally, the final conclusion showed a short movie that referred to the first movie and the teacher drew also a conclusion plenary.
Instruments
Test (mis)conceptions and confidence.
The questions of the (mis)conception and confidence test are based on the four-tier diagnostic test (e.g. Gurel et al., 2015; Yang & Lin, 2015). This type of test measures not only students’
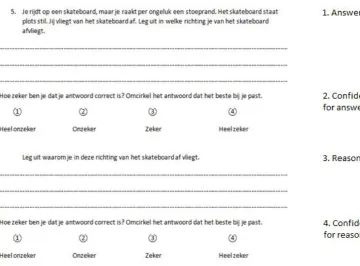
18 Misconceptions are very resistant to change and can impede further learning but even small shifts in conceptual change can be shown with a four-tier diagnostic test (Gurel et al., 2015). For example, starting to doubt about an own incorrect conception can be detected which is the first step of conceptual change according to Posner et al. (1982). Each task was build up as: 1. answer tier 2. confidence rating for answer tier 3. reason tier 4. confidence rating for reason tier. The addition
of reason tiers with corresponding confidence tiers helps to determine whether and how strong (mis)conceptions are biased by students reasoning (Caleon & Subramaniam, 2010; McClary & Bretz, 2012). For example, students could reason incorrectly but that would result in a correct answer or students could answer and reason correctly (Caleon & Subramaniam, 2010). Figure 3 displays an example of a (mis)conceptions test question. The first questions started with an answer tier which were open questions, multiple-choice questions or questions in which students were invited to draw pictures to demonstrate their knowledge (e.g. see “1. Answer tier” in Figure 3). Subsequently, students were asked how sure they were about their first answer (e.g. see “2. Confidence rating for answer tier” in
Figure 3). The reason tier was an open question to invite students to write down why they chose their
[image:18.595.79.440.457.723.2]answer at the first question in order for them to show their line of reasoning (e.g. see “3. Reason tier”
19 in Figure 3). Finally, students were asked how sure they were about their reasons for their answer (e.g. see “4. Confidence rating for reason tier” in Figure 3). The (mis)conception test consisted of 8
questions of which 5 questions used the structure of the four-tier diagnostic test. The other 3 questions consisted of only one open question and a confidence measure about that particular question. This structure was used because the structure of the four-tier diagnostic test was not possible due to for example asking only factual knowledge or arguments for a phenomenon.
The parallel tests for measuring the (mis)conception and confidence were pre-tested because it was a newly constructed test for the current research. One Physics student and 11 secondary school students completed the tests and they had the possibility to write remarks in the margin. Besides that, 3 Educational science students, 1 primary school teacher and educational scientist, 1 physics teacher in training and 1 physics teacher and researcher provided feedback about the test. As a result of the pre-testing, the number of questions was reduced, some sentences were reframed, important words highlighted and clearer images were used.
Cronbach’s alpha was calculated for the test of the (mis)conception and confidence in order to ensure reliability (Peterson, 1994). Cronbach’s Alpha was calculated for the (mis)conception tests and
confidence, which were consequently for the pre-test conception α = .24 and pre-test confidence α = .79, for post-test 1 conception α = .62 and post-test 1 confidence α = .91 and finally post-test 2 conception α = .63 and post-test 2 α = .92. Those Cronbach’s Alpha’s would be classified as
acceptable by the standards of Murphy and Davidshofer (1988) in Peterson (1994), except for the pre-test conception. However, this was probably due to student’s sporadic or lack of knowledge because
they were not yet taught about Newton’s first law and as a result of that answered single questions correctly by guessing.
Science curiosity scale.
Students’ interest in science was measured by the Science curiosity scale of Harty and Beall
20 viewpoint on science. Example questions were: ‘Wetenschappelijke tijdschriften zijn interessant.’ and ‘Ik zou het leuk vinden om wetenschappers te horen praten over hun beroep.’. The science curiosity
scale was not pre-tested with the target audience because this was a frequently used instrument (e.g. Rubenstein, 2000, Sharp & Kuerbis, 2006). However, one Psychology and Educational science student did offer feedback. After deleting three items which did not correlate well with the overall science curiosity scale, the total scale of the science curiosity scale at the pre-test had α = .90 and the total scale of the science curiosity scale at the post-test 2 had α = .92. Those Cronbach’s Alpha’s were high according to the standards of Murphy and Davidshofer (1988) in Peterson (1994).
Procedure
First, the ethical committee of the University of Twente approved the current study and the execution of related research activities. The participating schools distributed an information letter to the students and parents, which included among others a passive informed consent and the goal of the research and research procedure. Parents that had objections could call or mail before the research started. The pre-test consisted of the science curiosity scale and a test that measured the
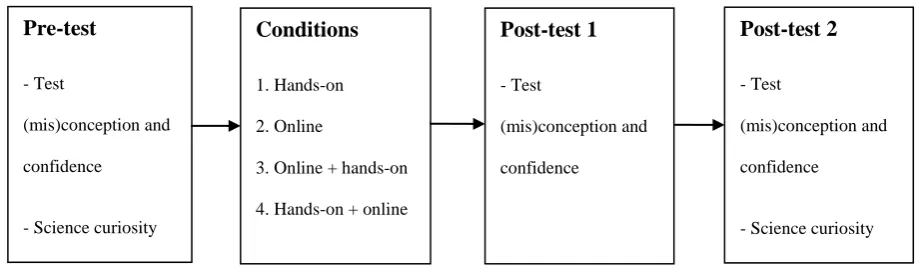
(mis)conception and confidence. Based on the (mis)conception test results, students were assigned to the different conditions of the experiment. Approximately four weeks after the pre-test, the different lessons were taught by a physics teacher and the researcher. Directly after the lessons, post-test 1 was administrated which included the test that measured (mis)conception and confidence. Post-test 2 was conducted three weeks after the intervention, including the (mis)conception and confidence test and science curiosity scale. Directly after post-test 2, students were thanked and debriefed about the research. The collected data were analysed, after which conclusions were drawn. Figure 4 shows a
schematic representation of the procedure with regard to the instruments.
Pre-test
- Test
(mis)conception and confidence
- Science curiosity scale
Conditions
1. Hands-on 2. Online
3. Online + hands-on 4. Hands-on + online
Post-test 1 - Test (mis)conception and confidence Post-test 2 - Test (mis)conception and confidence
[image:20.595.77.536.634.771.2]- Science curiosity scale
21
Coding
The (mis)conception and confidence test were coded in the following steps. The multiple-choice questions were scored ‘0’ for an incorrect answer and ‘1’ for a correct answer. The open questions were examined using a rubric. For the answer tier of the misconceptions test ‘0’, ‘0,5’and ‘1’were scored for each incorrect, partial correct and correct response, respectively. The rubric varied
for the reason tier from 0 points for no reasoning or misconception, 1 point for a partial correct answer and 2 points for a correct display of scientific conception. The minimum score for the (mis)conception test was 0 and the maximum score for the (mis)conception test was 20.
The scoring for the confidence ratings varied from 1, very uncertain till 4, very certain. When a student encircled two boxes, the lowest rating was coded because people have the tendency to present themselves in the best possible light (Randall & Fernandes, 1991).
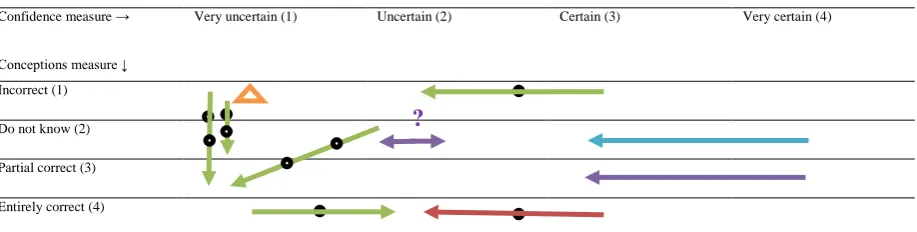
For the analysis of the confidence measures, the responses on the answer tier and reason tier were recoded. The scores were ‘1’ for an incorrect answer, ‘2’ when a student did not know the answer (e.g. “gamble”, “-“, “?”), ‘3’ for a partial correct answer and ‘4’ for an entirely correct answer. Subsequently, type of shift were coded between different tests (pair pre-test – post-test 1, pair pre-test – post-test 2, pair post-test 1- post-test 2). The types of shifts possible are indicated in Table 2. A
[image:21.595.72.531.402.518.2]positive shift was coded when a student attained more knowledge, would be more sure about their entirely correct answer or would be more unsure about their own incorrect answer (green arrow in Table 2). A negative shift would be if the opposite occurred than explained for a positive shift (red Table 2
Overview types of shifts
Confidence measure →
Conceptions measure ↓
Very uncertain (1) Uncertain (2) Certain (3) Very certain (4)
Incorrect (1)
Do not know (2)
Partial correct (3)
Entirely correct (4)
Note. A green arrow is a positive shift; A red arrow is a negative shift; A blue arrow is an irrelevant shift; A purple arrow is an unknown shift; The orange triangle means no shift; One black circle means a small shift; Two black circles mean a large shift.
22 arrow in Table 2). An irrelevant shift would be when a student did not know and also later did not know the answer (blue arrow in Table 2). Besides that, a shift in rating of the confidence measure when a student had a partial correct answer is an unknown shift because it is not explicitly clear from the data if a student started to have more doubts about the correct part of the answer or the incorrect part. Furthermore, if a student stayed at the same level of conception and one or both confidence measures are missing, it was also coded as an unknown shift. If a student scored the same at both tests, than it was assigned as no shift (orange triangle in Table 2). Furthermore, there were also scores assigned for the size of the shift. When there is a shift in a conception, than it would be assigned as a large shift (two circles in an arrow indicates a large shift in Table 2). When a shift is only in
confidence but the conception is at the same level, than it would be assigned as a small shift (one circle in an arrow indicates a small shift in Table 2).
A researcher, who was not involved in the current research project, served to establish a measure of inter-rater reliability by checking the tests in order to prevent bias of the researcher and to ensure quality. The Cohen’s Kappa of the (mis)conception tests were 0.928, which was deemed as
very high (McHugh, 2012). The Cohen’s Kappa was not calculated for the confidence measures because it was self-evident how to score as the lowest encircled box directly represents a rating.
Results
If the conditions were indeed comparable based on gender, performance and science curiosity at the pre-test, chi-square tests were performed. The Chi-square test showed that the conditions did not significantly differ in gender ( χ² (3, N = 127) = .53, p= .911) and performance on the pre-test (χ² (27,
N = 127) =20.35, p=.816). Furthermore, students did not significantly differ in viewpoints on science
curiosity (χ²negative viewpoint (57, N = 109) =53.96, p= .590; χ²neutral viewpoint (39, N = 109) = 43.39,
p= .290; χ²postive viewpoint (66, N = 109) = 60.41, p= .671). That was the reason why further analyses
23
Misconceptions test
In order to determine whether there were statistically significant differences between the four different conditions for tackling students’ misconceptions about Newton’s first law, repeated-measures ANOVA were executed. A difference was considered as significant when the p-value was smaller than .05. Repeated-measures ANOVA were performed with between-subjects variable, the condition in which each student participated, and within-subject variable, repeated measures of the total performance scores on the misconceptions tests. Mauchly’s test indicated that the assumption of sphericity has been met, χ² (2)= .41, p=.817. In other words, the results showed that the total
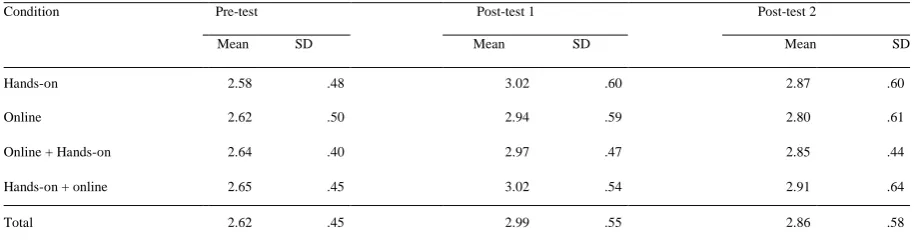
performance scores were not significantly affected by the condition. Means and standard deviations
of performance scores are shown in Table 3. Participants in the hands-on condition seemed to have
the most improved scores compared to the other conditions but there was as said not a significant
difference between conditions (see Table 3).
Repeated measures showed a main effect for the performance scores with regard to test moments, F (2)= 134.17, p=.000. The Bonferonni test showed as post-hoc analysis that the students significantly improved their scores on the conception test comparing post-test 1 with the pre-test (M = 3.23, SD = .24, p=.000) as well as post-test 2 with the pre-test (M = 3.44, SD = .23, p=.000). However, there was no significant increase between post-test 2 comparing with post-test 1 (M = .21, SD = .23, p=1.000), which indicated that student’s knowledge about Newton’s first law did not significantly Table 3
Mean values and standard deviation of performance scores
Condition Pre-test Post-test 1 Post-test 2
Mean SD Mean SD Mean SD
Hands-on (n=32)
3.39 1.85 7.36 3.32 7.28 2.81
Online (n=34)
3.41 1.50 6.22 2.26 7.07 2.96
Online + Hands-on (n=31)
3.29 1.49 6.87 2.35 6.35 2.30
Hands-on + online (n=30)
3.40 1.50 5.95 2.38 6.53 2.33
Total (n=127)
24
[image:24.595.67.530.116.550.2]
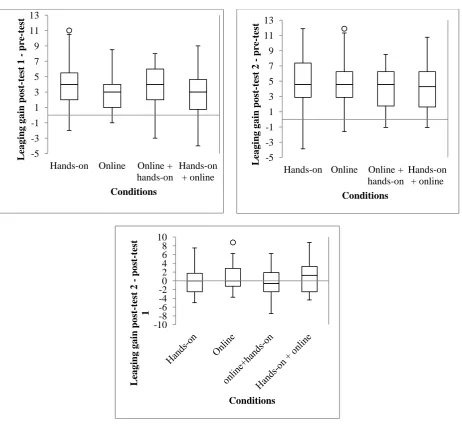
Figure 5. Learning gain scores between different tests.
Figure 6. Learning gain scores between different tests. -5 -3 -1 1 3 5 7 9 11 13
Hands-on Online Online +
hands-on Hands-on + online Conditions L ea g ing g a in po st -t est 1 pre -t est -5 -3 -1 1 3 5 7 9 11 13
Hands-on Online Online + hands-on Hands-on + online Conditions L ea g ing g a in po st -t est 2 pre -t est
-10 -8
-6 -4
-2 0
2 4 6 8 10 Conditions L ea g ing g a in po st -t est 2 po st -t est 1
changed after three weeks. The learning gains of post-test 1 compared to the pre-test for the four conditions are shown in Figure 5.
Confidence rating
The aim of the confidence ratings was to measure changes in confidence and determine shifts in conceptual change in nature and strength. The mean values and standard deviations of mean total confidence scores of the participants about their answers at the performance tests are presented in Table 4. Repeated-measures ANOVA were performed with between-subjects variable, the condition in which each student participated, and within-subject variable, repeated measures of the mean
25 sphericity has been met (χ² (2)= 3.18, p=.204). The participants were fairly confident about their
answers on the tests, in all conditions (M total pre-test = 2.62; M total post-test 1 = 2.99; M total post-test 2 = 2.86).
Repeated measures showed a main effect for the confidence scores with regard to test
moments (F(2)= 51.80, p=.000). Post hoc analysis showed that the students’ mean confidence ratings increased significantly directly after the lessons compared to the pre-test (M= .37, SD= .04, p = .000 and three weeks after the lessons compared to the pre-test (M=.24 , SD= .04, p =.000). Between mean confidence scores on post-test 2 and mean confidence scores on post-test 1 were, M = -.13, SD= .04, p = .004. Thus between post-test 2 and post-test 1 was a significant negative relationship with regard to mean confidence ratings.
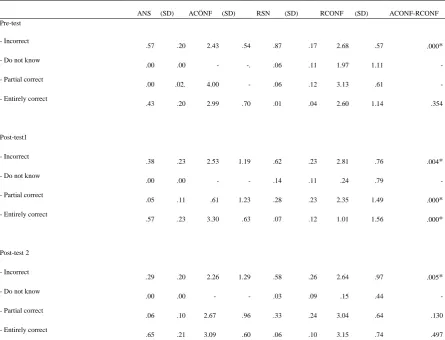
Table 5 report the mean values of correctness for both the answer and the reason tiers, their corresponding mean confidence rating, and t-test values between confidence ratings in the answer tier and reason tier. Three questions were not included in these analyses because those questions did not have the structure answer tier- answer tier confidence ratings – reason tier- reason tier confidence ratings. 127 Students participated in the analysis of the (mis)conception tests. However, not all students answered all confidence questions. Mean values and standard deviations were computed of
known confidence ratings. Furthermore, none of the students answered the answer rating that they did not know the answer to which explains mean values of 0 and no standard deviations or paired sample t-test in Table 5. Additionally, in Table 5 no standard deviation was mentioned for a partial correct Table 4.
Mean values and standard devations of mean total confidence scores on the (mis)conceptiontests
Condition Pre-test Post-test 1 Post-test 2
Mean SD Mean SD Mean SD
Hands-on 2.58 .48 3.02 .60 2.87 .60
Online 2.62 .50 2.94 .59 2.80 .61
Online + Hands-on 2.64 .40 2.97 .47 2.85 .44
Hands-on + online 2.65 .45 3.02 .54 2.91 .64
Total 2.62 .45 2.99 .55 2.86 .58
[image:25.595.69.528.201.321.2]26 answer at the pre-test because only one participant had that score and no paired sample t-test score was mentioned because there were no valid pairs. Repeated measures showed no significant effect between conditions for all types of correctness and confidence tiers.
A paired-sample t-test was conducted to compare the answer confidence rating with the reason confidence rating at each test moment. The paired-sample t-test for the incorrect answers at the pre-test showed a significant negative relationship between the confidence rating on the answer tier and the confidence rating on the reason tier at the pre-test (t(125)=-5.34, p =.000). These results suggest that when students answered incorrectly, they were more confident about the reason tier. Moreover, students were more often incorrect about their reasons than their answers (MANS incorrect=.57, MRSN
[image:26.595.71.517.110.450.2]incorrect=.87). Besides that, no significant positive relationship was found between de the confidence Table 5
Mean values and standard deviations of correctness and confidence ratings.
ANS (SD) ACÖNF (SD) RSN (SD) RCONF (SD) ACONF-RCONF
Pre-test
- Incorrect
.57 .20 2.43 .54 .87 .17 2.68 .57 .000*
- Do not know
.00 .00 - -. .06 .11 1.97 1.11 -
- Partial correct
.00 .02. 4.00 - .06 .12 3.13 .61 -
- Entirely correct
.43 .20 2.99 .70 .01 .04 2.60 1.14 .354
Post-test1
- Incorrect
.38 .23 2.53 1.19 .62 .23 2.81 .76 .004*
- Do not know
.00 .00 - - .14 .11 .24 .79 -
- Partial correct
.05 .11 .61 1.23 .28 .23 2.35 1.49 .000*
- Entirely correct
.57 .23 3.30 .63 .07 .12 1.01 1.56 .000*
Post-test 2
- Incorrect
.29 .20 2.26 1.29 .58 .26 2.64 .97 .005*
- Do not know
.00 .00 - - .03 .09 .15 .44 -
- Partial correct
.06 .10 2.67 .96 .33 .24 3.04 .64 .130
- Entirely correct
.65 .21 3.09 .60 .06 .10 3.15 .74 .497
Notes: ANS = Answer tier; ACONF = Answer tier confidence ratings; RSN = Reason tier; RCONF = Reason tier confidence ratings; ACONF-RCONF = t-test comparison between answer tier confidence rating and reason tier confidence ratings.; Incorrect = misconception or no answer; Do not know =student showed in their answer that they did not know the answer; Partial correct = student showed some conception but is not entirely correct; Entirely correct = completely correct conception.
27 scores on the answer tier and reason tier if students were correct at the pre-test (t(4)=1.05, p=.354).
For post-test 1 paired sample t-test showed that students were significantly more sure about their reason tier than their answer tier if they answered incorrectly and did not know the answer (tincorrect(126) -2.91, pincorrect =.004; tdo not know(126)= -3.47, pdo not know =.001). Students were more incorrect about their reason tier than the answer tier (MANS incorrect=.38, MRSN incorrect=.62). On the other hand, if students were entirely correct, they were clearly more sure about their answer tier than their reason tier (tentirely correct(126)= 15.65, pentirely correct =.000).
For post-test 2 paired sample t-test indicated that students were significantly more sure about their reason tier than their answer tier if they answered incorrectly (tincorrect(124)=-2.86, pincorrect =.005). Students were again more incorrect about their reason tiers than answer tiers (MANSincorrect=.29, MRSN incorrect=.58). Nonetheless, it showed no other significant relationships between the answer confidence tier and reason confidence tiers (tpartial correct(27)= -1.56, ppartial correct =.130; tentirely
correct(30)= 69, pentirely correct =.497) .
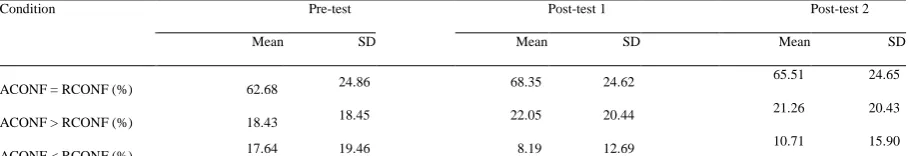
Table 6 shows the mean values (percentages) and standard deviations for the proportion of the answer confidence tier and reason confidence tier. When the students’ mean confidence scores on the answer tier and the confidence score on the reason tier were compared, it was found that the former was significantly higher than the latter at post-test 1 and post-test 2 (t post-test1(118)=5.50, p=.000; t
[image:27.595.71.526.639.717.2]post-test2(113)=4,03 p=.000). There was no significant difference between the confidence rating on the answer tier and the reason tier at the pre-test(t(119)=-.32, p=.753). Furthermore, the answer confidence ratings and reason confidence rating remained the same, had in percentages the highest proportion
Table 6
Mean values (percentages) and standard deviations for proportion answer confidence tier and reason confidence tier
Condition Pre-test Post-test 1 Post-test 2
Mean SD Mean SD Mean SD
ACONF = RCONF (%) 62.68 24.86 68.35 24.62
65.51 24.65
ACONF > RCONF (%) 18.43 18.45 22.05 20.44
21.26 20.43
ACONF < RCONF (%) 17.64 19.46 8.19 12.69
10.71 15.90
28 (Mpre-test= 62.68, SDpre-test = 24.86;Mpost-test 1= 68.35, SDpost-test 1 =24.62 Mpost-test 2= 65.51, SDpost-test 2
= 24.65). Subsequently, the answer confidence rating was higher than the reason confidence rating and
least present was answer confidence rating was smaller than the reason confidence rating. Repeated measures showed no significant difference between the four different conditions with regard to proportion of the answer confidence tier and reason confidence tier (FACONF=RCONF(5.64)=1.51, p=.181; FACONF>RCONF(6)=.53, p=.786; FACONF<RCONF(5.18)=1.51, p=.185).
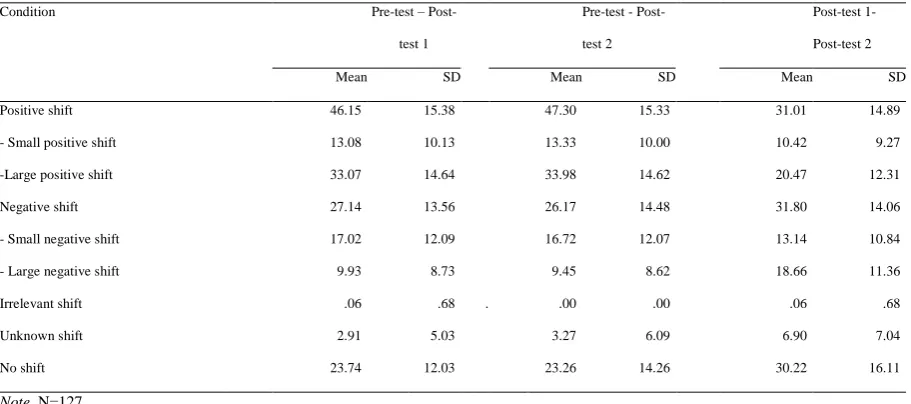
[image:28.595.71.527.552.754.2]Furthermore, the types of shifts were coded (see Table 7). One-way ANOVA showed no significant differences between the four different conditions with regard to type of shifts. Except for no shift between post-test 1 and post-test (F(3,123)=3.02, p=.032), for which Tukey’s HSD post hoc test showed that the hands-on condition had more no shifts than the hands-on and online condition (p=.030). Comparing the post-tests to the pre-test, mainly positive shifts occurred and those types of positive shifts were mainly large positive shifts (see Table 7). Subsequently, negative shifts, which were mainly small shifts, occurred the most after positive shifts when comparing the pre-test to the post-tests (see Table 7). For post-test 1 – post-test 2, negative shifts were found most frequently and also mostly large negative shifts rather than small negative shifts (see Table 7). In order to check whether there were significant differences in shifts between the different shifts moments, chi-square
Table 7
Mean values (percentages) and standarddeviations for types of shifts by condition
Condition Pre-test –
Post-test 1
Pre-test -
Post-test 2
Post-test 1-
Post-test 2
Mean SD Mean SD Mean SD
Positive shift 46.15 15.38 47.30 15.33 31.01 14.89
- Small positive shift 13.08 10.13 13.33 10.00 10.42 9.27
-Large positive shift 33.07 14.64 33.98 14.62 20.47 12.31
Negative shift 27.14 13.56 26.17 14.48 31.80 14.06
- Small negative shift 17.02 12.09 16.72 12.07 13.14 10.84
- Large negative shift 9.93 8.73 9.45 8.62 18.66 11.36
Irrelevant shift .06 .68 . .00 .00 .06 .68
Unknown shift 2.91 5.03 3.27 6.09 6.90 7.04
No shift 23.74 12.03 23.26 14.26 30.22 16.11
29 tests were performed. Chi-square tests indicated that between the shift of pre-test to post-test 1 and post-test 1 to post-test 2 significant difference for large negative shifts (χ² (30) = 45.74, p=.033), thus
between post- test 1 and post-test 2 more large negative shifts occurred than between the pre-test and post-test 1. For all test moments shifts, no shifts occurred as the most and unknown and irrelevant shifts were the rarest (see Table 7). Chi-square tests showed that the differences between all shifts moments were significant for unknown shifts (χ² Pre-test – Post-test 1 Pre-test - Post-test 2 (12) = 51.89, p=.000; χ² Pre-test – Post-test 1 Post-test 1- Post-test 2(12) = 33.71, p=.001; χ² Pre-test – Post-test 2 Post-test 1- Post-test 2(16) =
70.18, p=.000), which indicated that after each analysis more data is unknown. Furthermore, the shifts of pre-test to post-test 1 between pre-test to post-test 2 were significant for small positive shifts (χ² (36) = 59.00, p=.009, indicating more shifts) large positive shifts (χ² (81) = 152.28, p=.000, indicating more shifts), large negative shifts (χ² (25) = 80.83, p=.000, indicating more shifts) and no shifts (χ²
(63) = 88.23, p=.020, indicating less shifts).
Science curiosity
Students’ interest in science was also taken into account. The mean values percentages and
30 viewpoints (tnegative viewpoint(104) = 1.71, pnegative viewpoint = .091; tneutral viewpoint (104) = -.03, pneutral
viewpoint = .977; tpositive viewpoint(104) = -1.38, ppositive viewpoint = .171).
Conclusion and discussion
The current research inquired what the most effective method is, comparing hands-on lessons, online lessons or combinations of both (online lesson and then hands-on lesson; hand-on lesson and then online lesson), for tackling students’ misconceptions about Newton’s first law. This study showed that none of the type of methods could be regarded as the most effective method for tackling students’ misconceptions about Newton’s first law, even taken into account the secondary questions as
performances on (mis)conception test, long-term recall, students’ confidence in their (mis)conception and students’ interest in science.
This research contributes to the scientific debate whether hands-on lessons or online lessons would have more affordances with respect to tackling students’ misconceptions and whether a
combination of both would be more beneficial, and if so, if the order of presentation would matter (Klahr et al., 2007; Lazonder & Ehrenhard, 2014; Zacharia, 2007). It appeared from the present study that no method or combination of methods was superior to another method in order to tackle students’ misconceptions about Newton’s first law. Students have gained comparable conception in all
[image:30.595.70.512.174.306.2]conditions and did not score significantly worse or better after three weeks than directly after the Table 8
Mean values (percentages) and standard deviations of viewpoints on science
Condition Pre-test Gain scores
Negative Neutral Positive Negative Neutral Positive
Mean SD Mean SD Mean SD Mean SD Mean SD Mean SD
Hands-on (n=26/31ª) 28.60 26.47 24.75 15.88 46.66 23.80 -3.45 15.47 0.70 12.59 -0.35 18.05 Online (n=28/32 ª) 25.47 18.55 25.93 11.74 47.36 22.34 2.90 14.72 3.22 17.58 -4.83 13.82 Online + Hands-on (n=29/29 ª) 31.63 21.80 25.64 13.52 42.73 21.40 .32 14.62 -1.13 13.78 0.81 15.25 Hands-on + online (n=26/30 ª) 27.42 21.08 28.09 10.45 44.48 20.22 7.02 14.66 -3.01 13.17 -4.01 15.74 Total (n=109/122 ª) 28.32 21.90 26.09 12.92 45.27 21.74 2.48 14.93 -0.04 14.44 -2.11 15.70
31 lessons. The findings of the current study are therefore in contradiction with several studies that favour hands-on lessons (e.g Zacharia, et al., 2012), online lessons (e.g. Finkelstein et al., 2005) or a
combination of both as being better than one of its constituents (e.g. Chini et al., 2012; Smith & Puntambekar, 2010; Zacharia, 2007), since the current study showed that not one of the types of methods was more beneficial than the others. The present study is more in line with studies that show that hands-on lessons and online lessons are equally effective in achieving several instructional objectives (e.g. Triona &Klahr, 2003), or that the four conditions as used in the current study are equally effective in promoting conceptual change (Zacharia & Olympiou, 2011). Zacharia and Olympiou (2011) explained those findings by stating that experimentation, either hands-on or online experimentation, and not physicality is important in their domain of physics learning. Triona and Klahr (2003) suggested the idea that the type of material does not make the difference as long the instruction method is held constant. Triona and Klahr (2003) said that the most important features were captured in the instruction thus the type of material did not matter in their learning context. Other explanations with regard to the current research could be that not all students from the sample were included in the analysis. Furthermore, the first two classes had some unexpected events and a different design that could have influenced the results, such as some students and teachers were surprised that the research took place at the specific date and two classes had the lessons at the same time instead of only class. Additionally, for all the classes the hands-on lessons were taught by the researcher instead of a physics teacher. Taking into account the important role of teachers for the students’ achievements, this could influence the results because the researcher was not an experienced teacher (e.g. Hattie, 2003; George & Kaplan, 1998). The absence of decrease in performance after three weeks could be viewed as surprising because memory systematically deteriorates with delay (Anderson, 2005). An explanation for the lack of loss with delay could be that Newton’s first law and inertia was also a topic in the curriculum at one location during the period of the research. Students had an exam about forces the week before post-test 2. So this could explain why students still had quite good retention scores, since they recently rehearsed and studied the topic. Student’s practice would diminish loss with delay according to Anderson (2005).
32 misconceptions. No method or combination of methods stood out with regard to how sure students were about their answers. Students appeared to be more confident about their answers directly after the lessons but were less confident three weeks later than directly after the lessons. Yang and Lin (2015) drew the conclusion that students’ mean confidence rating for the answer tier was significantly higher
than for the reason tier. This is in line with the current study that indicated that overall, students tended to be more confident about their answering tier than their reasoning tier. However, when only incorrect answers were compared in the current study, students were more sure about the reasoning tier instead. An explanation for the higher mean rating on the answering tier than the reasoning tier could be that students were more often correct about their answering tier than reasoning tier and students scored more often higher on the confidence rating when they were entirely correct than incorrect. Besides that, previous studies using the four-tier diagnostic usually had only one moment of measurement (e.g. Caleon & Subramaniam, 2010; Kaltakçi, 2012; Yang & Lin, 2015), but the present study had three moments with the same sample, which as a result could identify types of shifts. For example, between the pre-test and post-test 1 were more small and large positive shifts and large negative shifts present than between the pre-test and post-test 2.
33 lessons). The tests also appeared to be reliable, except for the pre-test. The Cronbach’s Alpha of the first (mis)conception test was very low. This could be due to student’s lack of knowledge or sporadic knowledge and as a result of that answered some single questions correctly by guessing. However, a few students may had have a little bit of knowledge because at one school the term inertia was shortly mentioned in a movie before the pre-test.
Furthermore, the present study is significant for society because students’ viewpoints on science impact their future career choices and there is growing need for STEM jobs in modern society (Jocz et al., 2014; Morais, 2015; Wysocki et al., 2013). Several initiatives promote science curiosity such as FabLab+ and Miss to Hit. Those initiatives support teachers with a range of lessons in order to incite students to science and technology. Those initiatives can implement findings of the present study in their projects because this study also researched whether an instruction method would increase the science curiosity of students. The current study did not show any preferred instruction method in order to increase science curiosity. The findings even showed that science curiosity did not significantly increase. Literature also suggest that opinions about science are founded early in
childhood education and are hard to change later in children’s educational career (Kermani & Aldemir, 2015; Morais, 2015). Furthermore, even more students lose their interest in science during secondary school (Krapp & Prenzel, 2011; Logan, & Skamp, 2013). Other factors than the lessons could also have played a role concerning the lack of increase in students’ science curiosity in the present study. Students had to fill in the science curiosity questionnaire directly after an exam week or two weeks holiday, which could influence their decreased motivation for school and science. Furthermore, during the same period of the research, students had to make their final decision for their further study specialisation. If students had already made the decision to stop with the science subjects at the moment when this research took place, it would probably result in lower scores on the science curiosity scale. The findings now arouse the suggestion that only one or two lessons could not change students’ science curiosity positively. Possibly more long-term lessons/experiments and science
34 The current study is of value for educational practise as well because it is informative about which instruction method, a hands-on lesson, an online lesson or a combination of both, is preferable to teach Newton’s first law. Currently this information is missing in a framework for science education
(Zacharia, 2008; Zacharia et al., 2012). The present study indicated that no instruction method was more beneficial than another. In a framework for science education, no directive guidelines would be necessary to include which method teachers should chose. Teachers should have the option to choose their own preferable teaching method, since it does not seem to matter from which method students would learn more or make them more enthusiastic about science. Although it can be pointed out to teachers what the benefits are of the different methods, like an online lesson will be safer, cheaper, less time consuming and affords easier classroom management (Klahr et al., 2007; Smith & Puntambekar, 2010; Triona & Klahr, 2003; Zacharia et al., 2008). It is important to note that the current study has focused on students’ conceptual understanding, confidence and science curiosity and not on students
and teachers experiences of the lessons. Further research can also include those affective factors. Especially because all the methods were equally effective, the opinions of students and teachers could be a decisive factor on which type of method would be recommendable in a framework for the science curriculum. Furthermore, future research can make a fully blended learning lesson instead of a
separate hands-on lesson and an online lesson that would represent the combination of two types of methods. For example, students can record on a camera how a roller coaster car can be launched from a ramp. Students can edit the movie online by drawing arrows and playing in slow motion. A full integration of the hands-on method and online method could be compared with only one type of method or combination of two separate lessons.
35
References
Acar, Ö. (2014). Scientific reasoning, conceptual knowledge, & achievement differences between prospective science teachers having a consistent misconception and those having a scientific conception in an argumentation-based guided inquiry course. Learning and Individual Differences, 30, 148-154. doi:10.1016/j.lindif.2013.12.002
Anderson, J. R. (2005). Cognitive psychology and its implications (6th ed.). New York: Worth Publishers.
Boyes, E. (1988). Catastrophic misconceptions in science education. Physics Education, 23(2), 105-109.
Bulunuz, N., & Jarrett, O. S. (2010). The effects of hands-on learning stations on building American elementary teachers' understanding about earth and space science concepts. Eurasia Journal of Mathematics, Science & Technology Education, 6(2), 85-99.
Bulunuz, M., Jarrett, O. S., & Bulunuz, N. (2009). Middle school students’ conceptions on physical properties of air. Journal of Turkish Science Education, 6(1), 37-49.
Bursal, M. (2012).Changes in American preservice elementary teachers’ efficacy beliefs and anxieties during a science methods course. Science Education International, 23(1), 40-55.
Caleon, I. S., & Subramaniam, R. (2010). Do students know what they know and what they don’t
know? Using a four-tier diagnostic test to assess the nature of students’ alternative
conceptions. Research in Science Education, 40(3), 313-337. doi:10.1007/s11165-009-9122-4
Carrejo, D. J., & Reinhartz, J. (2014). Facilitating conceptual change through modeling in the middle
school science classroom. Middle School Journal, 46(2), 10-19.
36 laboratory. Physical Review Special Topics-Physics Education Research, 8(1), 010113.
doi:10.1103/PhysRevSTPER.8.010113
Chinn, C. A., & Brewer, W. F. (1993). The role of anomalous data in knowledge acquisition: A theoretical framework and implications for science instruction. Review of educational research, 63(1), 1-49.
Clement, J. (1982). Students’ preconceptions in introductory mechanics. American Journal of
physics, 50(1), 66-71.
De Jong, T. (2006). Technological Advances in Inquiry Learning. Science, 312, 532-533.
De Jong, T., Linn, M. C., & Zacharia, Z. C. (2013). Physical and virtual laboratories in science and engineering education. Science, 340(6130), 305-308.
DiGisi, L. L., & Yore, L. D. (1992, March). Reading comprehension and metacognition in science: status, potential and future direction. Paper presented at the Annual Meeting of the National
Association for Research in Science Teaching, Boston.
Duit, R. & Treagust, D. F. (2003) Conceptual change: A powerful framework for improving science teaching and learning, International Journal of Science Education, 25(6), 671-688,
doi:10.1080/09500690305016
Finkelstein, N. D., Adams, W. K., Keller, C. J., Kohl, P. B., Perkins, K. K., Podolefsky, N. S., ... & LeMaster, R. (2005). When learning about the real world is better done virtually: A study of substituting computer simulations for laboratory equipment. Physical Review Special Topics -Physics Education Research, 1(1), 010103-1 - 010103-8.
doi:10.1103/PhysRevSTPER.1.010103
Galili, I. & Tseitlin, M. (2003). Newton’s first law: Text, translations, interpretations and physics
37 Garbett, D. (2003). Science education in early childhood teacher education: Putting forward a case to
enhance student teachers' confidence and competence. Research in Science Education, 33(4), 467-481.
George, R., & Kaplan, D. (1998). A structural model of parent and teacher influences on science attitudes of eighth graders: Evidence from NELS: 88.Science Education, 82(1), 93-109.
Gick, M. L., & Holyoak, K. J. (1980). Analogical problem solving. Cognitive psychology, 12(3), 306-355.
Gire, E., Carmichael, A., Chini, J. J., Rouinfar, A., Rebello, S., Smith, G., & Puntambekar, S. (2010). The effects of physical and virtual manipulatives on students’ conceptual learning about pulleys. In K. Gomez, L. Lyons, & J. Radinsky (Eds.), Learning in the disciplines: Proceedings of the 9th international conference of the learning sciences (1, pp. 937 – 944).
Chicago: International Society of the Learning Sciences.
Gurel, D. K., Eryılmaz, A. & McDermott, L. C. (2015). A review and comparison of diagnostic instruments to identify students’ misconceptions in science. Eurasia Journal of Mathematics,
Science & Technology Education, 11(5), 989-1008. Doi: 10.12973/eurasia.2015.1369a
Hadzigeorgiou, Y. (2001). The Role of Wonder and 'Romance' in Early Childhood Science Education Le Rôle de l'Émerveillement et du 'Roman' dans l'Éducation Scientifique des Jeunes Enfants El Papel de las Maravillas y 'Romance' en la Ciencia Educación Temprana de los
Ninös. International Journal of Early Years Education, 9(1), 63-69. doi: 10.1080/713670677
Harty, H., & Beall, D. (1984). Toward the development of a children's science curiosity measure. Journal of Research in Science Teaching, 21(4), 425-436.
38 Heard, P. F., Divall, S. A., & Johnson, S. D. (2000). Can 'ears-on' help hands-on science learning for
girls and boys?. International Journal of Science Education, 22(11), 1133-1146. doi:10.1080/09500690050166715
Inan, H. Z., & Inan, T. (2015). 3 H s Education: Examining hands-on, heads-on and hearts-on early childhood science education. International Journal of Science Education, 37(12), 1974-1991. doi: 10.1080/09500693.2015.1060369
Jocz, J.A., Zhai, J. & Tan, A.L. (2014). Inquiry learning in the Singaporean context: Factors affecting student interest in school science. International Journal of Science Education, 36(15), 2596-2618, doi:10.1080/09500693.2014.908327
Kaltakçi, D. (2012). Development and application of a four-tier test to assess pre-service physics teachers’ misconceptions about geometrical optics (Unpublished doctoral thesis). Middle east
technical university, Ankara, Turkey.
Kermani, H., & Aldemir, J. (2015). Preparing children for success: integrating science, math, and technology in early childhood classroom. Early Child Development and Care, 185(9), 1504-1527. doi: 10.1080/03004430.2015.1007371
King, C. J. H. (2010). An analysis of misconceptions in science textbooks: Earth science in England and Wales. International Journal of Science Education, 32(5), 565-601.
doi:10.1080/09500690902721681
Klahr, D., Triona, L. M., & Williams, C. (2007). Hands on what? The relative effectiveness of physical versus virtual materials in an engineering design project by middle school children. Journal of Research in Science teaching,44(1), 183-203. doi:10.1002/tea.20152