ORIGINAL RESEARCH
Cognitive Aging, Executive Function, and
Fractional Anisotropy: A Diffusion Tensor
MR Imaging Study
S.M. Grieve L.M. Williams R.H. Paul C.R. Clark E. Gordon
BACKGROUND AND PURPOSE:Fractional anisotropy (FA) is a useful measure of connectivity in the brain that can be derived from the diffusion tensor imaging (DTI) dataset. This study investigated the relationship between FA and selected measures of cognition across a broad age group to explore a possible structural basis for cognitive changes with age.
METHODS: FA images were generated from DTI data acquired at 1.5T in 87 healthy subjects (age range, 20 –73 years). Relationships between a range of cognitive measures and FA were explored using regional and voxel-based analysis.
RESULTS: Age and regional average FA were significantly associated in the frontal, parietal, and temporal lobes but not in the occipital lobe. This negative relationship was especially prominent in the prefrontal regions of the frontal lobe, where FA declined at a rate of approximately 3% per decade. Decreased FA in the frontal, temporal, and parietal lobes was associated with poorer cognitive performance in executive maze and in an attention-switching task. A voxel-level analysis of these data revealed that the executive function-FA association was particularly strong and regionally delineated over 2 continuous, bilateral areas extending from the prefrontal cortex to the parietal lobe, with projections to the anterior portions of the thalamus.
CONCLUSIONS:We demonstrate a relationship between FA and a measure of executive function—a core cognitive component that is a key feature of cognitive aging. We propose that that FA may provide an early means for the detection of age-related cognitive change and suggest a need for prospective data to explore this association.
C
ognitive aging represents a massive personal, social, and health burden. The loss of cognitive abilities with advanc-ing age is commonly held to be an inevitable consequence of the normal aging process. However, the structural and cogni-tive description of the natural course of this normal aging process is incompletely described in the literature. MR imag-ing is commonly used to investigate brain structural changes using volumetric tissue changes by segmenting the brain into gray matter (GM), white matter (WM), and CSF fractions or by using intensity-based lesion identification to quantify structural changes (eg, subcortical white matter lesions used to measure cerebral small-vessel disease). Diffusion tensor imag-ing (DTI) is an MR imagimag-ing technique that exploits the exquis-ite sensitivity of MR imaging to diffusion processes in solution1,2to measure microscopic tissue orientation charac-teristics in vivo. DTI has found application in a wide range of neurologic areas, including cerebral ischemia, multiple sclero-sis, HIV, schizophrenia, head trauma, dementia, and develop-ment and aging research.3-7Numerous studies have demonstrated global GM loss with increasing age.8-13Age-related brain changes have been most consistently demonstrated in the prefrontal cortex,9,14 whereas evidence for accelerated GM loss degeneration or rel-ative preservation of many other brain regions is
heteroge-neous.9,12-14Increases in CSF volume with age have also been well documented in both the lateral ventricles and also dif-fusely in cortical sulci.8,15In contrast to the volume effects seen in GM (decrease) and CSF (increase), WM volume has been shown to vary little from early adulthood to maturi-ty.9,11,12,16-18A number of reports have found associations be-tween volumetric changes and cognition,15but no evidence of causality has been convincingly demonstrated during normal cognitive aging. A strong association has been demonstrated between subcortical white matter hyperintensities (“lesions”) and measures of cognitive function in the elderly.19-23These associations are particularly strong for measures of executive function and processing speed.23
The fractional anisotropy (FA) metric provides a simple and robust means to assess the degree of anisotropic diffusion occurring within a region.24Because FA reflects the degree of anisotropic diffusion, it will be high (ie, approaching unity) in regions of high organization (eg, corpus callosum), interme-diate in regions with some degree of organization (eg, white matter regions that have no strong predominant axon fiber axis orientation), and low in tissues where the predominant cell shape, and therefore diffusion, is not specifically oriented (eg, GM) and approaching zero in free fluids (eg, CSF). Re-ductions in FA have been demonstrated with advancing age,25-28with the largest reduction evident in frontal lobes. Others findings show both decreased frontal FA and a relative preservation of posterior high-anisotropy WM in elderly sub-jects compared with a younger cohort.29Studies connecting DTI measures and cognitive changes have been limited.30 In-creased FA is associated with improved reading performance in children.31O’Sullivan et al27have demonstrated a positive relationship between improved executive function and pari-Received August 15, 2005; accepted after revision March 29, 2006.
From The Brain Resource International Database (S.M.G., E.G.), The Brain Resource Company, Ultimo, Australia; The Brain Dynamics Centre (L.M.W.), Westmead Hospital, Westmead, Australia; School of Psychological Medicine (L.M.W.), University of Sydney, Sydney, Australia; Department of Psychiatry (R.H.P.), Centers for Behavioral and Preventive Medicine, Brown Medical School, Providence, RI; and Cognitive Neuroscience Laboratory and School of Psychology (C.R.C.), Flinders University, Adelaide, Australia.
etal FA. Madden et al32demonstrated a positive relationship between higher FA in the anterior limb of the internal capsule and improved response time in a visual target-detection task. Skenkin et al33showed that FA measurements at the centrum semiovale correlated positively with cognitive performance in an elderly cohort. Fellgiebel et al4failed to detect differences in FA in subjects with mild cognitive impairment compared with healthy control subjects. However, in the same study, de-creased FA in the left temporal lobe and in the left hippocam-pus were seen in a group of subjects with Alzheimer disease compared with control subjects. Although these results are heterogeneous, and derive from analysis of relatively small co-horts, they demonstrate the usefulness of FA measurements for the investigation of ultrastructural brain changes that may have a causative role in cognitive decline.34
The classic lesion-based approach used in neuropsychol-ogy relies on careful correlation between the loss of different aspects of cognitive function with spatially localized structural “lesions.”35However, the most important structural changes that occur during aging may be those that affect the circuitry between cortical and subcortical regions, rather than the iso-lated degeneration of localized regions.36Although numerous regional and global nonpathologic structural changes have been shown to occur with advancing age, the evidence linking these changes to specific cognitive functions is limited.36-38 Hence, while “lesion-based” insights have proved to be a very effective method for investigating many aspects of cognition, if age-related cognitive decline is caused in part by the subtle disruption of connectivity, this approach may not be an opti-mal framework for understanding the decline of cognitive function with age. In this article, we use voxel-based mor-phometry (VBM) to detect regional clusters of significant change in FA associated with both aging and with perfor-mance in cognitive tests. By analyzing FA data in this manner, the spatial distribution of the regions of FA decline can be visualized, and inferences can be made regarding altered con-nectivity within the brain.
This study serves to investigate the effect of age on brain structure on FA using VBM and region-of-interest (ROI) analysis in a large group of subjects spanning 6 decades of age. These age-related associations were contrasted with those found between FA and selected measures of cognitive function proposed to involve the frontal lobe.
Materials and Methods
Subjects
Eight-seven healthy subjects spanning 6 decades were drawn from the Brain Resource International Database (BRID), a standardized data base combining demographic, psychometric, physiologic, and ana-tomic information.39,40Exclusion criteria were any known neuro-logic disorder, previous head injury, mental retardation, DSM-IV Axis 1 psychiatric diagnosis,41and history of drug dependence. The DASS (Depression Anxiety Stress Scale) and SPHERE (Somatic and Psychological Health Report) questionnaires were used to screen for persons with a vulnerability to anxiety or depressive disorder.42The age range of the sample was 20 –73 years. Each subject provided writ-ten informed consent in accordance with the ethical guidelines of the National Health and Medical Research Council of Australia.
Image Acquisition
MR images were acquired using a 1.5T Sonata scanner (Siemens, Er-langen, Germany) at Perrett Imaging, Flinders University, Australia. 3D T1-weighted images were acquired in the sagittal plane using a 3D magnetization-prepared rapid acquisition of gradient echo (MPRAGE) sequence (TR, 9.7 ms; TE, 4 ms; echo train, 7; flip angle, 12°; TI, 200 ms; NEX, 1). A total of 180 contiguous 1-mm sections were acquired with a 256⫻256 matrix with an in-plane resolution of 1⫻1 mm resulting in isotropic voxels. Proton density and T2-weighted images were acquired using a dual-echo sequence (TR, 7530 ms; TE, 15/105 ms; echo train, 7; flip angle, 180°; NEX, 1). Forty-five contiguous 1-mm sections are acquired in an axial orientation, with an in-plane matrix of 256⫻256 at a resolution of 0.86⫻0.86 mm. DTIs were acquired using a DTI-EPI sequence (TR, 160 ms; TE, 88 ms; fat saturation; NEX, 4). A baseline image (b⫽0) and 12 different diffusion orientations were acquired with a b-value of 1250. Thirty-two contiguous 6.5-mm sections were acquired with an in-plane ma-trix of 128⫻128 at a resolution of 1.72⫻1.72 mm.
Volumetric MR Imaging Measurements
The details of the global MR imaging analysis procedure are described in Grieve (2005).9MPRAGE images were normalized to MNI space and segmented using Statistical Parametric Mapping (SPM2; Well-come Department of Imaging Neuroscience, London; http://www.fil. ion.ucl.ac.uk/spm), running under MATLAB 6.5 (MathWorks, Natick, Mass). Voxels were corrected after normalization to allow for volume quantification.43 Global measurements were obtained by summing each segmented voxel type after the application of a whole-brain mask.
Segmentation of T2-Weighted/Proton Density MR Imaging Data
Coregistration and normalization was performed using SPM. Cus-tomized GM and WM template images which were created from the averaged T2-weighted images of a first pass-segmentation were used for calculations.8For each subject, T2-weighted data were normalized to the custom T2-weighted template. The segmentation protocol used a cluster analysis method to separate pixels based on intensity differ-ences, together with a priori knowledge of spatial tissue distribution patterns in healthy subjects.8,43,44 After segmentation, WM maps were saved for use as a mask to exclude GM voxels from the subse-quent FA analysis. A threshold fractional value of 0.5 was used, im-plying greater than 50% probability of WM in the voxel. Over 98% of WM voxels in each segmented WM image used in this study have a fractional value between 0.8 and 1.0.
Diffusion Tensor Analysis
DTI data were processed using a custom written routine (by author S.M.G.) in MATLAB 6.5 (MathWorks). FA was calculated in native space from the b⫽0 image and 12 diffusion-weighted imaged images (b⫽1250 s/cm⫺2). FA was defined as: (3/2)1/2⫻[((
1⫺av)2⫹(2 ⫺av)
2⫹( 3⫺av)
2) / ( 1 2⫹
2 2⫹
3
2)]1/2, where
n⫽the eigen-values describing the diffusion tensor, andavis the mean diffusivity ((1⫹2⫹3)/3).
T2-Weighted and ADC Image Normalization
The FA image was coregistered to the T2-weighted image using a minimization-of-residuals approach.44 The DTI dataset and dual-echo images were acquired using the same section orientation and position. Use of the FA and T2-weighted image pair in the
coregistra-BRAIN
ORIGINAL
tion step gave the best results (data not shown). As described above, T2-weighted images were first normalized to MNI space. The affine transformation parameters used in this transform were saved and applied to the coregistered FA images to generate normalized FA im-ages in MNI space.
Gross Region of Interest Parcellation
Frontal, parietal, temporal, and occipital lobe regions were defined so as to be consistent with the automated anatomic labeling (AAL) struc-tures defined by Tzourio-Mozoyer et al (2001) but with borders ex-tending into WM, deep into this cortical parcellation.45The AAL parcellation was chosen as the basis for the segmentation because it is defined in Montreal Neurologic Institute (MNI) space, a standard-ized coordinate system in common usage. The landmarks used for delineating these lobes are clarified below. All lobe assignments were made with reference to each other to be internally consistent. The frontal lobe was defined as all cerebrum anterior to the central sulcus and superior to the Sylvian fissure. Parcellation was performed in an axial view, and assignments were cross-checked with AAL parcella-tion to ensure consistency. At the deepest point of the central sulcus, a straight line was drawn to the interhemisphereic fissure. Where the anterior horns of the lateral ventricles were visible, a line was drawn from the central sulcus to the anterior limit of the ventricles, then back to the interhemispheric fissure. The corpus callosum was sepa-rately outlined to exclude it from the frontal lobe. In sections contain-ing the insula, with reference to the AAL parcellation, this region was excluded, and a line was drawn from the Sylvian fissure to the inter-hemispheric fissure. Inferior regions of the brain were clearly sepa-rated from temporal lobe structures by CSF. The parietal lobe was defined as all cerebrum superior and anterior to the parieto-occipital sulcus, posterior to the central sulcus, and superior to the corpus callosum and was traced in a sagittal plane with reference to both AAL and other lobe assignments. The occipital lobe was defined as every-thing posterior to the boundaries described below. Parcellation of the occipital lobe was performed from the midline in a parasagittal view. The anterosuperior border was defined by the parieto-occipital and the temporo-occipital sulci. Lateral to the midline, from where the parieto-occipital sulcus was no longer prominent, a straight line was drawn between it and the horizontal ramus of the superior temporal sulcus. The posteroinferior border was defined by the anterior calcar-ine sulcus, the collateral sulcus, and the posterior transverse collateral sulcus and included the lingual gyrus. The temporal lobe included the superior, middle, and inferior gyri. The borders were defined by the Sylvian fissure, occipitotemporal sulcus, superior temporal sulcus, and the lateral border of the parahippocampal gyrus.
Statistical Analysis
Descriptive data are expressed as mean⫾SD or as percentage values, as appropriate. Before correlation analysis, we grouped cognitive measures into quartiles according to cognitive performance. Statisti-cal analysis used SPSS for Windows Version 12.0 (SPSS, Chicago, Ill). Correlations were performed using Pearson product-moment corre-lation, controlling for sex and age where indicated. Quantitative esti-mates of associations were performed using multiple linear regression and are quoted ascoefficients (95% confidence interval [95% CI]). In all analyses, a value ofP⬍.05 was considered significant.
Diffusion Tensor Analysis
Voxel-based analysis of the FA images was performed using SPM. Using the WM segmentation of the T2-weighted/proton density
data-set, WM masks were used to create FA images containing WM only. This was done because GM and WM have characteristically different FA values and are therefore not correctly analyzed using the paramet-ric assumptions inherent in VBM analysis using SPM. A 12-mm Gaussian filter was applied to the FA datasets before analysis using VBM, but not before region-based analysis.
The relationship between aging and FA was investigated at a whole-brain level using regression model with age as a continuous variable and sex as a nuisance covariate. To investigate the relation-ship between FA and cognitive performance, a reduced field of inter-est including only the frontal lobe was defined (see above). Executive maze and the composite psychometric score described above were included in the model as continuous variables.
Psychometric Testing
Psychometric tests were accessed from the BRID, and the acquisition and validation of these tests has been have been fully described else-where.39,40,46,47The psychometric tests were part of a fully comput-erized and standardized battery, “IntegNeuro.”39,40The IntegNeuro test battery has been validated against conventional psychometric testing.46The cognitive tests used were chosen to index the brain’s core cognitive competencies: sensorimotor (tapping and choice reac-tion time), memory (digit span), executive funcreac-tion (switching of attention task, executive maze), and estimated intelligence as a global measure of cognition (spot the real word). Some details of these tests are given below.
Simple Motor Tapping.Participants were required to tap a circle on the touchscreen with the index finger as fast as possible for 60 seconds. The total number of taps with the dominant hand was scored.
Choice Reaction Time.Participants attended to the computer screen as 1 of 4 target circles was illuminated in a pseudorandom sequence. For each trial, subjects used the hand of preference to touch the illuminated circle as quickly as possible after presentation. The dependent variable was the mean reaction time across 20 trials.
Digit Span.Participants were presented with a series of digits on the screen and were then asked to immediately enter the digits on a numeric keypad in the order of presentation. The number of digits in each sequence was increased from 3 to 9, with 2 trials; subjects were scored out of 14 based on correct recall of digit lists.
Switching of Attention.This test provides a computerized adap-tation of the Trail-Making test.48The total number of errors recorded from part 2 of this test was used. In this task, subjects are presented with a pattern of 13 numbers (1–13) and 12 letters (A–L) and required to touch numbers and letters alternatively in ascending sequence (ie, 1, A, 2, B, 3, C).
Results
Patient Characteristics
Differences in subject characteristics across age were tested for by dividing the subjects into 2 groups. The average age of the younger group was 25⫾5 years and that of the older group was 51⫾9 years. No differences in sex, handedness, educa-tion, alcohol consumpeduca-tion, or frequency of positive SPHERE scores were detected between the groups.
Psychometric Tests and Volumetric MR Imaging
Table 1 summarizes the age-related trends observed for the psychometric and volumetric MR imaging measures. Of the psychometric data, only the performance in the executive maze (P⬍.001) and in the attention-switching task (P⫽.004) were significantly different between groups. Analysis of the volumetric MR imaging data scores revealed significantly lower GM volume (P⬍.001), and a nonsignificantly higher CSF volume (P⫽.072) in the elder subjects, a result consistent with that previously demonstrated in the BRID cohort from which the subjects in the current study were drawn.
Region of Interest Measurements of FA
The global average FA was 0.320⫾0.017. By lobe, the average FA values were: frontal, 0.311⫾0.024; parietal, 0.324⫾0.020; temporal, 0.325⫾0.018; and occipital, 0.268⫾0.017. Corre-lations between FA scores and age and between FA and a range of psychometric test scores are presented in Table 2. Except for the occipital lobe, FA was strongly related to age and was in-dependent of sex for all brain regions (P⬍.001). FA in the frontal, parietal, and temporal lobes was strongly correlated to executive maze completion time and to the attention-switch-ing task error rate (P⬍.01). The attention-switching–FA re-lationship was also significant in the occipital lobe and sur-vived correction for age and sex in all lobes. The cognition-FA associations were strongest for executive maze; however, ex-ecutive maze-FA associations were dependent on age. Im-proved tapping speed was positively correlated to FA in the
temporal and frontal lobes, as well as reaction time to frontal lobe FA; however, these correlations were weaker than those described above. It is noteworthy that tapping speed appeared to be independently associated with FA in the temporal lobe. No significant correlations were detected between estimated IQ and digit span and any FA measurement.
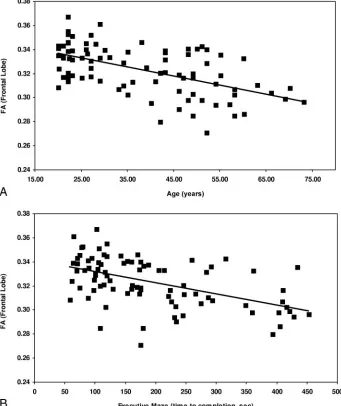
Scatterplots of frontal FA data are presented in Fig 1 versus age (Fig 1A), and executive maze completion time (Fig 1B). Figure 1Ashows the relationship between frontal FA and age can be approximated by a linear trend (⫽0.01/year; 95% CI, 0.007– 0.013/year;r2⫽0.371;P⬍.001). This corresponds to a decline from an average frontal FA of 0.34 in the third decade (20 –30 years of age) to a value of 0.30 in the seventh (60 –70 years of age), or approximately 3% per decade. Figure 1B shows the relationship between FA and executive maze, with executive maze completion time plotted as the dependent variable. This relationship can also be approximated as a linear trend (⫽ ⫺24 seconds per 0.01 FA; 95% CI, 16 –33 s/0.01 FA;r2⫽0.274;P⬍.001). Post hoc analysis (Tukey test) of the attention switching data grouped the data into 2 homogenous subsets: poor performers (greater than one error, lower FA) and good performers (one error or less, higher FA). The dif-ference in FA between these groups was 0.017 (P⬍.001) in the frontal and parietal lobes and 0.014 (P⬍.001) in the occipital and temporal lobes.
Voxel-Based Morphometry of FA: Age Effects
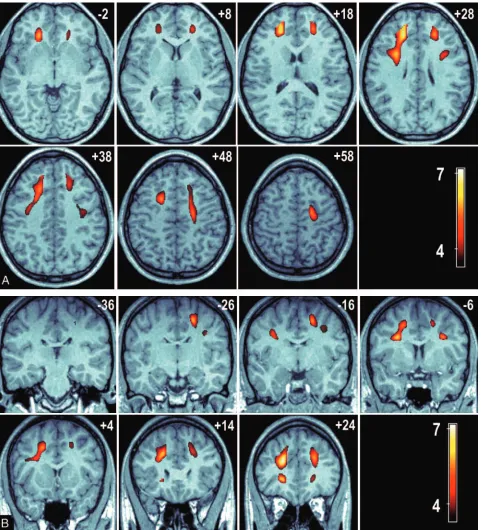
The relationship between age and FA was analyzed at a voxel level by using VBM to characterize any focal age-related re-gional changes in FA. The results of a whole-brain, voxel-based analysis demonstrated significant regions of reduced FA associated with advanced age in the frontal WM tracts. No significant voxels were detected subcortically or in the tempo-ral, parietal, or occipital lobes. Bilateral regions were seen for a negative relationship between FA and age (ie, FA is lower in older age groups) in the WM tracts adjacent to the middle frontal gyrus and the dorsolateral superior frontal gyrus. Fur-ther significant regions were detected over the WM adjacent to the left inferior frontal gyrus. These regions are presented in Fig 2 as color T-score maps superimposed on a representative anatomic MR image registered in MNI space. Figure 2Ashows a series of axial views 10 mm apart (ordered left to right, top to bottom in an inferior to superior direction) that show the anterior to posterior extent of these bilateral clusters. Sections are labeled by their MNI section coordinate. Figure 2Bshows a series of coronal section views (ordered left to right, top to bottom in a posterior-to-anterior direction). The bilateral clusters extend over the middle frontal, superior frontal, and inferior frontal gyri. This result was adjusted for sex by the inclusion of sex as a nuisance covariate.
Voxel-Based Morphometry of FA: Psychometric Data
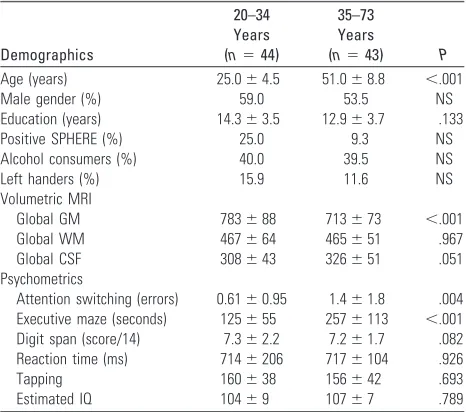
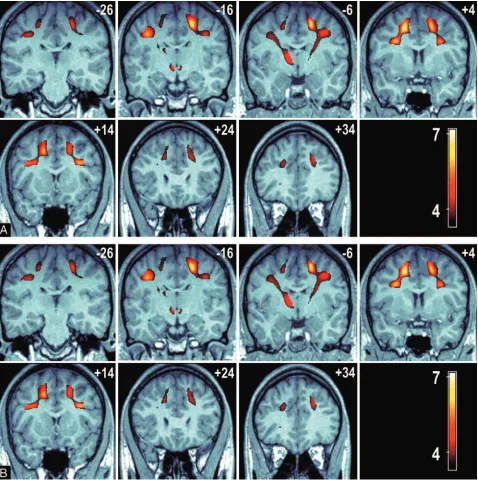
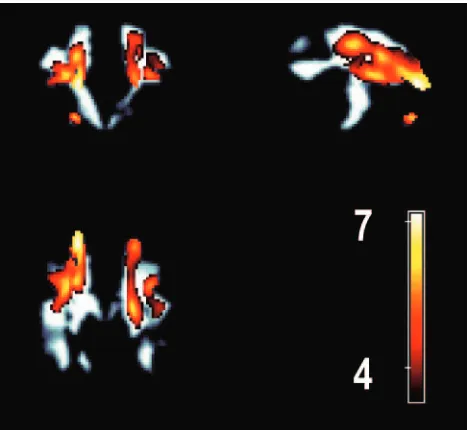
[image:4.585.53.286.57.263.2]Of the psychometric tests, only executive maze and attention-switching error rate showed a significant difference between the younger and elder groups (Table 1); hence, our VBM anal-ysis was limited to these measures. Figure 3 shows 2 sets of serial images displaying the significant voxel clusters detected in the VBM analysis. A number of significant FA voxel clusters associated with executive maze performance were detected and included, and they exceed those seen in the age-FA model, Table 1: Subject characteristics stratified by age
Demographics
20–34 Years (n⫽44)
35–73 Years
(n⫽43) P
Age (years) 25.0⫾4.5 51.0⫾8.8 ⬍.001
Male gender (%) 59.0 53.5 NS
Education (years) 14.3⫾3.5 12.9⫾3.7 .133
Positive SPHERE (%) 25.0 9.3 NS
Alcohol consumers (%) 40.0 39.5 NS
Left handers (%) 15.9 11.6 NS
Volumetric MRI
Global GM 783⫾88 713⫾73 ⬍.001
Global WM 467⫾64 465⫾51 .967
Global CSF 308⫾43 326⫾51 .051
Psychometrics
Attention switching (errors) 0.61⫾0.95 1.4⫾1.8 .004 Executive maze (seconds) 125⫾55 257⫾113 ⬍.001 Digit span (score/14) 7.3⫾2.2 7.2⫾1.7 .082 Reaction time (ms) 714⫾206 717⫾104 .926
Tapping 160⫾38 156⫾42 .693
Estimated IQ 104⫾9 107⫾7 .789
with extensive significant clusters extending to the parietal lobe and the thalamus. These clusters represent regions in which a positive FA/executive maze relationship (ie, higher FA is associated with faster executive maze completion). No neg-ative maze performance-FA clusters were detected. Figure 3A shows a series of axial views 10 mm apart (ordered left to right,
top to bottom in an inferior-to-superior direction) that show the anterior to posterior extent of these bilateral clusters. Sec-tions are labeled by their MNI section coordinate. Figure 3B shows a series of coronal sections views (ordered left to right, top to bottom in a posterior-to-anterior direction) that dem-onstrate the corticothalamic and corticocortical connections
[image:5.585.53.538.58.158.2]Fig 1.Scatterplots displaying the relationship between FA and age (A). FA decreases linearly with age (⫽0.010/year; 95% CI, 0.007– 0.013 year;r2⫽0.371;P⬍.001). B, FA and time to completion for the executive maze test. Higher FA is associated with faster completion of the maze, a relationship described by a linear trend (⫽ ⫺24 seconds per 0.01 FA unit; 95% CI, 16 –33 seconds per 0.01 FA;r2⫽0.274;P⬍.001).
Table 2: Correlation between regional FA and psychometric test scores
Measure
Frontal Lobe FA Temporal Lobe FA† Parietal Lobe FA† Occipital Lobe FA†
Raw Adjusted† Raw Adjusted† Raw Adjusted† Raw Adjusted†
Age ⫺0.61** ⫺0.62** ⫺0.41** ⫺0.44** ⫺0.56** ⫺0.56** ⫺0.04 ⫺0.04
Attention switching 0.37** 0.25* 0.33** 0.23* 0.40** 0.29* 0.23* 0.23*
Executive maze 0.49** 0.14 0.21* ⫺0.04 0.47** 0.18 0.04 0.03
Digit span 0.04 ⫺0.02 0.02 0.00 0.06 0.02 0.06 0.06
Reaction time 0.35** 0.17 0.16 0.05 0.35** 0.19 0.05 0.05
Tapping 0.22* 0.18 0.28* 0.28* 0.21 0.17 0.18 0.18
Estimated IQ ⫺0.04 0.04 ⫺0.10 ⫺0.05 ⫺0.00 0.08 ⫺0.05 ⫺0.05
†Adjusted for age and gender.
*p⬍0.01; **p⬍0.001
[image:5.585.121.462.195.601.2]between cluster maxima. Cluster maxima are seen in WM re-gions adjacent to the inferior parietal gyrus, the precentral and postcentral gyri, the prefrontal cortex, the middle frontal gy-rus, and in the anterolateral portions of the thalamus, adjacent to the inferior left parietal gyrus.
Common areas of significant clusters are shared with the age-FA model (bilaterally) adjacent to the middle frontal, superior frontal, and inferior frontal gyri. A cluster was also
observed in the anterolateral aspect of the left thalamus extending both ventrally and caudally. Although they have been described for the purposes of location as clusters, Fig 3A,-Bclearly show that the clusters described are contigu-ous. Figure 4 compares the overlap between the age-FA and maze performance-FA clusters by superimposing the age-FA clusters in color over the significant maze perfor-mance-FA clusters (gray-scale) in a maximum intensity
Fig 2.A, A series of axial images at 10-mm intervals showing T-scores (in color) superimposed over a representative high-resolution anatomic magnetization-prepared rapid acquisition of gradient echo (MPRAGE) image in standardized MNI space. Bilateral cluster of voxels are present in the frontal and parietal lobes (sections⫹28 to⫹48 mm); in addition, significant voxels connect these regions to the anterior thalamus (sections⫺2 to⫹28 mm).
[image:6.585.55.536.40.570.2]projection. The overall volume of the age-FA clusters was 29.4 mL compared with 49.5 mL for the maze perfor-mance-FA clusters.
No significant regional clusters representing a structurally restricted association between attention-switching error rate and FA were detected using VBM. The highly skewed distri-bution of errors in the attention-switching task necessitated the use of categories (good versus poor performers) in this analysis.
Discussion
Using an ROI approach, we demonstrated an approximately linear relationship between increased age and decreased FA in
all cortical lobes except the occipital lobe. This negative rela-tionship was strongest in the frontal lobe with a monotonic decline of approximately 3% per decade from the average value of 0.34 in the age of 20 –29 (P⬍.001). Using VBM, we were able to detect significant bilateral clusters of WM that represent a local area of high FA loss with age within the fron-tal lobes (Fig 2). Although the region-based analysis demon-strated that FA declines diffusely with age over most of the brain (excluding the occipital lobe), only in the frontal lobe was the age-FA strong enough to enable detection using voxel-based analysis.
Our VBM analysis of executive maze performance and FA
Fig 3.A, A series of axial images at 10-mm intervals showing T-scores (in color) superimposed over a representative high-resolution anatomic MPRAGE image in standardized MNI space. Bilateral cluster of voxels are present in the frontal and parietal lobes (sections⫹28 to⫹48 mm), in addition significant voxels connect these regions to the anterior thalamus (sections
⫺2 to⫹28 mm).
[image:7.585.56.534.41.521.2]detected extensive connected regionally discrete foci where these 2 variables were significantly associated. The bilateral clusters of WM identified in which decreased FA was associ-ated with poorer performance in the executive maze test spanned the frontal and parietal lobes (Fig 3) and also pro-jected to the anterior portions of the thalamus. As shown in Figs 3 and 4, these significant voxels in these regions were contiguous, a feature that is supportive of these clusters rep-resenting degenerative changes in 1 or more specific networks, rather than discrete focal changes.
Strong correlations that were independent of age and sex were detected between the attention-switching error rate and FA in all lobes. Despite this, no significant focal regions were detected when this relationship was explored by VBM. This may reflect the diffuse nature of the association, which was observed in all lobes in the gross regional analysis. The error rate has a very low threshold of discrimination between poor and good performance (⬎1 error) and perhaps lacks the fidel-ity to describe what might be expected to be a continuous relationship (between performance in this task and FA). The magnitude of the correlation was also weaker than that seen for executive maze; hence, the analysis performed here may simply have lacked sufficient power.
No relationship was detected between FA and memory (digit span) or between FA and intelligence (as measured by estimated IQ). Digit span (working memory) on the other hand, has previously been shown to be relatively resistant to normal aging.50FA is only weakly related to sensorimotor function (as measured by tapping and reaction time), though an intriguing correlation between temporal lobe FA and tap-ping speed survived correction for the effect of age and sex. The lack of correlation between estimated IQ and FA scores is consistent with the weak or absent associations described above, because intelligence tests predict performance in a wide range of measures including reaction time and memory.51,52
Attention switching and negotiating a maze are
well-de-scribed psychometric measures that test aspects of executive function and are known to be associated with age-related cog-nitive decline.53-55The executive electronic maze tests the ca-pacity to plan and execute an outcome. It also reflects error monitoring and correction and has been shown previously to vary significantly with age.53The results in this study demon-strate that attention-switching performance is positively re-lated to FA, independent of age. This association appears to be diffuse and not focused to any particular anatomic region. Previous work has shown that performance of this test acti-vates the dorsal lateral prefrontal cortex.56However, rather than a focal “lesion” picture deleteriously affecting perfor-mance, our results are more consistent with a decline in con-nectivity (as indexed by FA) affecting this measure.
Subcortical ischemic disease is readily characterized using T1-weighted MR imaging as subcortical hyperintensities (SH). A considerable weight of evidence has shown that in-creased levels of SH were associated with poorer cognitive sta-tus among older persons.19-21,23,57,58However, the relation-ship between SH burden and cognition does not appear to be a continuous positive one. The difference between the large proportion of the healthy elderly subjects in this study who exhibited no SH on MR imaging and those with significant SH was marked, a result suggesting that a “threshold” of lesion burden may be required for cognitive impairment.57A previ-ous study by our group provided evidence that the relation-ship between SH and cognitive abilities in the elderly may be driven a subset of people, with the cognitive decline outside of this subset determined by factors other than SH.22Our previ-ous results suggest that SH is not the primary factor associated with age-related cognitive decline but one of multiple pro-cesses that may affect the natural course of human aging and cognitive functioning of older adults. Therefore, the continu-ous positive FA-executive function relationship present in the current data suggests that the FA measurements provide a more direct measure of the structural change that may be the basis for age-related decline in executive function, whereas the lesions may be a relatively late manifestation of ongoing struc-tural change.
There was a large degree of overlap between with the re-gions in the frontal lobes from the executive maze-FA model and those detected in the age-FA model described above (Fig 4). The greater extent of the executive maze-FA clusters sug-gests that FA may have additional modulators beyond the age-dependence also seen in this study. However, because the ex-ecutive maze-FA relationship is not independent of age, it is not possible to rule out that the psychometric measure may simply be modeling age. We argue that if this were the case, greater regions of significant clusters would have been ob-served in the age-FA VBM analysis. Although the overlap of age and FA changes suggests that FA may be a good indicator of age-related ultra-structural changes, it is not possible to ascribe, from this cross-sectional study, any causal role to FA as a result of the observed association with cognitive function. However, we note that age per se cannot cause dysfunction and that it is biologically plausible for decreases in FA to affect cognitive performance.
The range of tests used in this study tapped a range of as-pects of cognitive dimensions associated with the frontal lobes, a region expected, based on previously published data,
[image:8.585.53.288.41.256.2]to show age-related changes. Comparison of performance in these psychometric tests revealed a highly significantly differ-ence between our older and younger subjects in executive function (the maze), and a modest but significant difference was evident in the attention-switching error rate (Table 1). The subjects in this study were all normal and screened for major psychiatric and medical pathology. In addition, the av-erage age of the older group was 51 (range, 35 to 79 years), an age that is not usually associated with major cognitive decline. This group was therefore well suited for studying the early onset of cognitive aging. However, it is likely that the relatively young and unimpaired cohort in this study limited the statis-tical power of our analysis. The potential for the introduction of errors at each of the acquisition, processing, and analysis stages cannot be ignored in any study such as the current one. DTI datasets are subject to greater levels of spatial distortion than high-resolution T2- and T1-weighted datasets. Our use of coregistered T2-weighted images to assist with the normal-ization of the FA maps may minimize this source of error because the coregistration step is performed on images that very closely resemble each other anatomically, allowing dis-torted images to be spatially matched to unaffected data. Pfef-ferbaum and Sullivan (2003) demonstrated that FA can be affected greatly by the inclusion of GM in WM ROIs.29This can occur through partial volume effects or by imprecise ROIs that include GM with WM tissue. In this study, we attempted to avoid this problem using a sophisticated coregistration and segmentation procedure; in practice, however, the relative low resolution of the DTI dataset means that partial volume effects are, to a certain extent, unavoidable.
The prefrontal cortex is known to be functionally critical to performance in tests of executive function. Regions of WM adjacent to the prefrontal cortex were observed in both the age-FA and connectivity-cognition VBM models. A develop-mental study has previously provided evidence that increases in FA and in blood oxygen level– dependent functional MRI activation in the frontal and parietal lobes are associated, pro-viding evidence for joint maturation of WM and GM in a frontoparietal network.59It is a natural extension of this idea that decreased connectivity, as indexed by a decline in FA, might precede functional changes in cognitive performance involving these pathways. The prefrontal cortex forms part of the prefrontal-striatal system and is known to be highly in-volved in executive function. The 3 prefrontal regions (medial, orbital, and lateral) are reciprocally connected and have path-ways to the anterior and dorsal thalamus.60Hence, it is possi-ble that these data may reflect degenerative changes in either of these pathways. However, it is not possible to determine the nature of the connectivity within this continuous cluster; therefore, no firm conclusions can be made regarding the cor-ticocortical or corticothalamic nature of the networks involved.
We provide evidence for an association between decreased FA and poorer performance in a test of executive function. The robust association between executive maze performance and FA in the region-based analysis suggests that there may be a role for the use FA in the early detection of cognitive decline. Although the observations made in this study provide strong evidence for a relationship between FA and age-related cogni-tive decline, they are not sufficient to ascribe causality. A
pro-spective, longitudinal study across a group of subjects with greater levels of cognitive decline would provide converging evidence to elucidate causal connections.
Conclusions
This study investigated the relationship between cognitive ag-ing and FA, a measure of connectivity in the brain, in a group of 87 healthy subjects ranging in age from 20 to 73 years. FA was found to decline markedly with age in the frontal, parietal, and temporal lobes but not in the occipital region. Decreased FA was found to be associated with poorer cognitive perfor-mance in executive maze and in an attention-switching task. Using VBM, the regional basis of these associations was ex-plored at high resolution. FA was strongly associated with age in the prefrontal cortex. Significant bilateral clusters of pixels in which the executive maze-FA association was particularly strong were identified extending from the frontal to the pari-etal lobes, with extension from these regions to the thalamus. A substantial amount of overlap was observed between the significant age-FA and executive maze-FA clusters identified; however, the executive maze-FA clusters were more extensive. Given the central importance of executive function as a core cognitive function, the strong association between decreased connectivity observed here, and executive function here sug-gests that FA may be a useful index of early cognitive decline. Further prospective data are required to investigate this association.
References
1. Basser PJ, Mattiello J, LeBihan D.Estimation of the effective self-diffusion tensor from the NMR spin echo.J Magn Reson B1994;103:247–54
2. Hahn EL.Spin echoes.Phys Rev1950;80:580
3. Ciccarelli O, Werring DJ, Barker GJ, et al.A study of the mechanisms of nor-mal-appearing white matter damage in multiple sclerosis using diffusion ten-sor imaging– evidence of Wallerian degeneration.J Neurol2003;250:287–92 4. Fellgiebel A, Wille P, Muller MJ, et al.Ultrastructural hippocampal and white
matter alterations in mild cognitive impairment: a diffusion tensor imaging study.Dement Geriatr Cogn Disord2004;18:101– 08
5. Filippi CG, Ulug AM, Ryan E, et al.Diffusion tensor imaging of patients with HIV and normal-appearing white matter on MR images of the brain.AJNR Am J Neuroradiol2001;22:277– 83
6. Foong J, Maier M, Clark CA, et al.Neuropathological abnormalities of the corpus callosum in schizophrenia: a diffusion tensor imaging study.J Neurol Neurosurg Psychiatry2000;68:242– 44
7. Sotak CH.The role of diffusion tensor imaging in the evaluation of ischemic brain injury—a review.NMR Biomed2002;15:561– 69
8. Good CD, Johnsrude IS, Ashburner J, et al.A voxel-based morphometric study of ageing in 465 normal adult human brains.Neuroimage2001;14:21–36 9. Grieve SM, Clark CR, Williams LM, et al.Preservation of limbic and
paralim-bic structures in aging.Hum Brain Mapp2005;25:391– 401
10. Haug H.Are Neurons of the Human Cerebral Cortex Really Lost During Ag-ing? A Morphometric Examination.In: Tarber J, Gispen WH, eds.Senile De-mentia of Alzheimer Type.Berlin: Springer-Verlag; 1985:150 – 63
11. Jernigan TL, Archibald SL, Fennema-Notestine C, et al.Effects of age on tissues and regions of the cerebrum and cerebellum.Neurobiol Aging2001;22:581–94 12. Raz N, Gunning FM, Head D, et al.Selective aging of the human cerebral cortex observed in vivo: differential vulnerability of the prefrontal gray matter.Cereb Cortex1997;7:268 – 82
13. Resnick SM, Goldszal AF, Davatzikos C, et al.One-year age changes in MRI brain volumes in older adults.Cereb Cortex2000;10:464 –72
14. Sowell ER, Peterson BS, Thompson PM, et al.Mapping cortical change across the human life span.Nat Neurosci2003;6:309 –15
15. Adak S, Illouz K, Gorman W, et al.Predicting the rate of cognitive decline in aging and early Alzheimer disease.Neurology2004;63:108 –14
16. Blatter DD, Bigler ED, Gale SD, et al.Quantitative volumetric analysis of brain MR: normative database spanning 5 decades of life.AJNR Am J Neuroradiol 1995;16:241–51
res-onance imaging study of changes in brain morphology from infancy to late adulthood.Arch Neurol1994;51:874 – 87
19. Cook IA, Leuchter AF, Morgan ML, et al.Cognitive and physiologic correlates of subclinical structural brain disease in elderly healthy control subjects.Arch Neurol2002;59:1612–20
20. Gunning-Dixon FM, Raz N.The cognitive correlates of white matter abnor-malities in normal aging: a quantitative review. Neuropsychology 2000;14:224 –32
21. O’Brien JT, Wiseman R, Burton EJ, et al.Cognitive associations of subcortical white matter lesions in older people.Ann N Y Acad Sci2002;977:436 – 44 22. Paul RH, Haque O, Gunstad J, et al.Subcortical hyperintensities impact
cog-nitive function among a select subset of healthy elderly.Arch Clin Neuropsy-chol2005;20:697–704
23. Prins ND, van Dijk EJ, den Heijer T, et al.Cerebral small-vessel disease and decline in information processing speed, executive function and memory.
Brain2005;128:2034 – 41
24. Pfefferbaum A, Sullivan EV, Hedehus M, et al.Age-related decline in brain white matter anisotropy measured with spatially corrected echo-planar dif-fusion tensor imaging.Magn Reson Med2000;44:259 – 68
25. Abe O, Aoki S, Hayashi N, et al.Normal aging in the central nervous system: quantitative MR diffusion-tensor analysis.Neurobiol Aging2002;23:433– 41 26. Nusbaum AO, Tang CY, Buchsbaum MS, et al.Regional and global changes in
cerebral diffusion with normal aging.AJNR Am J Neuroradiol2001;22:136 – 42 27. O’Sullivan M, Morris RG, Huckstep B, et al.Diffusion tensor MRI correlates with executive dysfunction in patients with ischaemic leukoaraiosis. J Neurol Neurosurg Psychiatry2004;75:441– 47
28. Sullivan EV, Adalsteinsson E, Hedehus M, et al.Equivalent disruption of re-gional white matter microstructure in ageing healthy men and women. Neu-roreport2001;12:99 –104
29. Pfefferbaum A, Sullivan EV.Increased brain white matter diffusivity in nor-mal adult aging: relationship to anisotropy and partial voluming.Magn Reson Med2003;49:953– 61
30. Moseley M, Bammer R, Illes J.Diffusion-tensor imaging of cognitive perfor-mance.Brain Cogn2002;50:396 – 413
31. Deutsch GK, Dougherty RF, Bammer R, et al.Children’s reading performance is correlated with white matter structure measured by diffusion tensor imag-ing.Cortex2005;41:354 – 63
32. Madden DJ, Whiting WL, Huettel SA, et al.Diffusion tensor imaging of adult age differences in cerebral white matter: relation to response time. Neuroim-age2004;21:1174 – 81
33. Shenkin SD, Bastin ME, MacGillivray TJ, et al.Childhood and current cogni-tive function in healthy 80-year-olds: a DT-MRI study. Neuroreport 2003;14:345– 49
34. Pfefferbaum A, Sullivan EV.Microstructural but not macrostructural disrup-tion of white matter in women with chronic alcoholism. Neuroimage 2002;15:708 –18
35. Van der Werf YD, Scheltens P, Lindeboom J, et al.Deficits of memory, execu-tive functioning and attention following infarction in the thalamus; a study of 22 cases with localised lesions.Neuropsychologia2003;41:1330 – 44 36. Tisserand DJ, Jolles J.On the involvement of prefrontal networks in cognitive
ageing.Cortex2003;39:1107–28
37. Rabbitt P, Lowe C.Patterns of cognitive ageing.Psychol Res2000;63:308 –16 38. Uylings HBM, West MJ, Coleman PD, et al.Neuronal and Cellular Changes in the
Ageing Brain.New York: McGraw-Hill, 2000:61–76
39. Gordon E.Integrative neuroscience.Neuropsychopharmacology2003;28 (Suppl 1):S2–S8
40. Gordon E, Cooper N, Rennie C, et al.Integrative neuroscience: the role of a standardized database.Clin EEG Neurosci2005;36:64 –75
41. American Psychiatric Association.Diagnostic and Statistic Manual of Mental Disorders,4th ed. Washington DC: American Psychiatric Association; 1994 42. Hickie IB, Davenport TA, Hadzi-Pavlovic D, et al.Development of a simple
screening tool for common mental disorders in general practice.Med J Aust 2001;175 Suppl:S10 –S17
43. Ashburner J, Friston KJ.Voxel-based morphometry–the methods.Neuroimage 2000;11:805–21
44. Friston KJ, Holmes A, Poline JB, et al.Detecting activations in PET and fMRI: levels of inference and power.Neuroimage1996;4:223–35
45. Tzourio-Mazoyer N, Landeau B, Papathanassiou D, et al.Automated anatom-ical labeling of activations in SPM using a macroscopic anatomanatom-ical parcella-tion of the MNI MRI single-subject brain.Neuroimage2002;15:273– 89 46. Paul RH, Lawrence J, Williams LM, et al. Preliminary validity of “integneuro”: a
new computerized battery of neurocognitive tests. Int J Neurosci 2005;115:1549 – 67
47. Williams LM, Simms E, Clark CR, et al.The test-retest reliability of a standard-ized neurocognitive and neurophysiological test battery: “neuromarker.”Int J Neuroscience2005;115:1605–30
48. Brown EC, Casey A, Fisch RI, et al.Trial making test as a screening device for the detection of brain damage.J Consult Psychol1958;22:469 –74
49. Baddeley A, Emslie H, Nimmo-Smith I.The Spot-the-Word test: a robust esti-mate of verbal intelligence based on lexical decision.Br J Clin Psychol1993; 32(Pt 1):55– 65
50. Wiegersma S, van der Scheer E, Human R.Subjective ordering, short-term memory, and the frontal lobes.Neuropsychologia1990;28:95–98
51. Rabbitt P, Goward L.Age, information processing speed, and intelligence.Q J Exp Psychol A1994;47:741– 60
52. Sen A, Jensen AR, Sen AK, et al.Correlation between reaction time and intel-ligence in psychometrically similar groups in America and India.Appl Res Ment Retard1983;4:139 –52
53. Lamar M, Zonderman AB, Resnick S.Contribution of specific cognitive pro-cesses to executive functioning in an aging population.Neuropsychology 2002;16:156 – 62
54. Verhaeghen P, Cerella J.Aging, executive control, and attention: a review of meta-analyses.Neurosci Biobehav Rev2002;26:849 –57
55. Verhaeghen P, Cerella J, Semenec SC, et al.Cognitive efficiency modes in old age: performance on sequential and coordinative verbal and visuospatial tasks.Psychol Aging2002;17:558 –70
56. Li ZH, Sun XW, Wang ZX, et al.Behavioral and functional MRI study of attention shift in human verbal working memory.Neuroimage2004;21:181–91 57. Boone KB, Miller BL, Lesser IM, et al.Neuropsychological correlates of white-matter lesions in healthy elderly subjects. A threshold effect.Arch Neurol 1992;49:549 –54
58. Breteler MM, van Amerongen NM, van Swieten JC, et al.Cognitive correlates of ventricular enlargement and cerebral white matter lesions on magnetic reso-nance imaging. The Rotterdam Study.Stroke1994;25:1109 –15
59. Olesen PJ, Nagy Z, Westerberg Het al.Combined analysis of DTI and fMRI data reveals a joint maturation of white and grey matter in a frontoparietal net-work.Brain Res Cogn Brain Res2003;18:48 –57