The Association of BMI Status With Adolescent
Preventive Screening
WHAT’S KNOWN ON THIS SUBJECT: Guidelines ask providers to target adolescent diet and physical activity counseling by BMI status, but providers do not consistently provide this service and often rely on inspection alone versus calculating BMI percentile.
WHAT THIS STUDY ADDS: This study investigated whether providers target adolescent preventive screening on the basis of BMI status, with a focus on overweight adolescents, given recent guidelines. The study is strengthened by the use of adolescent self-report versus relying on provider or parent report.
abstract
OBJECTIVE:To examine the relationship between BMI status (normal, overweight, and obese) and preventive screening among adolescents at their last checkup.
METHODS:We used population-based data from the 2003–2007 Califor-nia Health Interview Surveys, telephone interviews of adolescents aged 12 to 17 years with a checkup in the past 12 months (n⫽ 9220). Respondents were asked whether they received screening for nutri-tion, physical activity, and emotional distress. BMI was calculated from self-reported height and weight: (1) normal weight or underweight (⬍85th percentile); (2) overweight (85th–94th percentile); and (3) obese (⬎95th percentile). Multivariate logistic regression models tested how screening by topic differed according to BMI status, adjust-ing for age, gender, income, race/ethnicity, and survey year.
RESULTS:Screening percentages in the pooled sample (all 3 years) were higher for obese, but not overweight, adolescents for physical activity (odds ratio: 1.4;P⬍.01) and nutrition (odds ratio: 1.6; screen-ing did not differP⬍.01). Stratified analysis by year revealed higher screening for obese (versus normal-weight) adolescents for nutrition and physical activity in 2003 and for all 3 topics in 2005. However, by 2007, screening did not differ according to BMI status. Overall screen-ing between 2003 and 2007 declined for nutrition (75%–59%;P⬍.01), physical activity (74%– 60%; P⬍.01), and emotional distress (31%– 24%;P⬍.01).
CONCLUSIONS:Obese adolescents receive more preventive screening versus their normal-weight peers. Overweight adolescents do not re-port more screening, but standards of care dictate increased attention for this group. These results are discouraging amid a rise in pediatric obesity and new guidelines that recommend screening by BMI status.
Pediatrics2011;128:e317–e323 AUTHORS:Carolyn Bradner Jasik, MD, Sally H. Adams, RN,
PhD, Charles E. Irwin Jr, MD, and Elizabeth Ozer, PhD
Division of Adolescent Medicine, Department of Pediatrics, University of California San Francisco, San Francisco, California
KEY WORDS
preventive services, adolescent, obesity, screening, mental health
ABBREVIATIONS
CHIS—California Health Interview Survey OR—odds ratio
www.pediatrics.org/cgi/doi/10.1542/peds.2010-2559 doi:10.1542/peds.2010-2559
Accepted for publication Apr 22, 2011
Address correspondence to Carolyn Bradner Jasik, MD, Department of Pediatrics, University of California, San Francisco, 3333 California St, Suite 245, Box 0503, San Francisco, CA 94118. E-mail: [email protected]
PEDIATRICS (ISSN Numbers: Print, 0031-4005; Online, 1098-4275). Copyright © 2011 by the American Academy of Pediatrics
FINANCIAL DISCLOSURE:The authors have indicated they have no personal financial relationships relevant to this article to disclose.
Funded by the National Institutes of Helth (NIH).
obesity screening and treatment. The 2008 Expert Committee recommenda-tions and the 2010 US Preventive Services Task Force guidelines ask providers to target efforts differently for 3 BMI percentile groups: normal weight (0 – 84th percentile); over-weight (85th–94th percentile); and obese (⬎95th percentile).1,2 The
in-creased attention on the overweight group highlighted the new commit-ment to early intervention. They also recommend incorporating mental health and psychosocial assessment with obesity screening given the high rate of depression and anxiety among overweight youth.2 These
recommen-dations were drawn from growing evi-dence for the importance of primary care screening and treatment of pedi-atric obesity. Patients who are identi-fied as obese are more likely to receive physical activity and nutrition screen-ing and proper laboratory testscreen-ing and referrals.3–6 In addition, adolescents
who are told that they are obese by their providers are more likely to re-port attempting weight loss in the past year and report better nutrition.7
Previous studies on primary care screening for pediatric obesity focus on whether providers measure BMI and provide recommended counsel-ing.8–12 However, because the new
standard of care is not just to calculate the BMI but to also calculate the per-centile, data are needed regarding how ready providers are to meet this expectation. The most recent data from Klein et al6reveal that although
99% of patients have height and weight measured at their visit, only 52% of providers calculate the BMI percentile. Few studies investigate whether pro-viders target screening differently on the basis of BMI status or incorporate mental health screening as advised in recent guidelines.
and physical activity in the context of increased public awareness and the release of new guidelines. Ma et al13,14
used the National Ambulatory Medical Care Survey to investigate trends in diet and physical activity in adults and adolescents from 1992 to 2000. They found that there was a modest in-creasing trend in counseling for both adults and adolescents, but overall it was quite low. This study is limited by the use of National Ambulatory Medi-cal Care Survey data set, which relies on provider coding of obesity diagno-sis and provider report of counseling services and now is outdated.15
Our study investigates screening for nutrition, physical activity, and emo-tional distress from the adolescent perspective using data from the 2003– 2007 biennial California Health Inter-view Survey (CHIS). We extend previous knowledge by investigating screening separately by all 3 categories of BMI status and also including mental health as a screening topic. Our pri-mary aim was to investigate if over-weight adolescents (85th–94th BMI percentile) in addition to obese adoles-cents (⬎95th percentile) have a higher proportion screened for nutri-tion, physical activity, and emotional distress. Our secondary aim was to de-scribe screening percentages by year during a time of increased public awareness of pediatric obesity.
METHODS
Procedures
We used adolescent data from the 2003, 2005, and 2007 CHISs, a population-based household tele-phone survey of 3 cohorts of California residents. The CHIS is the largest rep-resentative state health survey in the United States and includes adult (aged ⱖ18 years), adolescent (aged 12–17 years), and child surveys (aged
California, Los Angeles, Center for Health Policy Research. Procedures were approved by the internal review boards at the University of California, Los Angeles, the state of California, Westat, and the federal Office of Man-agement of the Budget. Random sam-pling of households was conducted by Westat from all California counties, and adolescent interviews were con-ducted with 1 randomly selected ado-lescent from households that had res-idents aged 12 to 17 years. Data are weighted using a household and popu-lation weight. Missing values were re-placed using relational imputation by the CHIS staff for the public-use data file. Detailed descriptions of the CHIS procedures can be found in the CHIS 2005 Methodology Series (www.chis. ucla.edu).16
Participants
All CHIS adolescent respondents who reported a checkup within the past 2 years completed a series of questions asking whether they had talked to their provider about specific health-related topics at their most recent physical examination. To reduce recall bias and to be consistent with Ameri-can Academy of Pediatrics guidelines for yearly health maintenance exami-nation, we limited our analysis to ado-lescents who reported an examination in the last 12 months (n⫽9220), which is 79% of the total CHIS adolescent sample (n⫽11 677) for the 3 survey years.1* The rate of having a checkup in
the past 12 months was higher in 2007 (81.3%) than in 2003 (75.6%) (P ⫽
.0002). This could be explained by the
*Of 11 677 subjects who responded to the survey, 9220 (79%) had a checkup in the past 12 months. The samples only differed according to age (younger respondents were more likely to have had a checkup;P⫽.01) and income (those with higher income were more likely to have a checkup;
increasing enrollment in state health insurance. In fact, 93% of the sample in 2007 reported being currently insured versus 90% in 2003 (P⫽.01).
Measures
Age, race/ethnicity, and gender were self-reported by the adolescent. Race and ethnicity were coded into 5 catego-ries: white, black, Hispanic/Latino, Asian, and other (includes mixed race/ ethnicity and American Indian/Alaskan Natives). Income status was taken from parent-report and categorized as less than 300% or 300% or greater of the federal poverty level. Preventive health screening was measured by 3 items that asked adolescents if they talked to their physician at last checkup about physical activity, nutri-tion, and emotions or moods. Age-adjusted BMI was calculated using self-reported height and weight and categorized into 3 levels according to Centers for Disease Control and Pre-vention percentile: (1) normal-weight/ underweight (⬍85th percentile); (2) overweight (85th–94th percentile); and (3) obese (⬎95th percentile).
Analysis
We first analyzed the pooled sample across years (n⫽9220), using mul-tivariate logistic regression
analy-ses, to test how BMI status (predic-tor) impacts screening for nutrition, physical activity, and emotional dis-tress (outcome). On the basis of our
previous work on demographic fac-tors that are associated with screen-ing, we adjusted for age, race/ethnic-ity, income status, and gender in our
models.17–19We repeated this analysis
stratified by year to investigate whether the relationship between BMI status and screening by topic differed
within each year. We then used2
test-ing to determine whether differences in screening by year were statistically significant in an exploratory bivariate
analysis. Estimates were weighted to represent California population totals in Stata (StataCorp, College Station, TX) using the SVY procedure to
acmodate replicate weights and the com-plex sample design.20 For our pooled
sample, we assume similar sampling and weighting procedures.
RESULTS
Sample Characteristics
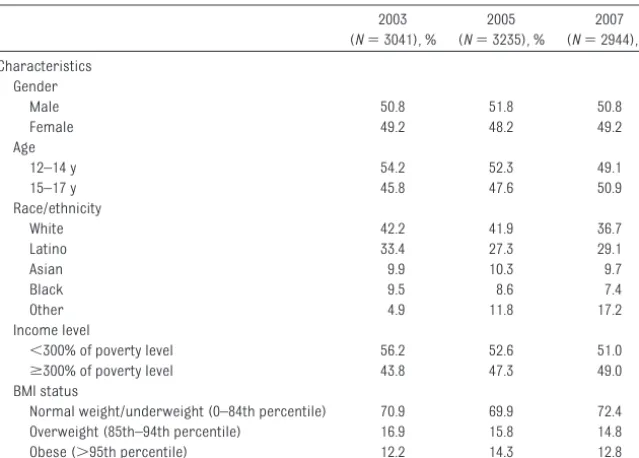
Table 1 presents the sample charac-teristics for each year of the survey. There were no statistically significant differences across years for gender, age, or BMI status. However, there was a statistically significant increase in adolescents in the “other” race/ethnic-ity category from 4.9% to 17.2% and income level higher than 300% poverty status from 43.8% to 49%.
Screening by BMI Status (Pooled Sample)
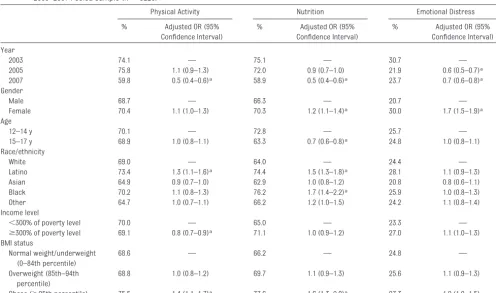
Table 2 presents multivariate logistic regression models that predict the odds of screening for each topic in a pooled sample with data from all 3 years. In these models, our main pre-dictor is BMI status, controlling for year and known demographic factors. Obese (compared with normal-weight) adolescents were more likely to report screening for physical activity (odds ratio [OR]: 1.4;P⬍.01) and nutrition (OR: 1.6; P ⬍ .01) but not emotional distress. Overweight adolescents were not more likely to receive screening in any area. Certain demographic groups, such as girls, younger adolescents, blacks, and Latinos, were more likely to be screened, although this was not con-sistent across screening topic.
Screening by BMI Status (Stratified According to Year)
Table 3 presents the results of screen-ing by BMI status stratified by year. Obese versus normal-weight adoles-cents were more likely to be screened for nutrition and physical activity in 2003 and 2005 but not 2007. Obese ver-sus normal-weight adolescents were more likely to be screened for emo-tional distress in 2005 only. Overweight adolescents were not more likely than normal-weight adolescents to be screened for any topic in any year. TABLE 1 Sample Characteristics Among Adolescents Aged 12 to 17 Years Who Had a Checkup in
the Past 12 Months, 2003–2007
2003 (N⫽3041), %
2005 (N⫽3235), %
2007 (N⫽2944), % Characteristics
Gender
Male 50.8 51.8 50.8
Female 49.2 48.2 49.2
Age
12–14 y 54.2 52.3 49.1
15–17 y 45.8 47.6 50.9
Race/ethnicity
White 42.2 41.9 36.7
Latino 33.4 27.3 29.1
Asian 9.9 10.3 9.7
Black 9.5 8.6 7.4
Other 4.9 11.8 17.2
Income level
⬍300% of poverty level 56.2 52.6 51.0
ⱖ300% of poverty level 43.8 47.3 49.0 BMI status
Normal weight/underweight (0–84th percentile) 70.9 69.9 72.4 Overweight (85th–94th percentile) 16.9 15.8 14.8 Obese (⬎95th percentile) 12.2 14.3 12.8
Preventive Screening by Year
Fig 1 shows a bivariate comparison of screening by topic and year. Provider screening was higher in 2003 than 2007 for physical activity (74% vs 60%;
P⬍.01), nutrition (75% vs 59%;P⬍
.01), and emotional distress (31% vs
24%;P⬍.01). However, overall screen-ing for emotional distress was quite
low, at less than one-half the rate of the
other 2 topics. Differences in screen-ing between 2003 and 2005 were only
seen for emotional distress (31% vs
22%;P⬍.01) and were not significant for nutrition and physical activity.
Pairedttests of nutrition and physical activity with emotional distress indi-cate that the proportion screened for
Physical Activity Nutrition Emotional Distress % Adjusted OR (95%
Confidence Interval)
% Adjusted OR (95% Confidence Interval)
% Adjusted OR (95% Confidence Interval) Year
2003 74.1 — 75.1 — 30.7 —
2005 75.8 1.1 (0.9–1.3) 72.0 0.9 (0.7–1.0) 21.9 0.6 (0.5–0.7)a
2007 59.8 0.5 (0.4–0.6)a 58.9 0.5 (0.4–0.6)a 23.7 0.7 (0.6–0.8)a
Gender
Male 68.7 — 66.3 — 20.7 —
Female 70.4 1.1 (1.0–1.3) 70.3 1.2 (1.1–1.4)a 30.0 1.7 (1.5–1.9)a
Age
12–14 y 70.1 — 72.8 — 25.7 —
15–17 y 68.9 1.0 (0.8–1.1) 63.3 0.7 (0.6–0.8)a 24.8 1.0 (0.8–1.1)
Race/ethnicity
White 69.0 — 64.0 — 24.4 —
Latino 73.4 1.3 (1.1–1.6)a 74.4 1.5 (1.3–1.8)a 28.1 1.1 (0.9–1.3)
Asian 64.9 0.9 (0.7–1.0) 62.9 1.0 (0.8–1.2) 20.8 0.8 (0.6–1.1) Black 70.2 1.1 (0.8–1.3) 76.2 1.7 (1.4–2.2)a 25.9 1.0 (0.8–1.3)
Other 64.7 1.0 (0.7–1.1) 66.2 1.2 (1.0–1.5) 24.2 1.1 (0.8–1.4) Income level
⬍300% of poverty level 70.0 — 65.0 — 23.3 —
ⱖ300% of poverty level 69.1 0.8 (0.7–0.9)a 71.1 1.0 (0.9–1.2) 27.0 1.1 (1.0–1.3)
BMI status
Normal weight/underweight (0–84th percentile)
68.6 — 66.2 — 24.8 —
Overweight (85th–94th percentile)
68.8 1.0 (0.8–1.2) 69.7 1.1 (0.9–1.3) 25.6 1.1 (0.9–1.3)
Obese (⬎95th percentile) 75.5 1.4 (1.1–1.7)a 77.6 1.6 (1.3–2.0)a 27.3 1.2 (1.0–1.5) Reference groups for statistically significant change are year 2003, male gender, age 12 to 14 years, white race, and normal weight/underweight.
aP⬍.01.
TABLE 3 Multivariate Logistic Regression Analysis Predicting Preventive Visit Screening Among Adolescents With a Checkup in the Last 12 Months by BMI Status (Normal, Overweight, and Obese) Stratified According to Year, 2003–2007 (N⫽9220)
BMI Status Physical Activity Nutrition Emotional Distress 2003
(N⫽3041)
2005 (N⫽3235)
2007 (N⫽2944)
2003 (N⫽3041)
2005 (N⫽3235)
2007 (N⫽2944)
2003 (N⫽3041)
2005 (N⫽3235)
2007 (N⫽2944) Normal weight/underweight
(⬍85th percentile), %
72.8 75.5 58.7 73.2 68.7 58.1 31.1 20.7 23.1
Adjusted OR (95% confidence interval)
— — — — — — — — —
Overweight (85th–94th percentile), %
74.4 70.7 61.3 75.9 73.8 59.5 30.0 20.4 26.5
Adjusted OR (95% confidence interval)
1.1(0.8–1.5) 0.8 (0.6–1.1) 1.1 (0.8–1.4) 1 (0.8–1.4) 1.3 (0.9–1.8) 1 (0.8–1.4) 1.0 (0.7–1.2) 1 (0.7–1.4) 1.2 (0.9–1.7)
Obese (⬎95th percentile), % 80.6 82.2 64.0 84.5 86.2 62.9 29.1 29.4 23.6 Adjusted OR (95%
confidence interval)
1.7 (1.1–2.5)a 1.5 (1.1–2.1)a 1.1 (0.8–1.5) 1.8 (1.2–2.6)b 2.7 (1.8–4.1)b 1.1 (0.8–1.5) 1.0 (0.7–1.4) 1.7 (1.1–2.4)b 1 (0.7–1.5)
Multivariate logistic regression adjusting for age, gender, income status, and race/ethnicity. The reference group is normal weight/underweight.
nutrition and physical activity versus emotional distress was significantly different (P⬍.001).
Table 2 shows that in a multivariate model controlling for known factors that contribute to screening, the OR for screening in 2007 for physical activity (OR: 0.5;P⬍.01), nutrition (OR: 0.5;P⬍
.01), and emotional distress (OR: 0.7;
P ⬍ .01) are significantly different from that in 2003. For emotional dis-tress, there is the same result in the multivariate (versus bivariate) com-parisons, that the odds of screening also is lower in 2005 than in 2003 (OR: 0.6;P⬍.01). This is not seen for phys-ical activity and nutrition.
DISCUSSION
Increased Screening for Obese, but Not Overweight, Adolescents
Our results show that obese adoles-cents report higher screening than normal-weight respondents (2003– 2005). This supports previous work that shows that obese adolescents are more likely to be screened.3–6By 2007,
the increased odds of nutrition and physical activity screening for obese adolescents was still present but
less dramatic and no longer signifi-cantly different. These results are strengthened by the fact that we con-trolled for demographic factors known from previous work to be as-sociated with higher screening rates, such as younger age, female gender, Latino ethnicity, and black race. The higher odds of screening seen in female subjects for emo-tional distress and Latinos/black subjects for nutrition and physical activity also is consistent with previ-ous findings.17,18
The change by 2007 is important given that this was the year that the new recommendations were re-leased.2 Furthermore, overweight
adolescents do not experience sig-nificantly higher screening during any survey year despite the evidence that they are the group most amena-ble to early and brief interventions. In 2007, the BMI category name was changed from “at risk for over-weight” to “overweight.” It will be use-ful to see how screening for this group compares in future years and if there is any impact of this change in terminology on provider screening.
There are several possible explana-tions for why overweight adolescents in particular do not experience higher screening levels. First, providers face barriers to screening, such as doubt that screening is effective, shorter visit times, and low reimburse-ment.3,4,6,21 Many pediatricians also
lack local resources in pediatric weight management to which they can refer patients, further reducing their inclination to address this issue in their practice. Studies also show that providers may rely on visual inspec-tion for identifying obese patients ver-sus measuring the BMI directly. Sub-jective identification ranges from 20% to 50%, whereas rates of calculating BMI are much lower, ranging from 0.5% to 19%.8–12 Overweight patients
would be less likely to be identified by inspection alone. And finally, pediatri-cians should be screening all adoles-cents regardless of BMI, so inspection should not be initiating screening.
Missed Opportunity for Screening for Emotional Distress
In our study, overall screening for emotional distress is low and not
con-FIGURE 1
Preventive screening from 2003 to 2007 for physical activity, nutrition, and emotional distress among adolescents aged 12 to 17 years. Shown are differences in screening prevalence for 2005 and 2007 compared with 2003 using2testing.aP⬍.01.
have a higher prevalence of depres-sion and stigma.22Previous studies
re-port that adolescents entering treat-ment for obesity have significant depressive symptoms.23Children with
significant depression also are more likely to engage in unhealthy dieting practices and less likely to be able to adopt improved diet and exercise.24
Al-though the low overall rate of screen-ing among all adolescents has been found in previous research,17 this
study provides the first look into the lack of attention paid by pediatricians to this issue in overweight or obese teens. Previous studies have con-cluded that the lower rate of screening among teenagers likely relates to the lack of available referral resources and provider confidence and training in this area.
A Decline in Preventive Screening Overall
Our preliminary analysis of values over the 3 years reveals a decline in screen-ing from 2003 to 2007 for physical ac-tivity, nutrition, and emotional dis-tress. Although there are no comparable data on screening over time in adolescents, these results are consistent with the findings of McAlp-ine et al,21using the National
Ambula-tory Medical Care Survey data in adults. Their data show that screening for diet and physical activity declined between 1995–1996 and 2003–2004 but that screening was higher in pa-tients who had an obesity diagnosis.
There are several possible explana-tions for why provider screening de-clined between 2003 and 2007. One possibility is that the overall insurance status, payer mix, or the frequency with which adolescents received pre-ventive health care visits changed over time. The addition of more immuniza-tion requirements between 2003 and
contributed to providers feeling over-burdened and short on time. Also, dur-ing this time California was rapidly in-creasing its enrollment in Medicaid through the Children’s Health Insur-ance Program, increasing the number of adolescents with insurance and ac-cess to primary care visits, thereby in-creasing patient load. All these factors may contribute to lower provider screening.
Limitations
Our study is limited by our reliance on self-reported weight and height. Several studies25–27 have shown that
self-reported weight may be underes-timated in girls and height overesti-mated in boys, but these differences are modest. We cannot comment on the specific content of the nutrition and physical activity screening be-cause this was beyond the scope of the survey. Also, given that these are cross-sectional data, we only are able to look at overall screening preva-lence. We cannot comment on the im-pact of this screening on individual ad-olescent behavior because this would require longitudinal data. Our data also come from a state-specific sam-ple and may not be generalizable to the entire United States. However, the CHIS is the largest state population-based survey in the United States and in-cludes a broad range of ethnic and ra-cial diversity. We also are limited by being able to take into account only factors that have been measured in the CHIS; other factors that might influ-ence screening, such as provider dis-cipline, could not be considered. Al-though there were no known changes in CHIS methodology or measures to explain the changes in screening by year, these analyses will be strength-ened by the availability of future years of data.
this report could be influenced by re-spondent recall, adolescent self-report measures are considered a valid source of data about the previ-sion of preventive screening and have been incorporated into the develop-ment of quality measures.28Our overall
screening level is actually higher than those reported using physician- and parent-report data and is consistent with other studies using adolescent self-report.12,29
CONCLUSIONS
Given the recent release of the Expert Committee recommendations and the US Preventives Services Task Force re-port, these data have several impor-tant clinical and policy implications. Provider education on the importance of focusing attention on the over-weight group is needed, as well as re-search around understanding the bar-riers for counseling this group. Strategies also are needed to train providers in mental health screening and referrals and to provide a link to these services and weight manage-ment. Finally, even with universal un-derstanding of the recommendations by providers, adherence will remain hindered by reimbursement. Until we can provide pediatricians with the tools, reimbursement, and time to intervene in pediatric obesity, primary care remains a missed opportunity in the prevention of obesity.
ACKNOWLEDGMENTS
Depart-ment of Psychiatry; the National Insti-tute of Nursing Research (grant NR009397); the National Center for Re-search Resources, National Institutes
of Health; and the University of Califor-nia San Francisco Clinical and Techni-cal Science Institute (grant UL1 RR024131).
We thank E. Richard Brown, CHIS Principal Investigator, and David Grant, CHIS Direc-tor, for ensuring that the CHIS public-use data files are available to all researchers.
REFERENCES
1. Barton M; US Preventive Services Task Force. Screening for obesity in children and adolescents: US preventive services task force recommendation statement. Pe-diatrics. 2010;125(2):361–367
2. Barlow SE. Expert committee recommenda-tions regarding the prevention, assess-ment, and treatment of child and adoles-cent overweight and obesity: summary report. Pediatrics. 2007;120(suppl 4): S164 –S192
3. Ma J, Xiao L. Assessment of body mass in-dex and association with adolescent pre-ventive care in U.S. outpatient settings.J Adolesc Health. 2009;44(5):502–504 4. Voelker R. Improved use of BMI needed to
screen children for overweight.JAMA. 2007; 297(24):2684 –2685
5. Sesselberg TS, Klein JD, O’Connor KG, John-son MS. Screening and counseling for child-hood obesity: results from a national sur-vey. J Am Board Fam Med. 2010;23(3): 334 –342
6. Klein JD, Sesselberg TS, Johnson MS, et al. Adoption of body mass index guidelines for screening and counseling in pediatric prac-tice.Pediatrics. 2010;125(2):265–272 7. Kant AK, Miner P. Physician advice about
be-ing overweight: association with self-reported weight loss, dietary, and physical activity behaviors of US adolescents in the National Health and Nutrition Examination Survey, 1999 –2002.Pediatrics. 2007;119(1). Available at: www.pediatrics.org/cgi/content/ full/119/1/e142
8. Halpern-Felsher BL, Ozer EM, Millstein SG, et al. Preventive services in a health mainte-nance organization: how well do pediatri-cians screen and educate adolescent pa-tients? Arch Pediatr Adolesc Med. 2000; 154(2):173–179
9. O’Brien SH, Holubkov R, Reis EC. Identifica-tion, evaluaIdentifica-tion, and management of obe-sity in an academic primary care center.
Pediatrics. 2004;114(2). Available at: www. pediatrics.org/cgi/content/full/114/2/e154 10. Dorsey KB, Wells C, Krumholz HM, Concato
JC. Diagnosis, evaluation, and treatment of childhood obesity in pediatric practice.
Arch Pediatr Adolesc Med. 2005;159(7): 632– 638
11. Dilley KJ, Martin LA, Sullivan C, Seshadri R, Binns HJ. Identification of overweight status is associated with higher rates of screening for comorbidities of overweight in pediatric primary care practice. Pediatrics. 2007; 119(1). Available at: www.pediatrics.org/ cgi/content/full/119/1/e148
12. Barlow SE, Dietz WH, Klish WJ, Trowbridge FL. Medical evaluation of overweight chil-dren and adolescents: reports from pedia-tricians, pediatric nurse practitioners, and registered dietitians.Pediatrics. 2002;110(1 pt 2):222–228
13. Ma J, Urizar GG Jr, Alehegn T, Stafford RS. Diet and physical activity counseling during ambulatory care visits in the United States.
Prev Med. 2004;39(4):815– 822
14. Ma J, Wang Y, Stafford RS. U. S. adolescents receive suboptimal preventive counseling during ambulatory care.J Adolesc Health. 2005;36(5):441
15. Eneli IU, Keast DR, Rappley MD, Camargo CA Jr. Adequacy of two ambulatory care sur-veillance systems for tracking childhood obesity practice patterns.Public Health. 2008;122(7):700 –707
16. Cervantes IF, Brick JM.CHIS 2005 Methodol-ogy Series: Report 1: Sample Design. Los Angeles, CA: University of California Los An-geles Center for Health Policy Research; 2007
17. Ozer EM, Zahnd EG, Adams SH, et al. Are ad-olescents being screened for emotional dis-tress in primary care? J Adolesc Health. 2009;44(6):520 –527
18. Adams SH, Husting S, Zahnd E, Ozer EM. Ad-olescent preventive services: rates and dis-parities in preventive health topics covered during routine medical care in a California sample. J Adolesc Health. 2009;44(6): 536 –545
19. Ozer E. Are adolescents being screened for depression in primary care?Society for
Ad-olescent Medicine Annual Meeting.Denver, CO, March 28 –31, 2007
20. Stata Base Reference Manual.College Sta-tion, TX: Stata Press; 2005
21. McAlpine DD, Wilson AR. Trends in obesity-related counseling in primary care: 1995–2004.Med Care. 2007;45(4):322–329 22. Neumark-Sztainer D, Falkner N, Story M,
Perry C, Hannan PJ, Mulert S. Weight-teasing among adolescents: correlations with weight status and disordered eating behaviors.Int J Obes Relat Metab Disord. 2002;26(1):123–131
23. Zeller MH, Modi AC. Predictors of health-related quality of life in obese youth. Obe-sity. 2006;14(1):122–130
24. Fulkerson JA, Sherwood NE, Perry CL, Neumark-Sztainer D, Story M. Depressive symptoms and adolescent eating and health behaviors: a multifaceted view in a population-based sample.Prev Med. 2004; 38(6):865– 875
25. Klein JD, Postle CK, Kreipe RE, et al. Do phy-sicians discuss needed diet and nutrition health topics with adolescents?J Adolesc Health. 2006;38(5):608e601– 606e601 26. Brener ND, McManus T, Galuska DA, Lowry R,
Wechsler H. Reliability and validity of self-reported height and weight among high school students. J Adolesc Health. 2003; 32(4):281–287
27. Lee K, Valeria B, Kochman C, Lenders CM. Self-assessment of height, weight, and sex-ual maturation: validity in overweight chil-dren and adolescents. J Adolesc Health. 2006;39(3):346 –352
28. Bethell C, Klein J, Peck C. Assessing health system provision of adolescent preventive services: the Young Adult Health Care Sur-vey.Med Care. 2001;39(5):478 – 490 29. Irwin CE Jr, Adams SH, Park MJ, Newacheck
PW. Preventive care for adolescents: few get visits and fewer get services.Pediatrics. 2009;123(4). Available at: www.pediatrics. org/cgi/content/full/123/4/e565
DOI: 10.1542/peds.2010-2559 originally published online July 18, 2011;
2011;128;e317
Pediatrics
Services
Updated Information &
http://pediatrics.aappublications.org/content/128/2/e317
including high resolution figures, can be found at:
References
http://pediatrics.aappublications.org/content/128/2/e317#BIBL
This article cites 22 articles, 5 of which you can access for free at:
Subspecialty Collections
icine_sub
http://www.aappublications.org/cgi/collection/adolescent_health:med Adolescent Health/Medicine
following collection(s):
This article, along with others on similar topics, appears in the
Permissions & Licensing
http://www.aappublications.org/site/misc/Permissions.xhtml
in its entirety can be found online at:
Information about reproducing this article in parts (figures, tables) or
Reprints
http://www.aappublications.org/site/misc/reprints.xhtml
DOI: 10.1542/peds.2010-2559 originally published online July 18, 2011;
2011;128;e317
Pediatrics
Carolyn Bradner Jasik, Sally H. Adams, Charles E. Irwin, Jr and Elizabeth Ozer
The Association of BMI Status With Adolescent Preventive Screening
http://pediatrics.aappublications.org/content/128/2/e317
located on the World Wide Web at:
The online version of this article, along with updated information and services, is
by the American Academy of Pediatrics. All rights reserved. Print ISSN: 1073-0397.