Original Research Article
Lifestyle associated morbidity among geriatric population–
urban and rural comparison
Nipun Agrawal
1, Danish Imtiaz
2, Atul K. Singh
1*, Shyam B. Gupta
1, Abhishek Jain
1INTRODUCTION
The proportion of people aged over 60 years is growing faster than any other age group in almost every country which can be attributed to longer life expectancy, declining birth rates, expansion of healthcare services in quality and quantity. Population ageing not only tells a success story of public health policies and of
socioeconomic development, but also poses challenges on the society to adapt, in order to maximize the health and functional capacity of older people as well as their social participation and security.1
The term “Lifestyle” was originally used by Austrian psychologist Alfred Adler (1870-1937). It is used to denote “the way people live”, reflecting a whole range of ABSTRACT
Background: The proportion of people aged over 60 years is growing faster than any other age group in almost every country which can be attributed to longer life expectancy, declining birth rates, expansion of healthcare services in quality and quantity. An individual’s choice of behaviour may be either health promoting or detrimental to health. Health is both a consequence of an individual’s lifestyle and a factor determining it but it cannot be isolated from other aspects of life. With the above background, this study was planned to report and compare lifestyle and prevalence of lifestyle associated morbidities among geriatric population of rural and urban areas in district Bareilly (UP).
Methods: The present descriptive cross sectional study was conducted over a period of one year amongst families registered with UHTC and RHTC of SRMS IMS, Bareilly. All persons willing to participate aged 60 years or more were interviewed in the presence of one family member.
Results: A total of 525 elderly, 263 rural and 262 urban, were surveyed. The mean age of elderly residing in the rural and urban areas are 66.21±5.97 and 67.30±5.89 respectively, eldest being 96 years old rural subject. Lifestyle of rural elderlies was healthier compared to urban subjects. 12.5% rural elderly had no apparent disease against only 7.5% urban elderly.
Conclusions: Overall consumption of salt and oil consumed per person per day was found to be higher amongst the elderly residing in the urban area as compared to those in the rural area. Most of the elderly of rural area (77.57%) as well as urban area (59.92%) fall in Zone–1 i.e. with an audit score below 7. Proportion of current tobacco users and ever tobacco users were higher in the rural area (40.68% and 46.76% respectively). The proportion of subjects who were apparently healthy was higher in rural area (46.77%) than urban area (39.69%).
Keywords: Lifestyle, Geriatric, Non-communicable diseases, Lifestyle diseases, Rural-urban comparision, WHO steps instrument
Department of Community Medicine, 1Shri Ram Murti Smarak Institute of Medical Sciences, Bareilly, Uttar Pradesh,
2ANM Medical College, Gaya, Bihar, India
Received: 19 May 2018
Accepted: 27 June 2018
*Correspondence:
Dr. Atul K. Singh,
E-mail: [email protected]
Copyright: © the author(s), publisher and licensee Medip Academy. This is an open-access article distributed under the terms of the Creative Commons Attribution Non-Commercial License, which permits unrestricted non-commercial use, distribution, and reproduction in any medium, provided the original work is properly cited.
social values, attitudes and activities. It is composed of cultural and behaviour patterns and lifelong personal habits (smoking, alcoholism, etc.) that have developed through processes of socialisation. Lifestyles are learnt through social interactions with parents, peer groups, friends and siblings and through school and mass media.2,3
An individual’s choice of behaviour may be either health promoting or detrimental to health. While an individual may change a specific type of behaviour, it is less easy to change his or her reference group, and its influence always remains very important. Health is both a consequence of an individual’s lifestyle and a factor determining it but it cannot be isolated from other aspects of life.4
In terms of attributable deaths, the leading behavioural and physiological risk factors globally are raised blood pressure (to which 13% of global deaths are attributed), followed by tobacco use (9%), raised blood glucose (6%), physical inactivity (6%) and being overweight or obese (5%).5
Objective
With the above background, this study was planned to report and compare lifestyle and prevalence of lifestyle associated morbidities among geriatric population of rural and urban areas in district Bareilly (UP).
METHODS
The present descriptive cross sectional study was conducted over a period of one year i.e. from 1st May 2013 to 30th April 2014 amongst families registered with the Urban Health Training Centre (UHTC), Rampur Garden, Bareilly and the Rural Health Training Centre (RHTC), Dhaura-Tanda, Bareilly, to find out the morbidity associated with lifestyle among geriatric population.
All persons willing to participate aged 60 years or more as on 1st May 2013 of either sex who were permanent resident of the household for atleast past one year, belonging to the families residing in the field practice areas of UHTC and RHTC were included in the study.
The prevalence of diabetes amongst elderly aged 60 years or more was found to be 18.8% in a study conducted by Singh et al.10 Based on these figures taking an allowable error of 5%, a sample size of 258 was calculated applying the standard formula and 260 elderlies each, were surveyed from both rural as well as urban areas making a total sample size of 520.
An instrument for the survey was developed after reviewing the available literature comprising of three sections collecting general demographic information about the study subjects which included name, age,
gender, religion, marital status, educational status, work status over past 12 months, number of persons living permanently in their household, standard of living index (SLI) for socio-economic status, lifestyle information including dietary habits, physical activity, tobacco and alcohol consumption and information regarding morbidities present in the elderly subjects.
A pilot study was conducted initially on 50 subjects at UHTC, Rampur Garden, Bareilly to see the feasibility of the study and for validation of the study tool. Difficulties in data collection and ambiguities in the questionnaire were resolved and modifications were done in the study instrument as indicated by the pilot study.
The urban and rural areas was selected randomly from the areas served by urban and rural health training centre under Department of Community Medicine, SRMS IMS using lottery method. Complete household-wise lists of inhabitants of the area were generated and all the elderly aged 60 years and above meeting the inclusion criteria and not falling in exclusion criteria were surveyed till the desired sample size was achieved. House to house visits were made and face-to-face interview in the presence of one family member, preferably care-taker of the elderly or close relative was conducted.
Data were entered using Microsoft Excel 2010 and statistical analysis was done using IBM SPSS v 20.0.0. Categorical variables were analysed using proportions and percentages. Association between categorical variables was established by Chi square and odds ratio (OR) with 95% confidence intervals (CI) where applicable. Continuous variables were summarized by mean and standard deviation (SD), and association tested by parametric tests.
RESULTS
A cross sectional study entitled “Lifestyle associated morbidity among geriatric population–urban and rural comparison” is conducted in the rural and urban areas of district Bareilly including a total of 525 elderly. The observations are as follows:
Table 1 shows the distribution of elderly according to the area surveyed. Equal number of elderly were interviewed from rural as well as urban area for the purpose of comparison.
Table 2 shows that majority (84%) of the geriatric subjects are in the age group 60–70 years followed by 71–80 years (13.33%). Proportion of elderly in higher age groups is significantly lower. The eldest geriatric subject is 96 years old female from Miyanpur village. The mean age of elderly residing in the rural and urban areas are 66.21±5.97 and 67.30±5.89 respectively. On applying student’s t-test, the p-value obtained is 0.0357 (t=2.1057, df=523, standard error of difference=0.518).
Table 1: Distribution of study subjects according to place of living.
Area Name of village/
Urban area Population Elderly
Families visited
Elderly interviewed
Rural
Miyanpur 992 58 32 46
Ishapur 2364 163 106 147
Parsunagla 1226 80 49 70
Total 186 263
Urban Faltoonganj 5495 308 191 262
Total 191 262
Table 2: Distribution of study subjects according to age and gender.
Age Rural Urban
Female Male Total Percentage (%) Female Male Total Percentage (%)
60-70 112 116 228 86.7 117 96 213 81.3
71-80 11 16 27 10.3 24 19 43 16.4
81+ 6 2 8 3.0 4 2 6 2.3
Total 129 134 263 100.0 145 117 262 100.0
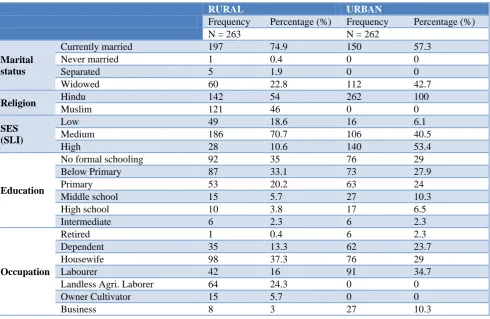
Table 3: Distribution of study subjects according to socio-demographic characters.
RURAL URBAN
Frequency Percentage (%) Frequency Percentage (%)
N = 263 N = 262
Marital status
Currently married 197 74.9 150 57.3
Never married 1 0.4 0 0
Separated 5 1.9 0 0
Widowed 60 22.8 112 42.7
Religion Hindu 142 54 262 100
Muslim 121 46 0 0
SES (SLI)
Low 49 18.6 16 6.1
Medium 186 70.7 106 40.5
High 28 10.6 140 53.4
Education
No formal schooling 92 35 76 29
Below Primary 87 33.1 73 27.9
Primary 53 20.2 63 24
Middle school 15 5.7 27 10.3
High school 10 3.8 17 6.5
Intermediate 6 2.3 6 2.3
Occupation
Retired 1 0.4 6 2.3
Dependent 35 13.3 62 23.7
Housewife 98 37.3 76 29
Labourer 42 16 91 34.7
Landless Agri. Laborer 64 24.3 0 0
Owner Cultivator 15 5.7 0 0
Business 8 3 27 10.3
Table 3 shows socio-demographic characters of the study population. Proportion of subjects married and living with their spouse in the rural area (74.9%) is higher than Urban area (57.3%). Proportion of those geriatric subjects who had lost their spouse, in the urban area (42.7%) is much higher than the rural area (22.8%). The religion of approximately half of the study subjects was Hindu in rural area while in urban area all the subjects belonged to
schooling (32%) and the proportion decreased as the educational level increased. Occupation of majority of subjects in the rural area was housewives followed by
landless agricultural labourers, other labourers and others whereas in the urban area it was other labourers followed by housewives, dependents and businessmen.
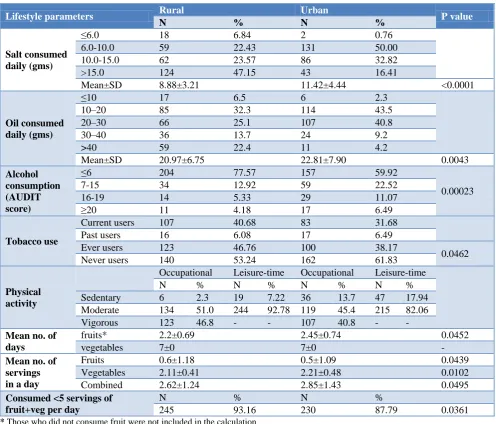
Table 4: Distribution of study subjects based on lifestyle parameters.
Lifestyle parameters Rural Urban P value
N % N %
Salt consumed daily (gms)
≤6.0 18 6.84 2 0.76
6.0-10.0 59 22.43 131 50.00
10.0-15.0 62 23.57 86 32.82
>15.0 124 47.15 43 16.41
Mean±SD 8.88±3.21 11.42±4.44 <0.0001
Oil consumed daily (gms)
≤10 17 6.5 6 2.3
10–20 85 32.3 114 43.5
20–30 66 25.1 107 40.8
30–40 36 13.7 24 9.2
>40 59 22.4 11 4.2
Mean±SD 20.97±6.75 22.81±7.90 0.0043
Alcohol consumption (AUDIT score)
≤6 204 77.57 157 59.92
0.00023
7-15 34 12.92 59 22.52
16-19 14 5.33 29 11.07
≥20 11 4.18 17 6.49
Tobacco use
Current users 107 40.68 83 31.68
Past users 16 6.08 17 6.49
Ever users 123 46.76 100 38.17
0.0462 Never users 140 53.24 162 61.83
Physical activity
Occupational Leisure-time Occupational Leisure-time
N % N % N % N %
Sedentary 6 2.3 19 7.22 36 13.7 47 17.94 Moderate 134 51.0 244 92.78 119 45.4 215 82.06 Vigorous 123 46.8 - - 107 40.8 - -
Mean no. of days
fruits* 2.2±0.69 2.45±0.74 0.0452
vegetables 7±0 7±0 -
Mean no. of servings in a day
Fruits 0.6±1.18 0.5±1.09 0.0439
Vegetables 2.11±0.41 2.21±0.48 0.0102
Combined 2.62±1.24 2.85±1.43 0.0495
Consumed <5 servings of fruit+veg per day
N % N %
245 93.16 230 87.79 0.0361
* Those who did not consume fruit were not included in the calculation
Table 5: Distribution of study subjects according to Morbidities present.
Morbidity* Rural Urban
Frequency Percentage (%) Frequency Percentage (%)
Obesity 77 29.28 84 32.06
Hypertension 97 36.88 113 43.13
Diabetes mellitus 63 23.95 72 27.48
Arthritis 65 24.71 76 29.01
COPD 34 12.93 40 15.27
GERD 44 16.73 58 22.14
IBS 8 3.04 11 4.20
No Apparent Disease 33 12.55 20 7.63
*Multiple responses
Table 4 compares lifestyle parameters amongst rural and urban subjects. It is evident that consumption of salt per person per day is higher amongst those residing in the urban area (11.42±4.44) as compared to those residing in the rural area (8.88±3.21) and the average amount of oil consumed per person per day is also higher in the Urban area (22.81±7.90) than the rural area (20.97±6.75). The significance of difference in means of the two populations statistically significant.
Most of the elderly of Rural area (77.57%) as well as Urban area (59.92%) fall in Zone –1 with an AUDIT score below 7. Proportion of the study subjects decreased as the AUDIT score increased. Proportion of current users of tobacco and those who have ever used tobacco is higher in the rural area (40.68% and 46.76% respectively) as compared to the Urban area (31.68% and 38.17% respectively). Proportion of those elderly who used to smoke but have quit smoking and those who never smoked at all is higher in the urban area (6.49% and 61.83% respectively) as compared to the rural area (6.08% and 53.24% respectively).
The proportion of elderly involved in sedentary occupational physical activity is higher in the urban area (13.7%) than the rural area (2.3%). The proportions of elderly involved in occupation with moderate as well as vigorous physical activity are higher in the rural area (51.0% and 46.8% respectively) as compared to the urban area (45.4% and 40.8% respectively). The proportion of elderly involved in sedentary leisure-time physical activity is higher in the urban area (17.94%) than the rural area (7.22%). The proportions of elderly involved in leisure-time activity with moderate physical activity are higher in the rural area (92.78%) as compared to the urban area (82.06%).
Number of days fruits were consumed were higher in urban area (2.45±0.74) as compared to rural area (2.2±0.69) whereas the number of servings consumed on a given day were higher in rural area (0.6±1.18) as compared to urban area (0.5±1.09). Those who were consuming adequate amount of fruits and vegetables i.e. more than five combined servings of both, were higher in urban area (12.21%) as compared to rural area (6.84%).
Table 5 demonstrates the prevalence of non-communicable diseases in the elderly population of the areas surveyed. It is evident that prevalence of all the lifestyle associated morbidities was higher among urban subjects and obesity, hypertension and diabetes were the commonest morbidities encountered in both the areas.
DISCUSSION
A community based cross sectional study entitled “Lifestyle associated morbidity among geriatric population–urban and rural comparison” was conducted in the rural and urban areas of district Bareilly including a total of 525 elderly.
In the present study, the total subjects surveyed are 263 from Rural and 262 from urban area. Out of these 129 (49.05%) were females and 134 (50.95%) were males in the rural area whereas 145 (55.34%) were females and 117 (44.66%) were males in the urban area. It is in accordance with the WHO Multi-centric study done to establish epidemiological data on health problems in elderly in which rural area had females and males proportions of 55.6% and 44.4% respectively and urban area had females and males proportions of 51.3% and 48.7% respectively.11
The overall mean age in males and females was 67.11±5.35 and 66.38±6.4 years respectively with combined average of 66.76±5.92 years. The mean age of rural population was 66.21±5.97 years, and that of urban population was 67.30±5.89 years. Among the population studied, the oldest geriatric subject was 96 years old female from Miyanpur village. This too was similar to the WHO Multicentric study in elderly in which also mean age of males was found to be greater than mean age of females.11 Of the total population surveyed, 84% were in 60-70 years of age group followed by 13.33% in 71-80 years of age group while the remaining 2.67% were above 80 years of age. The trend was similar to that found in the WHO Multicentric study in elderly and study by Khokhar et al.8,11
Marital status shows that the highest proportion of subjects in the rural area (74.9%) and urban area (57.3%) are married and living with their spouse followed by widowed subjects (22.8% and 42.7% respectively). In the rural area, there was one subject who was unmarried and few subjects (1.9%) who were married but living separated from their spouse. No such subjects were encountered in the urban area. It was contrary to the findings of WHO Multi-centric study in elderly in which percentage of those currently married was higher in urban areas (72.7%) than in rural areas (68.2%). It is also similar to findings of Lena et al, Karnataka who reported 47.4% married and 43.7% widowed elderly subjects.9,11
Religion of maximum subjects was Hindu (76.95%) followed by Muslims (23.05%). In the rural area, majority of elderly (54%) belonged to the Hindu religion and the urban area comprised of Hindus only. It is similar to study done by Barua et al who also reported maximum elderly subjects as Hindus (80%).7
Bengaluru who reported highest proportion having High SLI followed by medium and low SLI.12,13
Educational status revealed that the highest proportion of study subjects had not received any formal schooling (32%) and the percentage decreased as the educational status increased with minimum percentage (2.29%) attaining education upto or above Intermediate. This trend was similar to that reported by Ajit et al, Bengaluru and Lena et al, Karnataka except that latter had lower percentage of elderly who had not received any formal schooling.9,13
Occupational status of highest proportion of study subjects were housewives or home-makers (33.14%) followed by labourers involved in work other than agriculture (25.33%), followed by dependents (18.48%), landless agricultural labourers (12.19%), businessmen (6.67%), owner cultivators (2.86%) and retired people (1.33%). This trend was similar to that reported by Ajit et al (2014), Bengaluru.13 In the rural area, the proportion of agricultural laborers is higher (24.3%Rural, 0.0%Urban)
whereas in urban area, the proportion of other laborers is higher (16.0%Rural, 34.7%Urban). The proportion of
dependents (13.3%Rural, 23.7%Urban) and businessmen
(3.0%Rural, 10.3%Urban) are higher in the urban area while
the proportion of housewives (37.3%Rural, 29.0%Urban) and
people involved in agriculture (31.0%Rural, 0.0%Urban) are
higher in the rural area.
Daily consumption of salt was found to be more in rural area as compared to urban area. In the rural area, most of the subjects (47.15%) consumed >15 gms salt per day while in the urban area salt consumption was in the range of 6–10gms per day by half of the subjects (50%). In the rural area, proportion of subjects increased as the amount of salt consumed daily increased while in the urban area proportion of subjects reduced as the amount of salt consumed daily increased. This was in accordance with National Institute of Nutrition which states that Indians consume 5-30 grams salt per day and 40% of the Indian population consume more than 10 gms per day.16
Daily consumption of oil was found to be higher in urban area (22.81±7.90) as compared to rural area (20.97±6.75). Highest proportion of elderly were found to be consuming oil in the range of 10-20gms/day in rural (43.5%) as well as urban (32.3%) areas followed by 20-30gms/day (40.8% and 25.1% respectively). The findings are comparable to the National Nutrition Monitoring Bureau’s Report on diet and nutritional status of elderly which states that elderly males consumed 13±14 gms and females consumed 11±16 gms oils per day. This was also in accordance with National Institute of Nutrition which says amongst elderly, daily intake of oil must not exceed 20 gms per day.16,17
In our study, World Health Organization’s Alcohol Use Disorder Identification Test (AUDIT) was used to assess harmful alcohol use in the study subjects. Majority of the
study subjects in rural as well as urban areas (77.57% and 59.92% respectively) had an AUDIT score below 7 indicating normal healthy consumption of alcohol. Proportion of the study subjects decreased as the AUDIT score increased. Medium level of alcohol problem or hazardous drinking was observed in 12.92% rural and 22.52% urban elderly. High level of alcohol problem or harmful drinking was seen in 5.33% rural and 11.07% urban elderly. Alcohol dependence was seen in 4.18% rural and 6.49% urban elderly. The above results are slightly inconsistent with those of Dhupdale et al, Goa, who reported heavy drinkers into hazardous (76.2%) harmful (14.3%) and alcohol dependents (9.5%) against the hazardous (56.19%) harmful (26.62%) and alcohol dependents (16.19%) found in the present study.19
In the present study, proportion of current users and ever users of tobacco is higher in rural area (40.68% and 46.76% respectively) as compared to urban area (31.68% and 38.17% respectively) while the proportion of those elderly who used to smoke but have quit smoking and those who never smoked at all is higher in urban area (6.49% and 61.83% respectively) as compared to rural area (6.08% and 53.24% respectively). The findings of the current study are inconsistent with those of Kokhar et al, Delhi who reported current users of smoked and smokeless tobacco use as 15.6% and 12.5% respectively, ex-users 5.5% and 4.7% respectively and non-users 78.9% and 82.2% respectively. In the WHO Multicentric study to establish epidemiological data on health problems in elderly 25.8% and 21.0% of elderly subject were tobacco users in the rural and urban areas respectively. The proportion of current smokers in rural population (19.7%) was higher than that of urban area (15.3%). According to Global Adult Tobacco Survey (GATS)–Fact Sheet India, in rural and urban areas, current tobacco users are 38.4% and 25.3% respectively, current users of smoked products are 15.1% and 11.2% respectively, current users of smokeless tobacco are 29.3% and 17.7% respectively and the mean age of initiation of tobacco use was 17.8 years.8,11,20
of Deepa M et al. (2011) who reported more than 50% and 35% of the urban and rural residents respectively had a sedentary lifestyle while 7.4% and 25.4% of the urban and rural residents respectively were involved in vigorous physical activity.14,18
In the present study, it was found that proportion of elderly not eating fruits at all is higher in the rural area (77.6%) as compared to the urban area (69.8%).
Deepa et al reported that proportion of subjects who never consumed fruits in the last week were 24% in urban and 41% in rural area.14 In a week, mean number of days people consuming fruits was 2.2 in rural and 2.45 in urban areas while vegetables were consumed on all the seven days in a week. Mean number of servings of fruits consumed per day were 0.6±1.18 and 0.5±1.09, of vegetables were 2.11±0.41 and 2.21±0.48 and of both combined were 2.62±1.24 and 2.85±1.43 in rural and urban areas respectively. Proportion of elderly consuming less than five combined servings of fruits and vegetables per day was 93.16% in rural and 87.79% in urban areas. The above findings are similar to non-communicable disease risk factor survey, Integrated Disease Surveillance Project (IDSP) carried out by National Institute of Medical Statistics, New Delhi, where in a week, mean number of days people consumed vegetables for about 4-7 days and fruits for about 2-3 days. Urban respondents were better in this regard than their rural counterparts. The mean number of servings consumed per day of fruits were 0.6 and 0.7, of vegetables were 1.5 and 1.7 and of both combined were 2.2 and 2.5 in rural and urban areas respectively. Proportion of people consuming less than five combined servings of fruits and vegetables per day was 89.1% in rural and 87.7% in urban areas.15
Amongst the lifestyle morbidities studied, prevalence of obesity in rural and urban areas respectively were found to be 29.28% and 32.06%. Prevalence of obesity in the current study was midway between those reported by Mahfouz et al, Egypt and Khanam et al, Bangladesh who reported prevalence of obesity to be 62% and 11% respectively.21,22 Prevalence of hypertension in rural and urban areas respectively was found to be 36.88% and 43.13% which was in accordance with the study of Prakash et al Udaipur, who reported it to be 48%.23 The prevalence of diabetes mellitus in rural and urban areas respectively were found to be 23.95% and 27.48% which was slightly more than study of Singh et al Delhi, who had reported diabetes among elderly to be 18.8%.10 Prevalence of arthritis in rural and urban areas respectively was found to be 24.71% and 29.01% which was similar to that of Srivastava et al, Agra, who reported it to be 22.2%.6 The prevalence of chronic obstructive pulmonary disease in rural and urban areas respectively were found to be 12.93% and 15.27% which was higher than as seen in the study by van Durme et al, Rotterdam, who reported 8.11%.24 Prevalence of gastroesophageal reflux disease in rural and urban areas respectively were found to be 16.73% and 22.14% which was in accordance
with that seen in the study by Kumar et al Bihar, who reported 16.4% elderly above 60 years had GERD.25 The prevalence of inflammatory bowel disease in rural and urban areas respectively were found to be 3.04% and 4.2%.
ACKNOWLEDGEMENTS
We wish to thank the Chairman, Shri Dev Murti Ji, Director Administrator Mr Aditiya Murti for providing excellent opportunities and support, Ex-Principal and Professor (Late) Dr Ved Prakash Shrotriya, SRMSIMS who offered his continuous advice and encouragement throughout the course of this study. I owe a great deal of appreciation and gratitude to Mr Mohd. Danish, Mr Mohd. Javed and Mr Shoaib Raza, MSW team for helping me to collect data from the urban area and the villages and providing information regarding whatever I needed to complete the study.
Funding: No funding sources Conflict of interest: None declared
Ethical approval: The study was approved by the Institutional Ethics Committee
REFERENCES
1. WHO, Health topics, Ageing. Available at: http://www.who.int/topics/ageing/en/. Accessed on 12 April 2013.
2. The Online Etymology Dictionary. Available at: http://www.etymonline.com/index.php?search=lifest yle. Accessed on 30 May 2013.
3. Park K. Park’s Textbook of Preventive and Social Medicine. 22nd ed. Jabalpur (IND): Banarsidas Bhanot Publishers; 2013: 18.
4. Bwibo NO, Chigier E, Franzkowiak P, Jeanneret O, Jegede RO, Knobel M, et al. Young people’s health–a challenge for society. Geneva: World Health Organisation; 1986;731:43.
5. World Health Statistics 2012. World Health Organization, Geneva, Switzerland. 2012: 34-35. 6. Srivastava K, Gupta SC, Kaushal SK, Chaturvedi
M. Morbidity profile of elderly–A cross-sectional study of urban Agra. Indian Journal of Community Health. 2010;22(1):51-5.
7. Barua A, Mangesh R, Kumar HNH, Mathew S. A cross-sectional study on quality of life in geriatric population. Indian J Community Med 2007;32(2):146-7.
8. Khokhar A, Mehra M. Life style and morbidity profile of geriatric population in an urbans community of Delhi. Indian J Med Sci. 2001;55(11):609-15.
9. Lena A, Ashok K, Padma M, Kamath V, Kamath A. Health and social problems of the elderly: A cross-sectional study in Udupi taluk, Karnataka. Indian J Community Med. 2009;34(2):131-4.
diabetes among elderly persons in an urban slum of Delhi. Indian Journal of Community Medicine. 2012;37(4):236-9.
11. Multicentric study to establish epidemiological data on health problems in elderly. World Health Organization Collaborative Programme supported by the Government of India. Available at:http://www.whoindia.org/LinkFiles/Health_Care_ for_the_Elderly_Multicentric_study_healthcareelder ly.pdf. Accessed on 30 May 2013.
12. Sanjay TV, Jahnavi R, Gangaboraiah B, Lakshmi P, Jayanthi S. Prevalence and factors influencing depression among elderly living in the urban poor locality of Bengaluru city. Int J Health Allied Sci. 2014;3(2):105-9.
13. Ajit NE, Nandish B, Fernandes RJ, Roga G, Kasthuri A, Shanbhag DN, et al. Prevalence of knee osteoarthritis in rural areas of Bangalore urban district. Internet J Rheumatol Clinical Immunol. 2014;1(1):1.
14. Deepa M, Pradeepa R, Anjana RM, Mohan V. Noncommunicable diseases risk factor surveillance: Experience and challenge from India. Indian J Community Med. 2011;36(Supp):S50-6.
15. Non-communicable disease risk factors survey. New Delhi: Ministry of Health and Family Welfare, Government of India; 2007: 142.
16. Dietary guidelines for Indians–A Manual. Hyderabad: National Institute of Nutr. 2011: 60. 17. Report on diet and nutritional status of elderly.
Hyderabad: National Nutrition Monitoring Bureau, National Institute of Nutrition; 2000.
18. Non-Communicable Disease Risk Factor Survey Bangladesh 2010. Bangladesh: World Health Organization, Regional Office SEAR, New Delhi; 2010.
19. Dhupdale NY, Motghare DD, Ferreira AMA, Prasad YD. Prevalence and Pattern of Alcohol Consumption in Rural Goa. Ind J Comm Med. 2006;31(2):104-05.
20. Global Adult Tobacco Survey (GATS)–Fact Sheet India. Mumbai: Ministry of Health and Family Welfare, Government of India; 2009-2010.
21. Mahfouz EM, Sameh E, Areny T. Prevalence and correlates of overweight and obesity among elderly population residing a rural community, Minia, Egypt. Paper presented at: EMASO. 2012.
22. Khanam MA, Streatfield PK, Kabir ZN, Qiu C, Cornelius C, Wahlin A. Prevalence and patterns of multimorbidity among elderly people in rural Bangladesh: A cross-sectional study. J Health Popul Nutr. 2011;29(4):406–14.
23. Prakash R, Choudhary SK, Singh US. A study of morbidity pattern among geriatric population in an urban area of Udaipur, Rajasthan. Ind J Comm Med. 2004;29(1):35-40.
24. van Durme YM, Verhamme KM, Stijnen T, van Rooij FJ, Van Pottelberge GR, Hofman A, Joos GF, Stricker BH, Brusselle GG. Prevalence, incidence, and lifetime risk for the development of COPD in the elderly: the Rotterdam study. Chest. 2009;135(2):368-77.
25. Kumar S, Shivalli S. Prevalence, perceptions and profile of gastroesophageal reflux disease in a rural population of north Bihar. Nat J Comm Med. 2014;5(2):214-8.