* To whom all correspondence should be addressed.
Analysis of Gene Expression Using Modified Relative
Codon Bias Strength in
Nanoarchaeum Equitans
Shibsankar Das
Department of Mathematics, Uluberia College, Uluberia, Howrah, West Bengal- 711315, India. http://dx.doi.org/10.13005/bbra/2510
(Received: 02 January 2017; accepted: 04 March 2017)
Genes expressed at higher level exhibit extreme codon bias towards the use of optimal set of codons and based on this hypothesis, several codon usage indices are used to predict gene expressions in different genomes. This study analyzed a codon usage methodology, MRCBS (Modified Relative Codon Bias Strength) to explicate the outlines of gene expression in the Nanoarchaeum equitans kin4-Mgenome. The analysis of this work revealed that most of the highly expressed genes of this genome involved in protein synthesis, DNA/protein metabolism, protein fate, cellular process, ribosomal / translation and transcription factor, amino acid biosynthesis and many hypothetical proteins. It is also observed that MRCBS correlates better with codon adaptation index than the other widely accepted codon bias measures.
Keywords: Codon bias index, codon bias, GC content, predicted highly expressed genes, CAI (Codon Adaptation Index).
Predicting expression level of a gene from nucleotide sequence remains an exciting problem in the field of modern bioinformatics. Gene expression in micro-organism is controlled by a number of factors which are participated in protein biosynthesis, mutation, and folding. The important feature of gene expression is observed that codon usage bias varies strongly between genes which are expressed at higher level than genes expressed at lower level and this biased amino acid composition designates the biological importance of these protein coding genes. Recently there have been considerable studies to calculate the genes expressed at higher level in prokaryotes and in eukaryotes and a range of software tools emarged to study gene expression. Comprehensive experimental approaches like cDNA microarray, SAGE etc. require a massive investment of time
and resources and put an obstacle before the investigators. Thus, to predict the genes expressed at higher level in most of the genomes, scientists were started to think use of computational methods instead of direct experimental methods. So using computational methods instead of experimental approaches in calculating expression profile of the genome becomes exciting because it avoids luxurious and time-consuming experimentation.
It is postulated that highly expressed genes preferably choose an optimal subset of codons and often are depicted by strong codon usage bias 1-8, several gene expression measures like
codon adaptation index (CAI)9, Relative Codon
Adaptation (RCA)10, Relative Codon Bias Strength
(RCBS)11-13 are available to compute codon bias
for computing score of RCBS, but RCBS has partial dependency on length of genes (for genes having length < 300 aa)10. In order to get rid of
the problems of partial dependence on gene length and determination of reference set, another model (MRCBS) is proposed. MRCBS uses Ribosomal Protein (RP) genes which are supposed to be genes expressed at higher level3, 4 as a reference set, to
predict the expression levels of genes and it has no length dependency.
Nanoarchaeum equitans kin4-M was
revealed in 2002 by Karl Stetter in a hydrothermal vent off the coast of Iceland on the Kolbeinsey Ridge. It is a species of marine thermophilic Achaea that nurtures at about 800C in temperature.
Thermophilic organisms exhibit more bioleaching rate than non-thermophilic organisms at high temperature, so thermophilic microbes create interest in the application of biomining industry. Genes essential for synthesis of amino acids, nucleotides, cofactors, and lipids are almost
absent in small genome of Nanoarchaeum
equitans (490,885 base pairs), but translates genes required for repair and replication. This limitation of synthesis of amino acids shows that N. equitans is related to archaeal parasite, Ignicoccus.
Nanoarchaeum equitans can nurture only with
host archaeon, Ignicoccus sp., and phylogenetic analysis of their 16S rRNA sequences suggests that they separated early in the archaeal lineage, before the development of the Euryarchaeota and Crenarchaeota. This symbiosis and remarkable evolutionary divergence of N. equitans raised the interest among evolutionary biologist on whether it has gone through extensive evolution14, 15. Thus,
the gene expression of N. equitans is expected to make important contributions in several areas. In this work, the gene expression and the variation in patterns of synonymous codon usage across
the genes of Nanoarchaeum equitans kin4-M
using MRCBS is investigated. To measure the performance of the proposed codon usage measure, MRCBS is compared with the performances of several commonly used measures.
MATERIALS AND METHODS
The whole genome of Nanoarchaeum
equitans kin4-M along with gene annotations is retrieved from NCBI GenBank. In this study, all
coding DNA sequence (CDS) which are annotated as hypothetical and predicted by computational
methods has been used. Nanoarchaeum equitans
kin4-M (400 nm in diameter and 31.56% GC
content), smallest known Achaean encodes 536 proteins, 82% of which are annotated as either “hypothetical protein” or “protein of unknown function”). In the following sections, the different expression level predictors CAI, RCBS, RCA, GC3 and Impact Codon is briefly described and an alternative approach using the score of modified relative codon bias strength (MRCBS) is explained. Codon Adaptation Index (CAI) [9]
The codon adaptation index (CAI)
calculates the difference of codon usage of a particular gene from the codon usage of the highly expressed genes in the reference set. Let fi,aais the frequency of codon i, and faa,max is the maximum frequency of the codon used for encoding amino acid aa in a set of highly expressed genes. The relative adaptiveness (wi) is obtained by normalizing the frequency of each synonymous codons by the frequency of the most frequently used codon i.e.
,
,max
i aa i
aa
f
w
f
=
The CAI of a gene is computed as the the geometric mean of‘s of all codons (excluding stop codons) in a gene sequence of length N,
1
1
N N i
CAI= w
∏
The values of CAI range from 0 to 1 and genes having values close to 1 are supposed to be PHE genes.
Relative Codon Adaptation (RCA) [10]
Fox et al10 suggested RCA which
computes codon bias of a gene using codon bias of the highly expressed genes in the reference set. Relative adaptation for individual codon xyz is defined as
where is the relative frequency of codon xyz in any reference set of highly expressed genes, is the relative occurrence of nucleotide base n at codon position m in any reference set of highly expressed genes and N is the number of codons in the particular gene sequence.
Relative Codon Bias Strength (RCBS)[11-13] The codon usage index of a gene designated by RCBS is calculated as
and
where is the relative frequency of codon xyz and is the relative occurrence of nucleotide base n at codon position m and N is the number of codons in the particular gene sequence.
GC3
Highly expressed genes always use a subset of favored codons. These biased codons are either C or T ending at the third position. C. Shields et al. [16] established that GC contents were frequently interrelated with expression patterns of genes. The GC3 content is calculated as the frequency of G or C nucleotides at the third position of codons except Met, Trp and stop codons i.e.
Where N= any base , S = G or C
and is the observed frequency of codon xyz Impact Codon
Das et al17 calculated the gradation of
codon bias of every codon by computing ana score,
denoted as impact score ( as it reflects codon usage bias as well as the compositional bias of nucleotide base. Impact score is defined as
where is the relative frequency of codon xyz and is the relative occurrence of nucleotide base n at codon position m in a particular gene.
Let and µ represent the sample mean and population mean of respectively; and s be the population standard deviation, then z score is calculated as
where N is the gene length. Based on the z score of each codon, a codon is classified as impact codon if its z score qualifies significance level (general used 5% significance level).
Modified Relative Codon Bias Strength (MRCBS)18-19
The proposed method is interrelated to codon usage of a gene with respect to compositional bias of nucleotide base at the three codon sites. Let
fxyz be the calculated normalized codon frequency
for the codon triplet (x,y,z) in a particular reference set of gene and is the relative observed frequency of base m at codon position n in the same reference set.
Thus the codon usage measure of a gene is defined as
Table 1. Top 10 MRCBS score of the genes in Nanoarchaeum equitans kin4-M genome
Gene Function MRCBS
NEQ083 30S ribosomal protein S10 0.829214
NEQ422 diphthine synthase 0.828606
NEQ210 prolyl-tRNA synthetase 0.82274
gltX glutamyl-tRNA synthetase 0.818104
NEQ530 50S ribosomal protein L32e 0.817878 NEQ247 30S ribosomal protein S4 0.814004 NEQ242 30S ribosomal protein S7 0.813881 NEQ405 Translation initiation factor 0.812336
IF-2 alpha
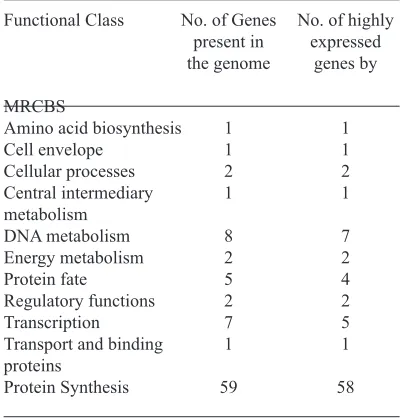
Table 2. No. of PHX genes predicted versus no. of genes present in Nanoarchaeum equitans kin4-M
Functional Class No. of Genes No. of highly present in expressed the genome genes by
MRCBS
Amino acid biosynthesis 1 1
Cell envelope 1 1
Cellular processes 2 2
Central intermediary 1 1
metabolism
DNA metabolism 8 7
Energy metabolism 2 2
Protein fate 5 4
Regulatory functions 2 2
Transcription 7 5
Transport and binding 1 1
proteins
Protein Synthesis 59 58
Fig. 1. Distribution of MRCBS score for all protein coding genes in the Nanoarchaeum equitans kin4-M
Fig. 2. MRCBS depicted against CAI for Nanoarchaeum equitans kin4-M genes
where
MRCBSxyz=
RCBSaa, max is the maximum RCBS of
codon encoding same amino acid aa in the same reference set, and N is the length in gene. MRCBxyz is independent of the size of the reference set as
it is the ratio of the RCBS of the codon xyz to the maximum of RCBS of codon encoding same amino acid. The value of MRCBS lies between 0 and 1. In this study, the criteria MRCBS > T (Threshold score) was taken as a standard for recognizing the highly expressed genes and methodology used to calculate threshold score as described in Sahoo and Das19. Due to variation
value correlates actual expression level predicted by MRCBS is defined. First, CAI is calculated for all the genes by taking all RP (>80 aa) genes as highly expressed genes and called this as an evaluation set. Then taking a random threshold score T of MRCBS, highly expressed genes is differentiated from expression of gene at lower level. The genes expressed at higher level with expression level (MRCBS) greater than T define parameterization set. Relative adaptiveness of CAI is computed by taking parameterization set as reference set. With the parameters in hand, CAI scores of all the sequences in the data set were computed. In order to evaluate how well the MRCBS predicts expression level, the correlation between CAI values of the data set and evaluation set is calculated and denoted as merit of the method. The process is iterated by varying the threshold T and repeating the procedure till optimal merit of the method is reached. This way, the optimal threshold value of MRCBS of the whole genome expression data is obtained.
In this work, codon usage measures CAI, RCA and MRCBS have been calculated by relating its codon usage bias with the codon usage of the housekeeping genes, for example the ribosomal protein (RP) genes, which are commonly believed to PHE genes. The PHE are then categorized based on the degree of the codon usage bias obtained from measures as defined above and a gene is recognized as highly expressed gene if its MRCBS exceeds threshold value T. All the correlation used in this work is the Pearson r correlation coefficients between different codon usage bias indices computed.
RESULTS AND DISCUSSION
N. equitans genome comprises a one
chromosome of 490885 base pairs with GC content of 31.56%. This low GC content indicates that all the sense codons (61 codons) are not used uniformly, only the codons ending at third positions are A or T. In this study, 536 protein coding genes are recognized with an average base pair length of 848. Although N. equitans is smallest known Achaean, but protein coding and RNA genes of the genome are 95% of the total genome which is abnormally high in the genomes. Only 18.3% of the protein coding genes with unknown function are homologs
to other genomes and residual genes are the sole features of this genome20. In this work, MRCBS
is applied to diverse genes from Nanoarchaeum
equitans kin4-M and gene expression profiles
are deduced by computing the MRCBS score for every gene and their distributions are shown in Figure 1. Figure 1 shows that distribution of the MRCBS score is unimodal and MRCBS score of most of the genes is varying from 0.633342 to 0.853183 and the mean and median MRCBS score are 0.766318 and 0.770313 respectively. The best threshold score of this genome is determined to 0.78. There are 186 predicted highly expressed
genes (PHE) in Nanoarchaeum equitans Kin4-M
by taking above mentioned threshold score. Table 1 shows the top ten genes as PHX gene. Functional class analysis [Annotation done by Secondary (JCVI) Annotation (http://cmr.jcvi.org/tigr-scripts/ CMR/GenomePage.cgi)] are shown in Table 1. It is clear that out of 10 genes in top genes, 6 genes are ribosomal protein / translation factor which are commonly known as highly expressed genes.
T h e d i s t i n c t i v e P H E g e n e s i n
Nanoarchaeum equitans Kin4-M include rpoA2,
DNA-directed RNA polymerase subunit E’(NEQ370), anaerobic ribonucleoside triphosphate reductase (NEQ345).
Table 2 shows the number of genes predicted versus total number of existing genes of this genome. It shows that majority of the genes present in the genome are highly expressed. Genes involved in functional class of biosynthesis of cofactors, prosthetic groups, and carriers, fatty acid and phospholipid metabolism, and Purines, pyrimidines, nucleosides, and nucleotides are not present in the genome, it implies that host genome is needed to synthesize amino acids and lipids. However, a percentage of genes (146 out of 444 hypothetical genes) characterized as hypothetical
genes may be found among the PHE. Norman et
al21 showed that 238 out of 355 essential proteins
in 16 model bacterial species comprised proteins in domains of unknown function (DUFs), and most of them represented single-domain proteins which obviously showed the biotic significance of DUFs. It suggests that experimental research should emphasis on conserved and essential DUFs for functional analysis. A detailed study of these putative/hypothetical PHE genes should yield a clear image of the replication and division machineries, and regulatory features of the cell cycle.
Correlations among different codon bias indices In this study, expression patterns of 536
genes of Nanoarchaeum equitans kin4-M are
obtained by computing the scores of CAI, RCA, RCBS and MRCBS. The predicted score MRCBS of a gene is computed by comparing its codon usage bias with the pro ûle of universally functional genes, such as the ribosomal protein (RP) genes. Using same ribosomal protein (RP) genes as reference set, used in the computation of MRCBS, CAI and RCA scores have been calculated. The results indicate that CAI is a strong correlated with
RCA (r = 0.43644) and MRCBS (0.58787) while
the correlation of RCBS with CAI is signiûcantly worse (r = 0.0477). Figure 2 shows the comparison of the gene expression computed by MRCBS over CAI. It suggests that MRCBS can be used as a good estimator for codon usage bias.
Impact codons
It is hypothesized that genes expressed at higher level uses a subset of optimal codons than the gene expressed at lower level. Impact codons
propose such method to determine such codons in highly expressed genes by recognizing the level significance of z score. Thus, at the 95% level of significance, the following impact codons of
Nanoarchaeum equitans genome are obtained:
ttt, ttc (Phe), tta,ttg, cta (Leu), ata (Ile), tat, tac (Tyr), aaa (Lys), gaa, gag (Glu), tct, tcc (Ser), gcc, gct (Ala), tgg (Trp), cct, ccc, cca (Pro), agc, agg (Arg), ggt, ggc, ggg (Gly). Excluding Met, Val, Gln, Asp, Thr, Cys, Asn, His, it is observed that twenty five codons of 12 amino acids are found at higher significance level in PHE genes than the whole genome. Surprisingly, there is no compositional bias seen among these 25 codons which comprise 12 G/C and 13 A/T codons ending at third positions. So, all the impact codons are not GC rich and GC3 content could not be used as codon usage bias indicator at all. Thus, impact codons may possibly influence translational efficiency by selective forces acting on highly expressed genes.
CONCLUSION
Here, we analyzed the performance of MRCBS to forecast the expression profile of
the Nanoarchaeum equitans kin4-M genome.
Present study showed that most of the genes of this genome involved in amino acid biosynthesis, protein Synthesis, DNA metabolism and ribosomal / translation and transcription factor fall in PHE genes category. The other genes with PHE comprise cellular process, central intermediary metabolism, energy metabolism and many hypothetical proteins. In this study, good codon bias is observed in highly expressed genes of Nanoarchaeum equitans kin4-M genome. It can be noted that the performance of proposed methodology displays well correlated with expression measures computed by several other measures used in the literature. MRCBS relates codon bias in addition to the nucleotide biases of the genes for estimating the potential expression levels of genes. Due to biophysical and biochemical restrictions of the experimental methods, there are numerous limits to relate the connection between gene expression and codon bias. It has shown that the proposed methodology has performed well on a number of slow-growing and fast-growing bacteria genomes, Saccharomyces cerevisiae, Caenorhabditis elegans and Drosophila
through relating it with other widely used codon usage measures.
REFERENCES
1. BBa|ej P, Mackiewicz D, Wn’trzak M and Mackiewicz P. The Impact of Selection at the Amino Acid Level on the Usage of Synonymous Codons. G3 (Bethesda) 2017; 7(3); 967-981. 2. Mrázek, J. , Spormann, A. M. and Karlin, S.
Genomic Comparisons among ³-proteobacteria. Env. Microbiol. 2006; 8; 273-288.
3. Karlin, S., Brocchieri, L., Campbell, A., Cyert, M. and Mrázek, J. Genomic and proteomic comparisons between bacterial and archaeal genomes and related comparisons with the yeast and fly genomes. Proc. Natl. Acad. Sci. USA. 2005; 102; 7309-7314
4. Karlin S , Mrazek J and Brocchieri ML. Predicted highly expressed genes in archaeal genomes. Proc. Natl. Acad. Sci. USA. 2005; 102: 7303–7308.
5. Carbone A, Zinovyev A and Fékèps F. Codon Bias Signatures, Organization of Microorganisms in Codon Space, and Lifestyle. Mol Biol Evol. 2005; 22(3): 547-561.
6. Zhou Z, Dang Y, Zhou M, Li L, Yu C, Fu J and Liu Y. Codon usage is an important determinant of gene expression levels largely through its effects on transcription. Proc. Natl. Acad. Sci. USA. 2016; 113(41): 6117–6125.
7. Supek Fand Vlahovicek K. Comparison of codon usage measures and their applicability in prediction of microbial gene expressivity. BMC Bioinformatics 2005; 6: 182.
8. Supek Fand Vlahovicek K. Correction:Comparison of codon usage measures and their applicability in prediction of microbial gene expressivity. BMC Bioinformatics 2010; 11: 463.
9. Sharp PM and Li WH. The codon adaptation index -a measure of directional synonymous codon usage bias and its potential applications. Nucleic Acids Res 1987; 15: 1281-1295.
10. Fox JM and Erill I. Relative Codon Adaptation: A Generic Codon Bias Index for Prediction of Gene Expression. DNA Res. 2010; 17: 185–196. 11. Roymondal U, Das Sand Sahoo S. Predicting
gene expression level from relative codon usage bias:an application to Escherichia coli genome. DNA Res. 2009; 16: 13–30.
12. Das S, Roymondal U and Sahoo S. Analyzing gene expression from relative codon usage bias in Yeast genome: a statistical significance and biological relevance. Gene 2009; 443: 121– 131. 13. Das S, Roymondal U, Chottopadhyay B
and Sahoo S. Gene expression profile of the cynobacterium synechocystis genome. Gene 2012; 497: 344-352.
14. Kira S M and Eugene V K. Evolutionary and functional genomics of the Archaea. Current Opinion in Microbiology 2005; 8(5); 586-594. 15. Huber, H., Christine M. Archaeal symbionts and
parasites. Current Opinion in Microbiology 2011;
14(3); 364-370.
16. Shields, D.C. Switches in species-specific codon preferences: the influence of mutation biases. J. Mol. Evol. 1990; 31: 71–80.
17. Das, S., Chakrabarti, J., Ghosh, Z., Sahoo, S., and Mallick, B. A new measure to study phylogenetic relations in the brown algal order Ectocarpales: the “codon impact parameter.” J. Biosci. 2005;30: 699–709.
18. Sahoo S and Das S. Analyzing gene expression and codon usage bias in diverse genomes using a variety of models. Current Bioinformatics 2014;
9: 102-112.
19. Sahoo S and Das S. Analyzing gene expression and codon usage bias in Metallosphaera Sedula. Journal of Bioinformatics and Intelligent Control 2014; 3: 72–80.
20. Bohlin J, Skjerve E and Ussery D W. Analysis of genomic signatures in prokaryotes using multinomial regression and hierarchical clustering. BMC Genomics 2009; 10; 487-496. 21. Norman F. G, Dietlind L. G, Peter U. Protein