Original Research Article
Unmet need for family planning of married women in rural areas of
Kalaburagi: an application of multiple logistic regression model
Deepak Jamadar, K. P. Joshi*
INTRODUCTION
India is the second most populous country in the world. This alarming increase in population is a threat to the socio-economic development of the country, lowering the quality of life, degrading our environment. Over the past 45 years, there have been significant advances in
contraceptive methods and services. However
contraceptive practices are not widely used. Many factors are responsible for underutilization of contraceptives. Women who are sexually active want to avoid pregnancy but are not using any method of contraception. These
women are considered to have an unmet need for
contraception.1 The unmet need for family planning is
13% in India and 9.6% for Karnataka.2 It has reduced
when compared to NFHS-1 (20%) and NFHS-2 (16%).3,4
Keeping in view the above points, the present study was conducted to make a prediction of unmet need for family planning for the effective implementation of family planning programmes.
METHODS
The study period was June-2016 to June-2017 in the rural areas of Kalaburagi district of Karnataka state. 600 ABSTRACT
Background: Unmet need for family planning, which refers to the condition in which there is the desire to avoid or post-pone child bearing, without the use of any means of contraception, has been a core concept in the field of international population. This study aimed to determine the factors affecting for unmet need for family planning among married women in the age group of 15-49 years of rural areas of Kalaburagi. By multiple logistic regression model and stepwise forward logistic regression model to estimate the parameters of the model, odds ratios and log likelihood values are computed. Testing of hypothesis of goodness of fit of the model is carried out by Hosmer and Lemeshow test.
Methods: 600 married women in the age group of 15-49 years were the study participants who were selected randomly from the 7 taluks of rural areas by using multistage sampling techniques.
Results: Total of 26 explanatory variables are included in the model, in which only 5 explanatory variables (19.00%) are found to be significant regression coefficients i.e., education of married women, abortion, physical deformities baby, ideal gap between children, contraceptive used in past normal level of significance (p<0.05).
Conclusions: The test statistic of all five models, only model 4 and model 5 fit well with response variable for the rural sample data.
Keywords: Unmet need for family planning, Multiple logistic regression model, Stepwise logistic regression model
Department ofCommunity Medicine, SVS Medical College, Yenugonda, Mahabubngar, Telangana, India
Received: 23 January 2019
Revised: 27 February 2019
Accepted: 28 February 2019
*Correspondence:
Dr. K. P. Joshi,
E-mail: [email protected]
Copyright: © the author(s), publisher and licensee Medip Academy. This is an open-access article distributed under the terms of the Creative Commons Attribution Non-Commercial License, which permits unrestricted non-commercial use, distribution, and reproduction in any medium, provided the original work is properly cited.
married women in the age group of 15-49 years were the study participants. The inclusion criteria were women in the reproductive age group of 15-49 years who were currently married, who were not using any method of contraception, but who either did not want any more children or wanted to wait for two or more-years-before having another child. Exclusion criteria were unmarried women, separated/divorced women, widows, pregnant due to contraceptive failure. A cross sectional study design was used. The study participants were selected from the seven taluks of rural areas by using multistage sampling. The data pertaining to the study was collected through pre-designed, structured questionnaire. The respondents were also interviewed about their knowledge of contraceptive methods, past and current use of
contraceptives and whether they want to use
contraceptives in future. Based on use of contraceptives, the respondents were classified into met and unmet need groups. Met group of contraception were those married women of reproductive age group who were using contraceptives and satisfied. Unmet need group of contraception were those married women of reproductive age group who do not want to use contraceptives. The present study was carried out to predict unmet need for family planning of married women in Kalaburagi district of Karnataka state using multiple logistic regression
model and step wise forward logistic regression model.5,6
The summary of the accuracy of the diagnostic test was
done by using ROC curve.6,7 The data analysis and
statistical analysis was done by using SPSS software to test the significance of the study at p<0.05.
RESULTS
In this section, parameter estimates, odds ratios and log likelihood values are obtained for multiple logistic model for rural areas and are presented.
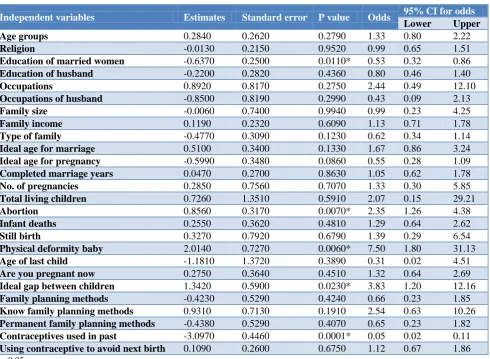
The following table presents parameter estimates and their standard errors of explanatory variables of multiple logistic regression model for the unmet need for family planning of married women. A total of 26 explanatory variables are included in the model, in which only 5 explanatory variables (19.0%) are found to be significant regression coefficients i.e., education of married women, abortion, physical deformities baby, ideal gap between children, contraceptive used in past normal level of significance (p<0.05). These significant explanatory variables exhibited significant regression coefficients, indicating that these are significant predictors of unmet need for family planning of married women.
Table 1: Multiple logistic regression coefficients for the relationship between unmet need and its determinants among married women in rural areas of Kalaburagi district.
Independent variables Estimates Standard error P value Odds 95% CI for odds
Lower Upper
Age groups 0.2840 0.2620 0.2790 1.33 0.80 2.22
Religion -0.0130 0.2150 0.9520 0.99 0.65 1.51
Education of married women -0.6370 0.2500 0.0110* 0.53 0.32 0.86
Education of husband -0.2200 0.2820 0.4360 0.80 0.46 1.40
Occupations 0.8920 0.8170 0.2750 2.44 0.49 12.10
Occupations of husband -0.8500 0.8190 0.2990 0.43 0.09 2.13
Family size -0.0060 0.7400 0.9940 0.99 0.23 4.25
Family income 0.1190 0.2320 0.6090 1.13 0.71 1.78
Type of family -0.4770 0.3090 0.1230 0.62 0.34 1.14
Ideal age for marriage 0.5100 0.3400 0.1330 1.67 0.86 3.24
Ideal age for pregnancy -0.5990 0.3480 0.0860 0.55 0.28 1.09
Completed marriage years 0.0470 0.2700 0.8630 1.05 0.62 1.78
No. of pregnancies 0.2850 0.7560 0.7070 1.33 0.30 5.85
Total living children 0.7260 1.3510 0.5910 2.07 0.15 29.21
Abortion 0.8560 0.3170 0.0070* 2.35 1.26 4.38
Infant deaths 0.2550 0.3620 0.4810 1.29 0.64 2.62
Still birth 0.3270 0.7920 0.6790 1.39 0.29 6.54
Physical deformity baby 2.0140 0.7270 0.0060* 7.50 1.80 31.13
Age of last child -1.1810 1.3720 0.3890 0.31 0.02 4.51
Are you pregnant now 0.2750 0.3640 0.4510 1.32 0.64 2.69
Ideal gap between children 1.3420 0.5900 0.0230* 3.83 1.20 12.16
Family planning methods -0.4230 0.5290 0.4240 0.66 0.23 1.85
Know family planning methods 0.9310 0.7130 0.1910 2.54 0.63 10.26
Permanent family planning methods -0.4380 0.5290 0.4070 0.65 0.23 1.82
Contraceptives used in past -3.0970 0.4460 0.0001* 0.05 0.02 0.11
Using contraceptive to avoid next birth 0.1090 0.2600 0.6750 1.12 0.67 1.86
Figure 1: The plot of sensitivity and specificity versus criterion value for the response variable in the rural
area.
The area under ROC curve of the response variable is 0.7618. It provides a summary of the accuracy of the diagnostic test which is nearly 76% in the rural samples. The accuracy of the test in the means of ROC has been presented in the following figure.
Table 2: Model summary.
-2 log likelihood Cox and Snell R2 Nagelkerke R2
661.4260 0.2510 0.3350
From the results of the following table, we observed that,
the -2 log likelihood is 661.426, Cox and Snell R2 is
0.2510 and Nagelkerke R2 is 0.3350. It means that the
model is useful in prediction of unmet need for family planning and fits well for rural samples.
Table 3: Hosmer and Lemeshow test.
Chi-square df Significance
8.4070 8 0.3950
Further, the Hosmer and Lemeshow test also clearly shows that, the chi-square is 8.4070 with p-value 0.3950; it indicates that the above model fits well for the rural samples.
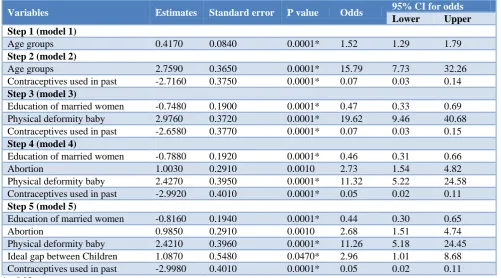
The stepwise forward method was carried out for the following explanatory variables i.e., age, religion, education of married women, education of husband, occupations of rural married women, occupations of husband, family size, family income, type of family, ideal age for marriage, ideal age for pregnancy, age at time of marriage, completed marriage years, no of pregnancies, total living children, abortion, infant deaths, still birth, physical deformity baby, age of last child, are you pregnant now, ideal gap between children, family planning methods, know family planning methods, permanent family planning methods, ideal gap between children, contraceptives used in past and using contraceptive to avoid next birth to predict the probability of unmet need for family planning of rural married women.
Table 4: Results of stepwise logistic regression analysis of unmet need for family planning of rural married women.
Variables Estimates Standard error P value Odds 95% CI for odds
Lower Upper Step 1 (model 1)
Age groups 0.4170 0.0840 0.0001* 1.52 1.29 1.79
Step 2 (model 2)
Age groups 2.7590 0.3650 0.0001* 15.79 7.73 32.26
Contraceptives used in past -2.7160 0.3750 0.0001* 0.07 0.03 0.14
Step 3 (model 3)
Education of married women -0.7480 0.1900 0.0001* 0.47 0.33 0.69
Physical deformity baby 2.9760 0.3720 0.0001* 19.62 9.46 40.68
Contraceptives used in past -2.6580 0.3770 0.0001* 0.07 0.03 0.15
Step 4 (model 4)
Education of married women -0.7880 0.1920 0.0001* 0.46 0.31 0.66
Abortion 1.0030 0.2910 0.0010 2.73 1.54 4.82
Physical deformity baby 2.4270 0.3950 0.0001* 11.32 5.22 24.58
Contraceptives used in past -2.9920 0.4010 0.0001* 0.05 0.02 0.11
Step 5 (model 5)
Education of married women -0.8160 0.1940 0.0001* 0.44 0.30 0.65
Abortion 0.9850 0.2910 0.0010 2.68 1.51 4.74
Physical deformity baby 2.4210 0.3960 0.0001* 11.26 5.18 24.45
Ideal gap between Children 1.0870 0.5480 0.0470* 2.96 1.01 8.68
Contraceptives used in past -2.9980 0.4010 0.0001* 0.05 0.02 0.11
*p<0.05
0
.0
0
0
.2
5
0
.5
0
0
.7
5
1
.0
0
S
e
n
si
ti
vi
ty/
S
p
e
ci
fi
ci
ty
0.00 0.25 0.50 0.75 1.00
Probability cutoff
Figure 2: The accuracy of the test in the means of ROC for the rural area full model.
The final model was achieved in 5th step. The final model
includes five explanatory variables such as education of married women, abortion, physical deformity baby, ideal gap between children and contraceptives used in past,
with significant regression achieved in 5th step.
Table 5: Model summary.
Models -2 log
likelihood
Cox and
Snell R2
Nagelkerke R2
Model 1 810.6990 0.0410 0.0550
Model 2 710.5580 0.1880 0.2500
Model 3 694.7530 0.2090 0.2780
Model 4 682.0830 0.2250 0.3000
Model 5 677.6620 0.2310 0.3080
The model fit summary includes -2 log likelihood, Cox
and Snell R2 and Nagelkerke R2 which are presented in
the following table. We observe that, models 4 and 5 fit well and very useful in prediction of unmet need for family planning of rural married women.
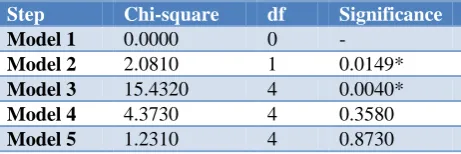
Table 6: Hosmer and Lemeshow test.
Step Chi-square df Significance
Model 1 0.0000 0 -
Model 2 2.0810 1 0.0149*
Model 3 15.4320 4 0.0040*
Model 4 4.3730 4 0.3580
Model 5 1.2310 4 0.8730
*p<0.05
The Hosmer and Lemeshow test statistic of all five models are presented in the following table. It is clear that, only model 4 and model 5 fit well with response variable for the rural sample data.
DISCUSSION
In this study we observed that, twenty six explanatory variables are included in the model, in which only 5
explanatory variables (19.00%) are found to be significant regression coefficients i.e., education of married women, abortion, physical deformities baby, ideal gap between children, contraceptive used in past normal level of significance (p<0.05). A study conducted by Nzokirishaka et al multivariate model also revealed that total unmet need had a protective association with
women educated at primary and secondary levels.8 The
multivariate analysis revealed the existence of a protective association between education and total unmet need and a positive association between women with no education and these associations lost strength though, moving from the univariate to the multivariate analysis. Women's educational status is positively associated with
contraceptive prevalence in Ethiopia.9,10 Unmet need for
family planning among rural women is likely to result insignificant improvements in women’s health while also limiting further population growth to enable the country to overcome some challenges towards sustainable
development.11
The stepwise forward method was carried out for the following explanatory variables i.e., age, religion, education of married women, education of husband, occupations of rural married women, occupations of husband, family size, family income, type of family, ideal age for marriage, ideal age for pregnancy, age at time of marriage, completed marriage years, no of pregnancies, total living children, abortion, infant deaths, still birth, physical deformity baby, age of last child, are you pregnant now, ideal gap between children, family planning methods, know family planning methods, permanent family planning methods, ideal gap between children, contraceptives used in past and using contraceptive to avoid next birth to predict the probability of unmet need for family planning of rural married
women. The final model was achieved in 5th step. The
final model includes five explanatory variables such as education of married women, abortion, physical deformity baby, ideal gap between children and contraceptives used in past, with significant regression
achieved in 5th step.
The model fit summary includes -2 log likelihood, Cox
and Snell R2 and Nagelkerke R2. We observe that, models
4 and 5 fit well and very useful in prediction of unmet need for family planning of rural married women.
CONCLUSION
It is observed that the model is a good fit to the rural sample data. Also the more prominent predictors of unmet need for family planning were identified using stepwise logistic regression analysis. The prediction of unmet need for family planning is useful in controlling the population growth. The gap between knowledge and practice regarding family planning needs serious attention from the concerned authority to be addressed. The study concerns the need for the policy maker, government officials, and program managers to focus on strategic
0
.0
0
0
.2
5
0
.5
0
0
.7
5
1
.0
0
S
e
n
si
tivi
ty
0.00 0.25 0.50 0.75 1.00
1 - Specificity
behavior communication program regarding reproductive health and study can also help the program managers of the reproductive health directorate to conduct further analysis and to review their policies and future strategies.
Funding: No funding sources Conflict of interest: None declared
Ethical approval: The study was approved by the Institutional Ethics Committee
REFERENCES
1. Robey B, Ross J, bhushan I. Meeting unmet need;
new strategies. Popul Rep series J. Family Planning Prog. 1996;(43):1-35.
2. National Family Health Survey India (NFHS-3).
International Institute for population sciences, Mumbai, fact sheet, 2005-06.
3. National Family Health Survey India (NFHS-1):
International Institute for population sciences, Mumbai, fact sheet, 1992-93.
4. National Family Health Survey India (NFHS-2):
International Institute for population sciences, Mumbai, fact sheet, 1998-99.
5. Mekonnen W, Worku A. Determinants of fertility in
rural Ethiopia: the case of Butajira Demographic Surveillance System (DSS). BMC Public Health. 2011;11(1):782.
6. Zweig MH, Campbell G. Receiver-operating
characteristic (ROC) plots, a fundamental evaluation
tool in clinical medicine. Clinical Chemistry. 1993:39:561-77.
7. Hanley JA, McNeil BJ. The meaning and use of the
area under a receiver operating characteristic (ROC) curve. Radiology. 1982;143:29-36.
8. Nzokirishaka A, Itua I. Determinants of unmet need
for family planning among married women of reproductive age in Burundi: a cross-sectional study. Contraception Reproductive Med. 2018;3:11.
9. Bankole A, Hussain R, Sedgh G, Rossier C, Kaboré
I, Guiella G. Unintended pregnancy and induced abortion. In: Burkina Faso editor: Causes and consequences; 2014.
10. Adebowale SA, Palamuleni ME. Determinants of
unmet need for modern contraception and reasons for non-use among married women in rural areas of Burkina Faso. Afr Popul Stud. 2014;28:499–514.
11. Babalola S, Fatusi. A Determinants of use of
maternal health services in Nigeria-looking beyond individual and household factors. BMC Pregnancy Childbirth. 2009;9(1):43.