ISSN (Online): 2409-4285 w w w.IJCSSE.org Page: 144-150
Performance Evaluation of Histogram Equalization and Fuzzy image
Enhancement Techniques on Low Contrast Images
Ebele Onyedinma1, Ikechukwu Onyenwe2 and Hycinth Inyiama3
1, 2 Department of Computer Science, Nnamdi Azikiwe University, Awka. Anambra State, Nigeria
1[email protected], 2[email protected], 3[email protected]
ABSTRACT
Image enhancement aims at improving the information content of original image for a specific purpose. This purpose could be for visual interpretation or for effective extraction of required details. Nevertheless, some acquired images are often associated with pixels of low dynamic range and as such result in low contrast images. Enhancing the contrast therefore tends to increase the dynamic range of the gray levels in the acquired image so as to span the full intensity range. Techniques such as Histogram Equalization (HE) and fuzzy technique can be adopted for contrast enhancement. HE adjusts the contrast of an input image by modifying the intensity distribution of its histogram. It is characterized by providing a global approach to image enhancement, computationally fast and easy to implement approach but can introduce unnatural artifacts and other undesirable elements to the resulting image. Fuzzy technique on its part enhances image by mapping the image gray level intensities into a fuzzy plane using membership functions; modifying the membership functions as desired and mapping back into the gray level plane. Thus, details at desired areas can be enhanced at the expense of increase in computational cost. This paper explores the effect of the use of HE and fuzzy technique to enhance low contrast images. Their performances are evaluated using the M ean squared error (M SE), Peak to signal noise ratio (PSNR), entropy and Absolute mean brightness error (AM BE).
Keywords: Histogram Equalization, Fuzzy, Intensity, Gray Level, Membership Function.
1. INTRODUCTION
Image enhancement is the process of man ipulating an image so that the result is more suitable than the original for a specific applicat ion [1]. It a ims at improving the quality and the information content of original image for e ither preprocessing or post processing operations. Image enhancement is by nature problem oriented; showing that the technique to be adopted is dependent on the need for the enhancement. It could be for v isual interpretation as in med ical imaging where the visual quality of an image is
paramount or for machine perception where easily quantified image is considered most ideal. In either case, the objective is to provide a more conte xt-effic ient resultant image than the origina l. Co mmon enhancement practices include image filtering, image smoothing, image sharpening and contrast enhancement.
Histogram Equalizat ion has been a very effective and most wide ly used method to enhance the contrast of images. It is co mputationally fast and easy to imple ment. Despite its success in contrast enhancement, it fa ils in situations where it is necessary to preserve the brightest factor of an image. It gives un-natural a rtifacts like intensity saturation, over-enhancement and noise amp lification wh ich are not desirable especially to consumer electronic products [1][4]. In order to enhance contrast and preserve brightness, techniques that can decompose the input image into several sub -images, and then apply the classical HE process were adopted by many researchers. In the work of [5], Bi-histogram equalization (BBHE) was proposed. This forms two separate histograms fro m the same image and then equalizes them independently. The first one is the histogram of intensities that are less than the mean intensity while the second is the histogram of intensities that are greater than the mean intensity. BBHE actually reduces the mean brightness variation but it cannot solve enhancement proble m e ffective ly as it can result in unnatural enhancement in so me cases and requires higher degree of preservation. An extension of BBHE referred to as minimu m mean b rightness error b i-histogram equalizat ion (MM BEBHE) was proposed by [6] to provide ma ximu m brightness preservation. They performed separation of the input image's histogram based on the threshold level as opposed to the input mean of BBHE. This actually minimizes the diffe rence between input and output image’s mean and preserves brightness better than BBHE, though its major drawback is high computational cost.
Nevertheless, these techniques offer global approach to image enhancement and cannot be adapted to local brightness features of the input image because only global histogram informat ion over the whole image is used [7]. To enhance details over a s mall a rea, fu zzy enhancement technique can be adopted. . In the work of [8], use of parametric fu zzy transform to enhance low contrast image was proposed. The fuzzy co mponents of the original image were generated using paramet ric fuzzy partit ion and modified by fuzzy probabilistic operators. in another development, [9] opined that the integration of mu ltiple fu zzy me mbe rship functions will provide an optimal contrast enhancement. In general, unlike conventional image enhancement method wh ich is usually associated with losing local brightness details in the highly dark and bright areas; fuzzy technique tends to avoid discontinuity of gray values by modifying the g ray values with the help of me mbership function. In fact, it has the ability to manage the imprec ision encountered in images effectively. In the fuzzy technique, the image is considered as a range of fuzzy singletons having a me mbership value. These me mbe rship values represent the degree of image
property (me mbership) in the range; the nearer the value to unity, the higher the me mbership grade. Conversely, the c loser the value to ze ro, the lo wer the me mbe rship grade [1]. Fu zzy image enhancement is achieved by mapping image gray level intensities into a fuzzy p lane using me mbe rship functions, the me mbe rship functions are modified for desired purpose, and the fuzzy plane is mapped back to image gray level intensities. The result is producing an image with enhanced details at desired portions of the image
2. MATERIALS AND METHOD
2.1 Histogram equalization
Given a digita l image f, the probability of occurrence of intensity level rk in the image is given as:
𝑝𝑟(𝑟𝑘) =𝑛𝑁𝑘 ; 𝑘 = 0,1,2, … , 𝐿 − 1 (1) Where N is the total number of pixels in the image; nk is
the number of p ixe ls that have intensity rk and L is the
number of possible intensity levels in the image. It should be noted that 𝑝𝑟(𝑟𝑘) relates with the histogram of input image; as a plot of 𝑝𝑟(𝑟𝑘) versus rk gives the
histogram of input image. Performing a discrete transformation on the cumu lative distribution function CDF of the input image as follows
𝑠𝑘= 𝑇(𝑟𝑘) = (𝐿 − 1) ∑ 𝑝𝑟(𝑟𝑗 𝑘
𝑗=0
) (2)
Note that the cumulat ive distribution function corresponding to 𝑝𝑟is given by
∑ 𝑝𝑟(𝑟𝑗
𝑘
𝑗=0
) (3)
Thus, the intensity transformation will produce
(𝐿 − 1)
𝑁 ∑ 𝑛𝑗
𝑘
𝑗=0
𝑘 = 0, 1, 2, 3, … , 𝐿 − 1 (4)
By mapping each pixe l in the input image with intensity rk into a corresponding pixe l with leve l 𝑠𝑘 in the output
image produces an equalized image.
2.2 Fuzzy Image Enhancement Technique
Image enhancement using fuzzy technique involves three major steps:
i. Image Fuzzification
ii. Membership Function Modification iii. Image Defuzzification
Fig. 1. Steps in Fuzzy im age processing
Image fuzzific ation: Th is is the mapping of each scalar
input by a corresponding fuzzy va lue based on the applicable me mbership function. In other words, it is the transformation of the image data fro m the gray level plane to the membership plane.
Me mbershi p modification: Hav ing transformed the
image data fro m gray-leve l plane to the me mbership plane, ne xt step is to apply appropriate fuzzy techniques to modify the me mbe rship values. This can be a fu zzy clustering, a fuzzy rule-based approach, fuzzy classification approach, a fuzzy aggregation approach among others. In this conte xt, fuzzy rule -based approach was adopted: Firstly, the outputs of all the parts of an antecedent are co mbined to produce a single value using ma x or min operation. An imp lication method is then applied to the single output of the antecedent of each rule to provide a corresponding output to that rule. Finally, aggregation method is applied to the fuzzy sets fro m the imp lication method to yield a single output fuzzy set.
Deffuzification: Outputs from the me mbership
modifications are always fuzzy. To obtain a crisp value therefore, there is need to reverse the process of fuzzification (defu zzificat ion) by applying any of the defuzzy methods such as center of area , inverse me mbe rship function and mean of ma ximu m depending on the fuzzy approach adopted[1][10]. Thus, by computing the center of grav ity of the aggregated fuzzy set, a crisp result is achieved.
2.3 Description of performance tools
The follo wing image measuring tools: Absolute Mean Brightness Error (AMBE), Mean Squared Error (MSE), Peak to Signal Noise Ratio (PSNR) and Entropy were applied to both the HE and Fu zzy enhanced images on two low contrast images (figure2 and figure 3) to ascertain the quality of enhanced image against the original images.
The Me an s quare d err or (MS E): this represents the
cumulat ive squared error between the enhanced image and the original image; the lower the value of M SE, the lower the error. MSE is given as
1
𝑀𝑁∑ ∑(𝑓(𝑖, 𝑗) − 𝑓′(𝑖, 𝑗))2 (5)
𝑗=1
𝑁 𝑖=0
𝑀
In the above equation, M and I represent the number of rows and columns in the input images with inde x i and j respectively. f(i,j) represents the original image at location (i, j) and f’(i,j) represents the degraded image at location (i,j).
Absolute me an brightness error (AMB E) which is
defined as the absolute difference between the input and the output image mean. The expression is given as:
𝐴𝑀𝐵𝐸 = |𝐸(𝑋) − 𝐸(𝑌) (6)
Where E (X) is the mean of the input image and E (Y) is the mean of the output image. Lo wer AMBE indicates that the brightness is better preserved.
Entropy: Entropy is a well-known statistical measure
of randomness that can be used to characterize the texture of the input image. It measures the richness of the details in the output image. Entropy is defined as
− ∑𝑛 𝑝𝑖𝑙𝑜𝑔2𝑝𝑖
𝑖=1 (7)
pi value is the occurrence probability of a given p ixe l.
Higher entropy signifies higher image details preservation.
PSNR: Pea k to signal noise ratio defines the ratio
between the ma ximu m possible power of a signal and the power of corrupting noise that affects the quality of image. PSNR represents a measure of the peak error.
𝑃𝑆𝑁𝑅 = 10𝑙𝑜𝑔10
(𝐿 − 1)2
𝑀𝑆𝐸 (8)
Where MSE is the mean squared error and L is the number of d iscrete gray levels. The greater the PSNR value, the better the output image quality. That is, higher value of PSNR indicates that the reconstruction is of higher quality.
Fig. 2. Low contrast im age1
3. RESULTS AND DISCUSSION
This section presents the performance of HE and fu zzy algorith ms on low contrast images using the qualitative performance measures stated in section 2.3. The performance evaluation was carried out in Matlab 7.1b. Table 1 shows data obtained from the evaluation .
Fig. 3. Low contrast im age2
Table 1: Sum m ary of results
MSE PSNR Entropy AMBE
Image 1
HE 2813.79 13.67 4.7082 30.4847
Fuzzy 2511.28 14.17 4.7935 14.7786
Image 2
HE 4398.53 11.73 4.1760 25.1072
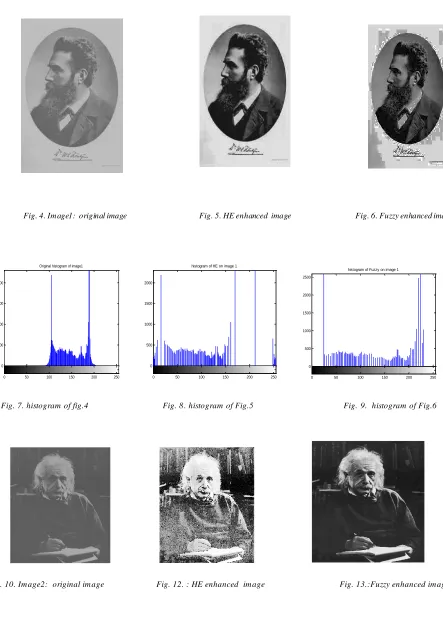
Fig. 4. Im age1: original image Fig. 5. HE enhanced image Fig. 6. Fuzzy enhanced image
Fig. 7. histogram of fig.4 Fig. 8 . histogram of Fig.5 Fig. 9. histogram of Fig.6
Fig. 10. Im age2: original im age Fig. 12. : HE enhanced im age Fig. 13.:Fuzzy enhanced im age
0 500 1000 1500 2000
Original histogram of image1
0 50 100 150 200 250
0 500 1000 1500 2000
histogram of HE on image 1
0 50 100 150 200 250
0 500 1000 1500 2000 2500
histogram of Fuzzy on image 1
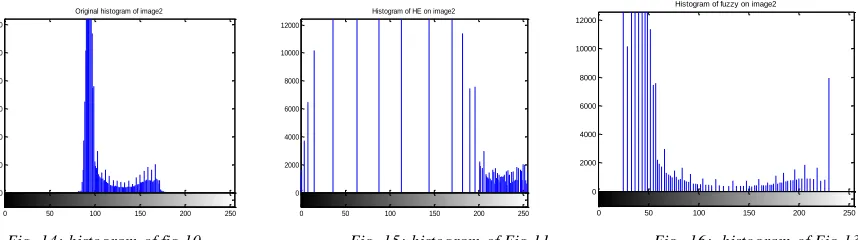
Fig. 14: histogram of fig.10 Fig. 15: histogram of Fig.11 Fig. 16: histogram of Fig.13
Using two low contrast images: image1 (figure4) and image2 (figure 5) as shown above; concentration of pixels in the middle of the original histogram of image1 and image 2 is an indication that they are of low contrast. Pixels in the histogram of image 1 using HE(fig.5) a re not evenly distributed over the gray scale unlike the use of fu zzy (fig.6), thus characteristics of the origina l image are more preserved with the fuzzy technique. Simila rly, histogram of image 2. with the use of HE(fig.15) has its bright leve ls being moved right, thereby brightening the image more when compared with the use of fuzzy(fig.16).
4. CONCLUSIONS
Expe rimental results show that the application of fu zzy technique to image1(figure4) produced an image that contains lower mean squared error, higher peak to signal ratio, h igher entropy and higher absolute mean brightness error than the image of HE. Thus output image fro m fuzzy results in less error, constructed image of h igher quality, higher image details preservation and better brightness preservation than the image fro m HE. Again, for image2, output image of the fuzzy technique is of less error, higher image quality, h igher image details preservation but lower brightness preservation than the image of the HE. Visually, it can be seen that some artifacts were introduced in image 1 when HE was applied and some details in image 2 like details on the fore head were also lost in image2 with the use of HE. However, brightness preservation in image 2 with the use of HE was higher than that obtained with fuzzy technique. Thus no technique is perfectly suitable for a ll enhancement cases but each technique is subject to the need of the system in question.
REFERENCES
[1] Gonzalez R. and Woods R.: Digital Image Processing. (3rd ed.) Prentice hall, 2008.
[2] Deepika B., Renu B., and Vinod S. “Digital Image Enhancement by Improving Contrast, Removal of Noise and Motion Blurring”, International Journal of Innovative Research in Science, Engineering and technology, vol 4, No.4, 2015, pp. 2601 2606. DOI: 10.15680/IJIRSET.2015.0404094
[3] Sapana S. and Vijaya K.. “Use of Histogram Equalization In Image Processing For Image Enhancement”, International Journal of Software Engineering Research & Practices vol1, No.2, 2011 [4] Jaspreet K. and Amandeep K.. “Image Contrast
Enhancement method based on Fuzzy Logic and Histogram Equalization”, International Research Journal of Engineering and Technology (IRJET), vol3, No.5,2016, pp. 3089-3096.
[5] Kim Y. , “Contrast enhancement using brightness preserving bi-histogram equalization”, IEEE Transactions On Consumer Electronics, vol 43, No. 1, 1997, pp.1-8.
[6] Soong-Der C. and Ramli A. “M inimum M ean brightness error bi-histogram equalization in contrast enhancement”, IEEE Transactions on Consumer Electronics vol 49, No.4, 2003, pp. 1310 – 1319. DOI: 10.1109/TCE.2003.1261234
[7] Shefali G. and Yadwinder K.. “Review of Different Local and Global Contrast Enhancement Techniques for a Digital Image”, International Journal of Computer Applications, vol.100, No.18, 2014, pp. 18 – 23.
[8] Reshmalakshmi C. Sasikumar M . and Shiny G. “Fuzzy Transform for Low-contrast Image Enhancement”, International Journal of Applied Engineering Research, vol.13, No.11,2018, pp. 9103– 9108
[9] M amoria P. and Raj D. , “An Optimized M ultiple Fuzzy M embership Functions based Image Contrast Enhancement Technique”: KSII Transactions on Internet & Information Systems, vol. 12, No.3,2018, pp.1206-1223.
[10]Tizhoosh, R. and HauBecker H . “Fuzzy Image Processing”, Handbook of Computer Vision and Applications, vol.2, 1999, pp. 549-556. DOI: 10.1016/B978-012379777-3/50017-0. 0 2000 4000 6000 8000 10000 12000
Original histogram of image2
0 50 100 150 200 250
0 2000 4000 6000 8000 10000 12000
Histogram of HE on image2
0 50 100 150 200 250
0 2000 4000 6000 8000 10000 12000
Histogram of fuzzy on image2
[11]Sundaram M ., Ramar K., Arumugam N. and Prabin G. (2011). “Histogram Modified Local Contrast Enhancement for Mammogram Images”, Applied Soft Computing, vol.11, No.8,2011,pp. 5809-5816. [12]Vinod K. and Rahul R., “A Comparative Analysis of
Image Contrast Enhancement Techniques based on Histogram Equalization for Gray Scale Static Images”, International Journal of Computer Applications, vol.45, No.21, 2012