Direct effects on scenarios and types of path
analyses in corn hybrids
M. Toebe1, A. Cargnelutti Filho2, L. Storck2 and A.D. Lúcio2
1Universidade Federal do Pampa, Campus Itaqui, Itaqui, RS, Brasil 2Departamento de Fitotecnia, Universidade Federal de Santa Maria, Santa Maria, RS, Brasil
Corresponding author: A. Cargnelutti Filho E-mail: [email protected]
Genet. Mol. Res. 16 (1): gmr16019529 Received November 9, 2016
Accepted February 16, 2017 Published March 30, 2017
DOI http://dx.doi.org/10.4238/gmr16019529
Copyright © 2017 The Authors. This is an open-access article distributed under the terms of the Creative Commons Attribution ShareAlike (CC BY-SA) 4.0 License.
scenarios and the variables EL and ED had stronger direct effects on YIELD in the other scenarios regardless of hybrid or harvest. The use of the ninth scenario of path analysis is recommended regardless of hybrid and harvest given the ease of explanatory variable measurement (EIH, EL, and ED), the low degree of multicollinearity and the good prediction of the path analysis (R2≥ 0.78).
Key words:Zea mays L.; Linear relationships; Indirect selection
INTRODUCTION
Corn is the cereal with the highest volume of production worldwide (FAO, 2014). The increase in corn grain yield observed in recent decades is equally attributable to improvements in management and to genetic breeding (Duvick, 2005). Plant selection in genetic breeding for the purpose of increasing grain yield may be performed directly by selecting plants with greater production potential or indirectly by studying linear relationships between traits (variables). The study of linear relationships between traits is recommended when the trait of interest displays low heritability, is difficult to measure or when seeking early or simultaneous selection for more than one trait (Cruz and Regazzi, 1997; Cruz and Carneiro, 2006).
The Pearson correlation coefficient (r), which measures the direction and intensity of the linear relationship between two random variables, may be used for studying linear relationships between traits (Cruz, 2005; Ferreira, 2009). The use of methods complementary to linear correlations is recommended when a set of variables is studied simultaneously (Cruz and Regazzi, 1997; Cruz and Carneiro, 2006). Path analysis is recommended for this purpose because it allows partitioning of the correlation coefficients into direct and indirect effects on the main variable (Wright, 1934; Cruz and Regazzi, 1997; Cruz and Carneiro, 2006). Variables with a strong association measured using the linear correlation coefficient and with direct effects of the same intensity and direction are considered cause and effect variables and are indicated for the indirect selection of plants (Cruz and Regazzi, 1997; Cruz and Carneiro, 2006).
Path analysis has been widely used in studies of linear relationships between traits and for indirect selection of corn plants (Wang et al., 1999; Carvalho et al., 2001; Ahmad and Saleem, 2003; Mohammadi et al., 2003; El-Shouny et al., 2005; Samonte et al., 2005; Jayakumar et al., 2007; Lopes et al., 2007; Nemati et al., 2009; Bello et al., 2010; Khalily et al., 2010; Khayatnezhad et al., 2010; Kumar et al., 2011; Hefny, 2011; Moradi and Azarpour, 2011; Parimala et al., 2011; Selvaraj and Nagarajan, 2011; Sreckov et al., 2011; Munawar et al., 2013; Pudjiwati et al., 2013; Shiri et al., 2013; Toebe and Cargnelutti Filho, 2013; Badu-Apraku et al., 2012, 2014; Rigon et al., 2014; Teodoro et al., 2014). Variability in the magnitude and sign of the direct effects of explanatory variables on the main variable has been found in various studies conducted with corn using the path analysis method, resulting in different interpretations.
Thus, the objectives of this study were to estimate the direct effects of explanatory variables on the grain yield of corn in the combinations formed by three types of hybrids x two harvests x nine scenarios of explanatory variables x two types of path analyses.
MATERIAL AND METHODS
(first experiment) and 2009/2010 (second experiment) harvests in the experimental area of the Department of Plant Science, Federal University of Santa Maria (Universidade Federal de Santa Maria - UFSM) (29°42'S, 53°49'W, altitude 95 m), Santa Maria, State of Rio Grande do Sul, Brazil. In the first experiment, four plots were sown with the single-cross hybrid P32R21, four with the triple-cross hybrid DKB566, and four with the double-cross hybrid DKB747 on December 26, 2008. In the second experiment, sixteen plots were sown with the single-cross hybrid 30F53, sixteen with the triple-cross hybrid DKB566 and sixteen with the double-cross hybrid DKB747 on October 26, 2009.
Each plot consisted of four 6-m long rows spaced 0.80 m apart, and the density was set at five plants per linear meter, equivalent to 62,500 plants/ha. Therefore, each plot consisted of 120 plants, totaling 1440 plants in the first experiment (3 hybrids x 4 plots/hybrid x 120 plants/ plot) and 5760 plants in the second experiment (3 hybrids x 16 plots/hybrid x 120 plants/ plot). At each harvest, the single-, triple-, and double-cross hybrid plots were randomized in the experimental area. In both experiments, the fertilization applied at planting was 750 kg/ha granular fertilizer 3-24-18 (NPK) and a top-dressing fertilization consisted of 300 kg/ha urea with 45% N. Other crop treatments were also performed according to the recommendations for corn (Fancelli and Dourado Neto, 2004).
In the first experiment conducted during the 2008/2009 harvest, 361, 373, and 416 plants of the single-, triple-, and double-cross hybrids were evaluated, respectively. In the second experiment conducted during the 2009/2010 harvest 1777, 1693, and 1720 plants of the single-, triple-, and double-cross hybrids were evaluated, respectively. Thus, a total of 6340 plants were evaluated. The following explanatory variables were measured in each of the 6340 plants evaluated: plant height at harvest (PH), ear insertion height (EIH), ear weight (EW), number of grain rows per ear (NR), ear length (EL), ear diameter (ED), cob weight (CW), cob diameter (CD), 100-grain mass (HGM), number of grains per ear (NGE) and grain length (GL). The main variable grain yield (YIELD) was also measured in each plant. Only plants exhibiting all traits described above were evaluated. Therefore, the final number of plants evaluated at each harvest differed among the single-, triple-, and double-cross hybrids.
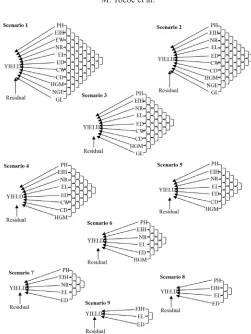
Next, nine scenarios were planned to conduct traditional and ridge path analyses; these scenarios differed from each other regarding the number of variables excluded before performing the path analysis. Thus, 0, 1, 2, 3, 4, 5, 6, 7, and 8 explanatory variables were excluded from scenarios 1, 2, 3, 4, 5, 6, 7, 8, and 9, respectively, before performing the path analysis. Explanatory variables with a greater variance inflation factor (VIF) (Carvalho and Cruz, 1996; Fávero et al., 2009; Hair et al., 2009) and those that are difficult to measure were priority excluded. Therefore, 11 explanatory variables in scenario 1 (PH, EIH, EW, NR, EL, ED, CW, CD, HGM, NGE, and GL), 10 in scenario 2 (PH, EIH, NR, EL, ED, CW, CD, HGM, NGE, and GL), 9 in scenario 3 (PH, EIH, NR, EL, ED, CW, CD, HGM, and NGE), 8 in scenario 4 (PH, EIH, NR, EL, ED, CW, CD, and HGM), 7 in scenario 5 (PH, EIH, NR, EL, ED, CD, and HGM), 6 in scenario 6 (PH, EIH, NR, EL, ED, and HGM), 5 in scenario 7 (PH, EIH, NR, EL, and ED), 4 in scenario 8 (PH, EIH, EL, and ED), and 3 explanatory variables in scenario 9 (EIH, EL, and ED) were analyzed when conducting the path analysis (Figure 1).
were estimated using the system of normal equations
X X
'
β
ˆ
=
'
X Y
(Wright, 1934; Cruz and Regazzi, 1997; Cruz and Carneiro, 2006). The coefficient of determination of the traditional path analysis (R2) was also calculated for each hybrid, harvest, and scenario, and the diagnosis of multicollinearity was performed between the explanatory variables. For that purpose, the condition number (CN), which is the ratio between the largest and smallest eigenvalues of the correlation matrix X’X, was used as the diagnosis method (Cruz and Carneiro, 2006; Gujarati, 2006). Multicollinearity was considered weak when CN < 100, moderate to severe when 100≤ CN ≤ 1000, and severe when CN > 1000 (Montgomery and Peck, 1982).
A ridge path analysis was also performed for each hybrid, harvest and scenario using a single causal diagram after adding a k value to the diagonal of the correlation matrix X’X (Carvalho et al., 2001; Cruz and Carneiro, 2006). For this purpose, the choice of the k value was made by adding k = 0 to the diagonal of the X’X matrix, with subsequent diagnosis of multicollinearity. Next, in cases of moderate to severe or severe multicollinearity (CN ≥
100), new k values were tested, in ascending order, by adding a value equal to 0.0001 at
each step and assessing the degree of multicollinearity. Thus, to perform the ridge path analysis for each hybrid, harvest and scenario, the smallest k value in the interval from 0
≤ k ≤ 1 sufficient to reduce CN to a value below 100, contributing to stabilizing the direct and indirect effects of the path analysis (Carvalho et al., 2001; Cruz and Carneiro, 2006), was used. Then, this k value was added to the diagonal of the correlation matrix X’X, and the estimate of the direct and indirect (data not shown) effects of the ridge path analysis was conducted using the system
( '
X X k
+
) '
β
ˆ
=
X Y
(Carvalho et al., 2001; Cruz and Carneiro, 2006). The coefficient of determination of the ridge path analysis (R2) was also calculated, and the k value and condition number obtained after the addition of the value k for each hybrid, harvest and scenario were shown. In the cases where the value k = 0 was used in the ridge path analysis, the direct and indirect effects and the R2 assessed were equal to those assessed in the traditional path analysis for the same combination (hybrid, harvest and scenario). All statistical analyses were performed using the software R (R Development Core Team, 2016) and Microsoft Office Excel®.RESULTS
The traditional path analysis, performed based on 11 explanatory variables (scenario 1), indicated that only the EW variable had high-magnitude direct effects on YIELD (1.06 ≤
direct effect ≤ 1.21), regardless of hybrid or harvest (Tables 1 to 3). The other explanatory variables in this scenario and type of analysis had low-magnitude of direct effects on YIELD (-0.26 ≤ direct effect ≤ 0.00) for all hybrid levels and in both harvests. However, the traditional path analysis was performed with a severe degree of multicollinearity between explanatory variables in this first scenario in all hybrids and harvests (566987793 ≤ CN ≤ 636038367), which may have resulted in inaccurate estimation of the direct and indirect (data not shown) effects. Furthermore, direct effect values above |1| were also indicative of issues caused by the multicollinearity between explanatory variables.
The addition of a k value (0.0573 ≤ k ≤ 0.0643) to the diagonal of the correlation matrix X’X was efficient in reducing the degree of multicollinearity (99.89 ≤ NC ≤ 99.99) between the eleven explanatory variables of the first scenario in all hybrids and harvests (Tables 1 to 3). In this scenario, the ridge path analysis indicated that EW was the variable with the strongest direct effect on YIELD (0.39 ≤ direct effect ≤ 0.50). However, unlike in the traditional path analysis, the magnitudes of the direct effects were lower than |1|, indicating that possible errors of estimation caused by multicollinearity were circumvented. Furthermore, other explanatory variables, including NGE (0.33 ≤ direct effect ≤ 0.40) and HGM (0.12 ≤ direct effect ≤ 0.18), began displaying positive direct effects on YIELD. Thus, based on the ridge path analysis performed in the first scenario, the variables EW, NGE and HGM had the strongest direct effects on YIELD, and this pattern was observed in the single-, triple- and double-cross hybrids in 2008/2009 and 2009/2010 harvests (Tables 1 to 3).
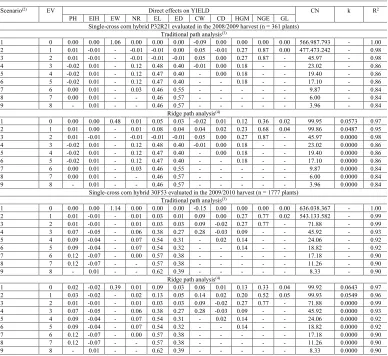
Table 1. Direct effects of explanatory variables(1) on grain yield (YIELD), condition number (CN), k value (k) and
coefficient of determination (R2) of each path analysis scenario with the respective number of excluded variables (EV)
in the single-cross corn hybrids P32R21 and 30F53 evaluated in the 2008/2009 and 2009/2010 harvests, respectively.
Scenario(2) EV Direct effects on YIELD CN k R2
PH EIH EW NR EL ED CW CD HGM NGE GL Single-cross corn hybrid P32R21 evaluated in the 2008/2009 harvest (n = 361 plants)
Traditional path analysis(3)
1 0 0.00 0.00 1.06 0.00 0.00 0.00 -0.09 0.00 0.00 0.00 0.00 566.987.793 - 1.00 2 1 0.01 -0.01 - -0.01 -0.01 0.00 0.05 -0.01 0.27 0.87 0.00 477.473.242 - 0.98 3 2 0.01 -0.01 - -0.01 -0.01 -0.01 0.05 0.00 0.27 0.87 - 45.97 - 0.98 4 3 -0.02 0.01 - 0.12 0.48 0.40 -0.01 0.00 0.18 - - 23.02 - 0.86 5 4 -0.02 0.01 - 0.12 0.47 0.40 - 0.00 0.18 - - 19.40 - 0.86 6 5 -0.02 0.01 - 0.12 0.47 0.40 - - 0.18 - - 17.10 - 0.86 7 6 0.00 0.01 - 0.03 0.46 0.55 - - - 9.87 - 0.84 8 7 0.00 0.01 - - 0.46 0.57 - - - 6.00 - 0.84 9 8 - 0.01 - - 0.46 0.57 - - - 3.96 - 0.84
Ridge path analysis(4)
1 0 0.00 0.00 0.48 0.01 0.05 0.03 -0.02 0.01 0.12 0.36 0.02 99.95 0.0573 0.97 2 1 0.01 0.00 - 0.01 0.08 0.04 0.04 0.02 0.23 0.68 0.04 99.86 0.0487 0.95 3 2 0.01 -0.01 - -0.01 -0.01 -0.01 0.05 0.00 0.27 0.87 - 45.97 0.0000 0.98 4 3 -0.02 0.01 - 0.12 0.48 0.40 -0.01 0.00 0.18 - - 23.02 0.0000 0.86 5 4 -0.02 0.01 - 0.12 0.47 0.40 - 0.00 0.18 - - 19.40 0.0000 0.86 6 5 -0.02 0.01 - 0.12 0.47 0.40 - - 0.18 - - 17.10 0.0000 0.86 7 6 0.00 0.01 - 0.03 0.46 0.55 - - - 9.87 0.0000 0.84 8 7 0.00 0.01 - - 0.46 0.57 - - - 6.00 0.0000 0.84 9 8 - 0.01 - - 0.46 0.57 - - - 3.96 0.0000 0.84
Single-cross corn hybrid 30F53 evaluated in the 2009/2010 harvest (n = 1777 plants) Traditional path analysis(3)
1 0 0.00 0.00 1.14 0.00 0.00 0.00 -0.15 0.00 0.00 0.00 0.00 636.038.367 - 1.00 2 1 0.01 -0.01 - 0.01 0.03 0.01 0.09 0.00 0.27 0.77 0.02 543.133.582 - 0.99 3 2 0.01 -0.01 - 0.01 0.03 0.03 0.09 -0.02 0.27 0.77 - 71.88 - 0.99 4 3 0.07 -0.05 - 0.06 0.38 0.27 0.28 -0.03 0.09 - - 45.92 - 0.93 5 4 0.09 -0.04 - 0.07 0.54 0.31 - 0.02 0.14 - - 24.06 - 0.92 6 5 0.09 -0.04 - 0.07 0.54 0.32 - - 0.14 - - 18.82 - 0.92 7 6 0.12 -0.07 - 0.00 0.57 0.38 - - - 17.18 - 0.90 8 7 0.12 -0.07 - - 0.57 0.38 - - - 11.26 - 0.90 9 8 - 0.01 - - 0.62 0.39 - - - 8.33 - 0.90
Ridge path analysis(4)
1 0 0.02 -0.02 0.39 0.01 0.09 0.03 0.06 0.01 0.13 0.33 0.04 99.92 0.0643 0.97 2 1 0.03 -0.02 - 0.02 0.13 0.05 0.14 0.02 0.20 0.52 0.05 99.93 0.0549 0.96 3 2 0.01 -0.01 - 0.01 0.03 0.03 0.09 -0.02 0.27 0.77 - 71.88 0.0000 0.99 4 3 0.07 -0.05 - 0.06 0.38 0.27 0.28 -0.03 0.09 - - 45.92 0.0000 0.93 5 4 0.09 -0.04 - 0.07 0.54 0.31 - 0.02 0.14 - - 24.06 0.0000 0.92 6 5 0.09 -0.04 - 0.07 0.54 0.32 - - 0.14 - - 18.82 0.0000 0.92 7 6 0.12 -0.07 - 0.00 0.57 0.38 - - - 17.18 0.0000 0.90 8 7 0.12 -0.07 - - 0.57 0.38 - - - 11.26 0.0000 0.90 9 8 - 0.01 - - 0.62 0.39 - - - 8.33 0.0000 0.90
(1)PH: plant height at harvest; EIH: ear insertion height; EW: ear weight; NR: number of grain rows per ear; EL:
ear length; ED: ear diameter; CW: cob weight; CD: cob diameter; HGM: 100-grain mass; NGE: number of grains per ear; GL: grain length. (2)Scenarios defined in Figure 1. (3)No change in the X’X correlation matrix between
explanatory variables, regardless of the condition number (CN). (4)Path analysis performed after adding a k value to
the diagonal of the X’X correlation matrix, and choosing the smallest k value sufficient to reduce the CN to <100. When the initial CN was <100, k = 0.0000 was added and the ridge path analysis produced the same values found in the traditional path analysis.
A small decrease in predictive ability was also noted in the ridge path analysis for the second scenario (0.94 ≤ R2≤ 0.96) compared to that performed for the first scenario (0.96
≤ R2≤ 0.97) (Tables 1 to 3). The addition of a k value (0.0484 ≤ k ≤ 0.0549) to the diagonal of the X’X correlation matrix in the second scenario was effective in reducing the degree of multicollinearity among the ten explanatory variables (99.83 ≤ CN ≤ 99.97), in all hybrids and harvests (Tables 1 to 3). The explanatory variables NGE (0.52 ≤ direct effect ≤ 0.72) and HGM (0.20 ≤ direct effect ≤ 0.29) had the strongest direct effects on YIELD in this scenario.
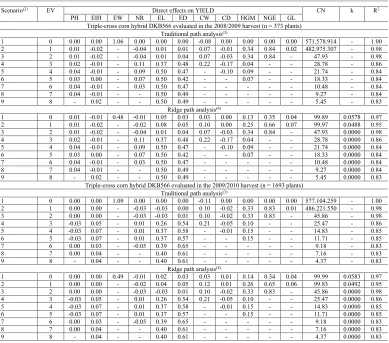
Table 2. Direct effects of explanatory variables(1) on grain yield (YIELD), condition number (CN), k value (k)
and coefficient of determination (R2) of each path analysis scenario with the respective number of excluded
variables (EV) in the triple-cross corn hybrid DKB566 evaluated in the 2008/2009 and 2009/2010 harvests. Scenario(2) EV Direct effects on YIELD CN k R2
PH EIH EW NR EL ED CW CD HGM NGE GL Triple-cross corn hybrid DKB566 evaluated in the 2008/2009 harvest (n = 373 plants)
Traditional path analysis(3)
1 0 0.00 0.00 1.06 0.00 0.00 0.00 -0.08 0.00 0.00 0.00 0.00 571.578.914 - 1.00 2 1 0.01 -0.02 - -0.04 0.01 0.01 0.07 -0.01 0.34 0.84 0.02 482.975.307 - 0.98 3 2 0.01 -0.02 - -0.04 0.01 0.04 0.07 -0.03 0.34 0.84 - 47.93 - 0.98 4 3 0.02 -0.01 - 0.11 0.37 0.48 0.22 -0.17 0.04 - - 28.78 - 0.86 5 4 0.04 -0.01 - 0.09 0.50 0.47 - -0.10 0.09 - - 21.74 - 0.84 6 5 0.03 0.00 - 0.07 0.50 0.42 - - 0.07 - - 18.33 - 0.84 7 6 0.04 -0.01 - 0.03 0.50 0.47 - - - 10.48 - 0.84 8 7 0.04 -0.01 - - 0.50 0.49 - - - 9.27 - 0.84 9 8 - 0.02 - - 0.50 0.49 - - - 5.45 - 0.83
Ridge path analysis(4)
1 0 0.01 -0.01 0.48 -0.01 0.05 0.03 0.03 0.00 0.13 0.35 0.04 99.89 0.0578 0.97 2 1 0.01 -0.02 - -0.02 0.08 0.05 0.10 0.00 0.25 0.66 0.07 99.97 0.0488 0.95 3 2 0.01 -0.02 - -0.04 0.01 0.04 0.07 -0.03 0.34 0.84 - 47.93 0.0000 0.98 4 3 0.02 -0.01 - 0.11 0.37 0.48 0.22 -0.17 0.04 - - 28.78 0.0000 0.86 5 4 0.04 -0.01 - 0.09 0.50 0.47 - -0.10 0.09 - - 21.74 0.0000 0.84 6 5 0.03 0.00 - 0.07 0.50 0.42 - - 0.07 - - 18.33 0.0000 0.84 7 6 0.04 -0.01 - 0.03 0.50 0.47 - - - 10.48 0.0000 0.84 8 7 0.04 -0.01 - - 0.50 0.49 - - - 9.27 0.0000 0.84 9 8 - 0.02 - - 0.50 0.49 - - - 5.45 0.0000 0.83
Triple-cross corn hybrid DKB566 evaluated in the 2009/2010 harvest (n = 1693 plants) Traditional path analysis(3)
1 0 0.00 0.00 1.09 0.00 0.00 0.00 -0.11 0.00 0.00 0.00 0.00 577.104.259 - 1.00 2 1 0.00 0.00 - -0.03 -0.03 0.00 0.10 -0.02 0.33 0.83 0.01 486.221.550 - 0.98 3 2 0.00 0.00 - -0.03 -0.03 0.01 0.10 -0.02 0.33 0.83 - 45.86 - 0.98 4 3 -0.03 0.05 - 0.01 0.26 0.54 0.21 -0.05 0.10 - - 25.47 - 0.86 5 4 -0.03 0.07 - 0.01 0.37 0.58 - -0.01 0.15 - - 14.83 - 0.85 6 5 -0.03 0.07 - 0.01 0.37 0.57 - - 0.15 - - 11.71 - 0.85 7 6 0.00 0.03 - -0.05 0.39 0.65 - - - 9.18 - 0.83 8 7 0.00 0.04 - - 0.40 0.61 - - - 7.16 - 0.83 9 8 - 0.04 - - 0.40 0.61 - - - 4.37 - 0.83
Ridge path analysis(4)
1 0 0.00 0.00 0.49 -0.01 0.02 0.03 0.03 0.01 0.14 0.34 0.04 99.99 0.0583 0.97 2 1 0.00 0.00 - -0.02 0.04 0.05 0.12 0.01 0.26 0.65 0.06 99.83 0.0492 0.95 3 2 0.00 0.00 - -0.03 -0.03 0.01 0.10 -0.02 0.33 0.83 - 45.86 0.0000 0.98 4 3 -0.03 0.05 - 0.01 0.26 0.54 0.21 -0.05 0.10 - - 25.47 0.0000 0.86 5 4 -0.03 0.07 - 0.01 0.37 0.58 - -0.01 0.15 - - 14.83 0.0000 0.85 6 5 -0.03 0.07 - 0.01 0.37 0.57 - - 0.15 - - 11.71 0.0000 0.85 7 6 0.00 0.03 - -0.05 0.39 0.65 - - - 9.18 0.0000 0.83 8 7 0.00 0.04 - - 0.40 0.61 - - - 7.16 0.0000 0.83 9 8 - 0.04 - - 0.40 0.61 - - - 4.37 0.0000 0.83
(1)PH: plant height at harvest; EIH: ear insertion height; EW: ear weight; NR: number of grain rows per ear; EL:
ear length; ED: ear diameter; CW: cob weight; CD: cob diameter; HGM: 100-grain mass; NGE: number of grains per ear; GL: grain length. (2)Scenarios defined in Figure 1. (3)No change in the X’X correlation matrix between
explanatory variables, regardless of the condition number (CN). (4)Path analysis performed after adding a k value to
Conversely, the variables CW (0.04 ≤ direct effect ≤ 0.14) and EL (0.03 ≤ direct effect ≤
0.13) and the other explanatory variables (PH, EIH, NR, ED, CD, and GL) had only weak direct effects on YIELD. Therefore, the variables NGE and HGM had the strongest direct effects on YIELD in the second scenario, regardless of hybrid, harvest, or type of path analysis (traditional or ridge) and thus should be preferentially used for the indirect selection of the highest yielding plants in this scenario.
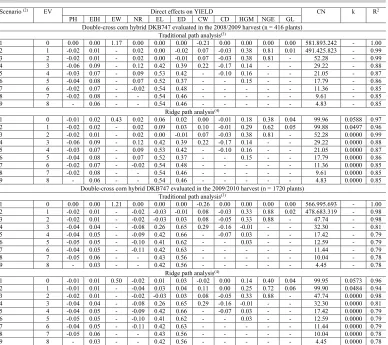
(1)PH: plant height at harvest; EIH: ear insertion height; EW: ear weight; NR: number of grain rows per ear; EL:
ear length; ED: ear diameter; CW: cob weight; CD: cob diameter; HGM: 100-grain mass; NGE: number of grains per ear; GL: grain length. (2)Scenarios defined in Figure 1. (3)No change in the X’X correlation matrix between
explanatory variables, regardless of the condition number (CN). (4)Path analysis performed after adding a k value to
the diagonal of the X’X correlation matrix, and choosing the smallest k value sufficient to reduce the CN to <100. When the initial CN was <100, k = 0.0000 was added and the ridge path analysis produced the same values found in the traditional path analysis.
Table 3. Direct effects of explanatory variables(1) on grain yield (YIELD), condition number (CN), k value (k)
and coefficient of determination (R2) of each path analysis scenario with the respective number of excluded
variables (EV) in the double-cross corn hybrid DKB747 evaluated in the 2008/2009 and 2009/2010 harvests. Scenario (2) EV Direct effects on YIELD CN k R2
PH EIH EW NR EL ED CW CD HGM NGE GL Double-cross corn hybrid DKB747 evaluated in the 2008/2009 harvest (n = 416 plants)
Traditional path analysis(3)
1 0 0.00 0.00 1.17 0.00 0.00 0.00 -0.21 0.00 0.00 0.00 0.00 581.893.242 - 1.00 2 1 -0.02 0.01 - 0.02 0.00 -0.02 0.07 -0.03 0.38 0.81 0.01 491.425.823 - 0.99 3 2 -0.02 0.01 - 0.02 0.00 -0.01 0.07 -0.03 0.38 0.81 - 52.28 - 0.99 4 3 -0.06 0.09 - 0.12 0.42 0.39 0.22 -0.17 0.14 - - 29.22 - 0.88 5 4 -0.03 0.07 - 0.09 0.53 0.42 - -0.10 0.16 - - 21.05 - 0.87 6 5 -0.04 0.08 - 0.07 0.52 0.37 - - 0.15 - - 17.79 - 0.86 7 6 -0.02 0.07 - -0.02 0.54 0.48 - - - 11.36 - 0.85 8 7 -0.02 0.08 - - 0.54 0.46 - - - 9.61 - 0.85 9 8 - 0.06 - - 0.54 0.46 - - - 4.83 - 0.85
Ridge path analysis(4)
1 0 -0.01 0.02 0.43 0.02 0.06 0.02 0.00 -0.01 0.18 0.38 0.04 99.96 0.0588 0.97 2 1 -0.02 0.02 - 0.02 0.09 0.03 0.10 -0.01 0.29 0.62 0.05 99.88 0.0497 0.96 3 2 -0.02 0.01 - 0.02 0.00 -0.01 0.07 -0.03 0.38 0.81 - 52.28 0.0000 0.99 4 3 -0.06 0.09 - 0.12 0.42 0.39 0.22 -0.17 0.14 - - 29.22 0.0000 0.88 5 4 -0.03 0.07 - 0.09 0.53 0.42 - -0.10 0.16 - - 21.05 0.0000 0.87 6 5 -0.04 0.08 - 0.07 0.52 0.37 - - 0.15 - - 17.79 0.0000 0.86 7 6 -0.02 0.07 - -0.02 0.54 0.48 - - - 11.36 0.0000 0.85 8 7 -0.02 0.08 - - 0.54 0.46 - - - 9.61 0.0000 0.85 9 8 - 0.06 - - 0.54 0.46 - - - 4.83 0.0000 0.85
Double-cross corn hybrid DKB747 evaluated in the 2009/2010 harvest (n = 1720 plants) Traditional path analysis(3)
1 0 0.00 0.00 1.21 0.00 0.00 0.00 -0.26 0.00 0.00 0.00 0.00 566.995.693 - 1.00 2 1 -0.02 0.01 - -0.02 -0.03 -0.01 0.08 -0.03 0.33 0.88 0.02 478.683.319 - 0.98 3 2 -0.02 0.01 - -0.02 -0.03 0.03 0.08 -0.05 0.33 0.88 - 47.74 - 0.98 4 3 -0.04 0.04 - -0.08 0.26 0.65 0.29 -0.16 -0.01 - - 32.30 - 0.81 5 4 -0.04 0.05 - -0.09 0.42 0.66 - -0.07 0.03 - - 17.42 - 0.79 6 5 -0.05 0.05 - -0.10 0.41 0.62 - - 0.03 - - 12.59 - 0.79 7 6 -0.04 0.05 - -0.11 0.42 0.63 - - - 11.44 - 0.79 8 7 -0.05 0.06 - - 0.43 0.56 - - - 10.04 - 0.78 9 8 - 0.03 - - 0.42 0.56 - - - 4.45 - 0.78
Ridge path analysis(4)
In addition to EW, which was previously excluded in the second scenario, the variable GL was excluded from the third scenario, considering the difficulty in measuring this variable and the high VIF values, indicating collinearity with other explanatory variables including ED and CD. A significant reduction in multicollinearity occurred after excluding both EW and GL, and the CN between the remaining nine explanatory variables (PH, EIH, NR, EL, ED, CW, CD, HGM, and NGE) decreased to values below 100 in all hybrids and both harvests (45.86 ≤
CN ≤ 71.88). In the third scenario and in subsequent scenarios, k = 0 was applied to perform the ridge path analysis. Therefore, the direct effect and R2 values of the ridge path analysis equaled those of the traditional path analysis for a given hybrid, harvest, and scenario (from the third to the ninth scenario) (Tables 1 to 3). In the third scenario, the loss of predictive ability after the exclusion of EW and GL was minimal for all hybrids in both harvests (0.98
≤ R2≤ 0.99). The variables NGE (0.77 ≤ direct effect ≤ 0.88) and HGM (0.27 ≤ direct effect
≤ 0.38) again had the strongest direct effects on YIELD in this scenario, and the direct effects of the other variables were of small magnitudes. Thus, based on the first three scenarios, the variables NGE and HGM, in this order, and EW in the first scenario were the variables with cause-and-effect relationships with YIELD and should be considered for the indirect selection of the highest yielding plants.
In the fourth scenario, the explanatory variable NGE was excluded in addition to EW and GL, already excluded in the previous scenarios. NGE was selected primarily because of the difficulty of measuring NGE and its greater VIF value, and multicollinearity decreased compared to the previous scenario in all hybrids and harvests (23.02 ≤ CN ≤ 45.92) (Tables 1 to 3). However, because NGE had strong direct effects on YIELD in the first three scenarios, its exclusion from the fourth scenario considerably reduced the predictive ability of the path analysis (0.81 ≤ R2≤ 0.93) compared to the previous scenario (0.98 ≤ R2≤ 0.99) in all hybrids and harvests. The explanatory variables ED (0.27 ≤ direct effect ≤ 0.65) and EL (0.26 ≤ direct effect ≤ 0.48) had the strongest direct effects on YIELD in the fourth scenario, followed by the variables CW (-0.01 ≤ direct effect ≤ 0.29) and HGM (-0.01 ≤ direct effect ≤ 0.18). Conversely, the variables NR (-0.08 ≤ direct effect ≤ 0.12), PH (-0.06 ≤ direct effect ≤ 0.07), EIH (-0.05 ≤
direct effect ≤ 0.09), and CD (-0.17 ≤ direct effect ≤ 0.00) had weak direct effects and are not variables with cause-and-effect relationships with YIELD (Cruz and Regazzi, 1997; Cruz and Carneiro, 2006).
In the fifth scenario, the variable CW was excluded in addition to the variables already excluded in previous scenarios based on the difficulty of measuring this variable and its degree of association with the other explanatory variables. A reduction of the degree of multicollinearity in all hybrids of both harvests (14.83 ≤ CN ≤ 24.06) and a small reduction in the path coefficients (0.79 ≤ R2≤ 0.92) occurred in this scenario (Tables 1 to 3). The explanatory variables ED (0.31 ≤ direct effect ≤ 0.66) and EL (0.37 ≤ direct effect ≤ 0.54) had the strongest direct effects on YIELD, followed by the variable HGM (0.03 ≤ direct effect ≤ 0.18), and the other explanatory variables had weak direct effects (-0.10 ≤ direct effect ≤ 0.12).
For the sixth scenario, all variables already excluded in the previous scenario were excluded as well as the variable CD. In this scenario, the CN decreased in all hybrids and harvests (11.71 ≤ CN ≤ 18.82) without reducing the predictive ability of the path analysis (0.79
In the seventh scenario, the variable HGM was also excluded, considering the difficulty in measuring this variable compared to the remaining variables in the scenario (PH, EIH, NR, EL, and ED). A resulting reduction in the degree of multicollinearity (9.18 ≤ CN ≤ 17.18) and small reduction in the path coefficients (0.79 ≤ R2≤ 0.90) occurred in comparison to the sixth scenario (Tables 1 to 3). As in the three previous scenarios, ED (0.38 ≤ direct effect ≤ 0.65) and EL (0.39 ≤ direct effect ≤ 0.57) had the strongest direct effects on YIELD in all hybrids and both harvests. The other explanatory variables (PH, EIH, and NR) had weak effects (-0.11
≤ direct effect ≤ 0.12) on YIELD.
The exclusion of the NR variable from the eighth scenario contributed to a small reduction in the degree of multicollinearity between the other explanatory variables (6.00 ≤ CN
≤ 11.26) and in the path coefficient (0.78 ≤ R2≤ 0.90) (Tables 1 to 3). In this scenario, ED (0.38
≤ direct effect ≤ 0.61) and EL (0.40 ≤ direct effect ≤ 0.57) again had the strongest direct effects on YIELD in this scenario for all hybrids of both harvests. Finally, only the variables easily measured (EIH, EL, and ED) were retained in the ninth scenario. The predictive ability of the path analysis was good for the single-, triple-, and double-cross hybrids in the 2008/2009 and 2009/2010 harvests (0.78 ≤ R2≤ 0.90), and the degree of multicollinearity was reduced (3.96
≤ CN ≤ 8.33) compared to previous scenarios (Tables 1 to 3). The variables ED (0.39 ≤ direct effect ≤ 0.61) and EL (0.40 ≤ direct effect ≤ 0.62) had the strongest direct effects on YIELD in the ninth scenario, as in scenarios 4 to 8, indicating the cause-and-effect relationships of these two variables with YIELD.
Thus, when all eleven explanatory variables of the path analysis were retained, EW, NGE, and HGM were the most important variables for the indirect selection of the highest yielding plants (Tables 1 to 3). Conversely, NGE and HGM were the most important variables in the indirect selection of the highest yielding plants in the second and third scenarios. Furthermore, the exclusion of the variables EW and GL was sufficient to reduce the degree of multicollinearity in all hybrids and harvests to acceptable levels (CN ≤ 71.88), and no differences between the direct effects of the traditional and ridge path analyses were found from the third to the ninth scenarios. After excluding the variable NGE because of the difficulty of measuring this variable, a reduction in the path coefficient occurred in the fourth to the ninth scenarios. In these scenarios, ED and EL had the strongest direct effects on YIELD, regardless of the type of hybrid or harvest. Thus, the measurement of three to eight explanatory variables in the ninth and fourth scenarios, respectively, failed to significantly increase or reduce the predictive ability of the path analysis. In these scenarios, ED and EL should be preferentially used for the indirect selection of the highest yielding corn plants.
DISCUSSION
EL had the strongest correlation and direct effect on YIELD and may be used alongside EIH and NR in the selection of the highest yielding plants (Selvaraj and Nagarajan, 2011). However, direct effect values (-4.968 ≤ direct effect ≤ 12.038) suggest that the estimation was performed under a high degree of multicollinearity between explanatory variables.
Conducting the traditional path analysis under a high degree of multicollinearity resulted in inconsistent estimates of direct and indirect effects in corn (Carvalho et al., 2001). According to those authors, both the ridge path analysis and the exclusion of variables were effective in reducing the degree of multicollinearity, and the direct effects of ear number and 50-grain weight on YIELD were the strongest in those scenarios. High and inaccurate direct effect values estimated under conditions of high degree of multicollinearity were also noted in other studies with corn (Toebe and Cargnelutti Filho, 2013). According to the authors, the exclusion of variables and the ridge path analysis were effective in reducing the degree of multicollinearity in all experiments evaluated, and strong direct effects of number of plants and prolificacy on YIELD were observed.
Mohammadi et al. (2003) recorded VIF scores higher than 10 for various explanatory variables in corn, including NGE, ED, NR, CD, GL, and EL, when conducting path analysis in a single chain, indicating a greater contribution of those variables for multicollinearity, as recorded in the first two scenarios of the present study. According to Mohammadi et al. (2003), the completion of the sequential path analysis considering three chain diagrams instead of the single diagram reduced the VIF of all explanatory variables. Therefore, the path analysis in sequential diagrams may reduce the effect of multicollinearity on the estimation of direct and indirect effects in path analyses. In the present study, smaller coefficients of determination were found in the ridge path analyses than those estimated in the traditional path analyses in the first two scenarios (Tables 1 to 3). Reduced predictive ability of ridge path analysis compared to traditional path analysis has also been observed in other studies using corn (Cruz and Carneiro, 2006; Toebe and Cargnelutti Filho, 2013).
The strongest direct effects on YIELD were recorded for NGE and HGM in the first three scenarios planned in this study and for EW in the first scenario in both the traditional and ridge path analyses (Tables 1 to 3). The strongest direct effects of ED and EL on YIELD were recorded in the other scenarios, regardless of hybrid or harvest. The strongest direct effects of NGE and HGM on YIELD were also recorded in the single- and triple-cross corn hybrids in studies conducted by Lopes et al. (2007). According to Lopes et al. (2007), only the variable NGE had a high-magnitude direct effect on YIELD in double-cross corn hybrids. In a study developed by Mohammadi et al. (2003) it was verified that the variables HGM and NGE had the strongest direct effects on YIELD, and the variables EL, ED, NR and number of grains per row had direct effects of smaller magnitude. According to Bello et al. (2010), the variables EW and NGE had the strongest direct effects on the YIELD of openly pollinated corn varieties, corroborating the results of the present study for the first scenario of the ridge path analysis. Positive, direct effects of HGM on YIELD, similar to those recorded in the first scenarios of this study, have also been observed in other studies. In a study by Teodoro et al. (2014), it was found that the relationships between variables depend on the type of hybrid (single- or triple-cross). According to the authors, the number of grains per row and HGM had the strongest direct effects on YIELD and were indirectly affected by the variables EL and ED.
corn plants and El-Shouny et al. (2005), verified that ED and EL are the most important variables associated with YIELD. Other studies using path analysis in corn have also reported strong direct effects of EW, NGE, HGM, EL, and ED on YIELD. In the study conducted by Hefny (2011), it was found that EW had the strongest direct effect on YIELD at the appropriate sowing time. The author also noted that EW and ED were the variables with the strongest direct effects on YIELD in late-sown corn. Accordingly, Parimala et al. (2011) verified that the selection of the highest yielding plants may be conducted based on the indirect evaluation of CW and EL.
Samonte et al. (2005) verified that EW and EL had the strongest direct effects on YIELD, and Munawar et al. (2013) reported that EIH, NR, and NGE may be used for the selection of the highest yielding plants. On the other way, second Jayakumar et al. (2007), the number of grains per row followed by EL and ear circumference had the strongest direct effects on YIELD, and Wang et al. (1999) noted that grain-filling rate and duration and NGE had the strongest direct effects on YIELD. Conversely, Kumar et al. (2011) found that eight traits had positive direct effects on YIELD, with the greatest values observed for EL, and that number of grains per row, ear circumference and HGM could also be used for the indirect selection of the highest yielding plants. The variable EIH, retained in all nine scenarios, had strong direct effects on YIELD in a study conducted by Sreckov et al. (2011).
Moradi and Azarpour (2011) found that EL was the trait with the strongest direct effect on YIELD under different levels of fertilization and spacing. Nemati et al. (2009) found that NGE, followed by number of grains per row, and GL were the variables with the strongest direct effects on YIELD for different sowing date and nitrogen fertilization level scenarios. Khalily et al. (2010) reported that under water stress conditions in the vegetative period, the variables ‘number of grains per row’, EL, ‘ear circumference’, and NR had the strongest direct effects on YIELD and may be used for indirect selection. Conversely, Shiri et al. (2013) found that the grain-filling rate and duration are the two variables with the strongest direct effects on YIELD under water stress conditions. Furthermore, in an evaluation of the performance of corn genotypes under conditions of high and low water availability, Khayatnezhad et al. (2010) noted that ‘five-hundred-grain mass’ and EL were the variables with the strongest direct effects on YIELD.
According to Badu-Apraku et al. (2012), corn grain yield exhibits low heritability in scenarios of low nitrogen availability and water restriction, requiring indirect selection through the study of associations between traits. Furthermore, according to those authors, PH, EIH, the ear variables and the period between anthesis and silking may be used for indirect selection in scenarios with low N and water restriction. According to Badu-Apraku et al. (2014), only the ear traits (level of damage caused by insects and diseases, ear size, ear uniformity, and grain filling) had direct effects on corn YIELD under conditions of Striga hermonthica infestation and may be used for the indirect selection of plants in this case. In an evaluation of mildew resistance in corn cultivars, Pudjiwati et al. (2013) noted that the densities of trichomes and stomata on the upper and lower leaf surfaces have a direct effect on the incidence of mildew, and plants with the lowest densities of trichomes and stomata should be selected to improve disease resistance.
the indirect selection of the highest yielding plants may be performed based on one or both variables. Conversely, the comparison of numerical values of direct effects between studies should be avoided because the set of variables composing each study affects the partitioning of the correlation coefficients into direct and indirect effects on the main variable. Furthermore, it is stressed that some of the studies reviewed estimated the direct effects under a high degree of multicollinearity, which may result in inaccurate estimates without a biological explanation. It must also be emphasized that few of the authors cited indicated the number of observations used in performing the path analysis and, in some cases, measurement of complex variables that are determined after measuring the main variable was recommended, which may not result in gains in indirect and early selection through path analysis.
CONCLUSION
The variables ear weight, 100-grain mass, and number of grains per ear had stronger direct effects on grain yield in the first three scenarios and the variables ear length and ear diameter had stronger direct effects on grain yield in the other scenarios, regardless of hybrid or harvest.
The use of the ninth scenario of path analysis is recommended regardless of hybrid and harvest given the ease of explanatory variable measurement (ear insertion height, ear length, and ear diameter), the low degree of multicollinearity and the good prediction of the path analysis (R2 ≥ 0.78).
Conflicts of interest
The authors declare no conflict of interest.
ACKNOWLEDGMENTS
We thank Conselho Nacional de Desenvolvimento Científico e Tecnológico (CNPq) and Coordenação de Aperfeiçoamento de Pessoal de Nível Superior (CAPES) for granting scholarships. We also thank fellows and volunteers for their help in conducting the experiment and collecting data.
REFERENCES
Ahmad A and Saleem M (2003). Path coefficient analysis in Zea mays L. Int. J. Agric. Biol. 5: 245-248.
Badu-Apraku B, Akinwale RO, Franco J and Oyekunle M (2012). Assessment of reliability of secondary traits in selecting for improved grain yield in drought and low-nitrogen environments. Crop Sci. 52: 2050-2062 http://dx.doi. org/10.2135/cropsci2011.12.0629.
Badu-Apraku B, Akinwale RO and Oyekunle M (2014). Efficiency of secondary traits in selecting for improved grain yield in extra-early maize under Striga-infested and Striga-free environments. Plant Breed. 133: 373-380 http://dx.doi. org/10.1111/pbr.12163.
Bello OB, Abdulmaliq SY, Afolabi MS and Ige SA (2010). Correlation and path coefficient analysis of yield and agronomic characters among open pollinated maize varieties and their F1 hybrids in a diallel cross. Afr. J. Biotechnol. 9: 2633-2639.
Carvalho CGP, Borsato R, Cruz CD and Viana JMS (2001). Path analysis under multicollinearity in S0 x S0 maize hybrids.
Crop Breed. Appl. Biotechnol. 1: 263-270. http://dx.doi.org/10.13082/1984-7033.v01n03a06
Cruz CD (2005). Princípios de genética quantitativa. UFV, Viçosa.
Cruz CD and Regazzi AJ (1997). Modelos biométricos aplicados ao melhoramento genético. 2nd edn. UFV, Viçosa. Cruz CD and Carneiro PCS (2006). Modelos biométricos aplicados ao melhoramento genético. 2nd edn. Vol. 2. UFV, Viçosa. Duvick DN (2005). The contribution of breeding to yield advances in maize (Zea mays L.). Adv. Agron. 86: 83-145 http://
dx.doi.org/10.1016/S0065-2113(05)86002-X.
El-Shouny KA, El-Bagoury OH, Ibrahim KIM and Al-Ahmad SA (2005). Correlation and path cofficient analysis in four yellow maize crosses under two planting dates. Arab Univ. J. Agric. Sci. 13: 327-339.
Fancelli AL and Dourado Neto D (2004). Produção de milho. 2nd edn. Agropecuária, Guaíba.
FAO (2014). FAO - Food and Agriculture Organization of the United Nations. Available at [http://statistics.amis-outlook. org/data/index.html].
Fávero LP, Belfiore P, Silva FL and Chan BL (2009). Análise de dados: modelagem multivariada para tomada de decisões. Elsevier, Rio de Janeiro.
Ferreira DF (2009). Estatística básica. 2nd edn. UFLA, Lavras.
Gujarati DN (2006). Econometria Básica. 4th edn. Campus Elsevier, Rio de Janeiro.
Hair JF, Black WC, Babin BJ and Anderson RE (2009). Multivariate data analysis. 7th edn. Prentice Hall, New York. Hefny M (2011). Genetic parameters and path analysis of yield and its components in corn inbred lines (Zea mays L.) at
different sowing dates. Asian J. Crop Sci. 3: 106-117 http://dx.doi.org/10.3923/ajcs.2011.106.117.
Jayakumar J, Sundaram T, Raguramarajan A and Kannan S (2007). Studies on path analysis in maize (Zea mays L.) for grain yield and other yield attributes. Plant Arch. 7: 279-282.
Khalily M, Moghaddam M, Kanouni H and Asheri E (2010). Dissection of drought stress as a grain production constraint of maize in Iran. Asian J. Crop Sci. 2: 60-69 http://dx.doi.org/10.3923/ajcs.2010.60.69.
Khayatnezhad M, Gholamin R, Jamaati-e-Somarin S and Zabihi-e-Mahmodabad R (2010). Study of genetic diversity and path analysis for yield in corn (Zea mays L.) genotypes under water and dry conditions. World Appl. Sci. J. 11: 96-99. Kumar TS, Reddy DM, Reddy KH and Sudhakar P (2011). Targeting of traits through assessment of interrelationship and
path analysis between yield and yield components for grain yield improvement in single cross hybrids of maize (Zea mays L.). Int. J. Appl. Biol. Pharm. Technol. 2: 123-129.
Lopes SJ, Lúcio AD, Storck L, Damo HP, et al. (2007). Path analysis on maize spikes characteristics related of the hybrid type. Cienc. Rural 37: 1536-1542 http://dx.doi.org/10.1590/S0103-84782007000600005.
Mohammadi SA, Prasanna BM and Singh NN (2003). Sequential path model for determining interrelationships among grain yield and related characters in maize. Crop Sci. 43: 1690-1697. http://dx.doi.org/10.2135/cropsci2003.1690
Montgomery DC and Peck EA (1982). Introduction to linear regression analysis. John Wiley & Sons, New York. Moradi M and Azarpour E (2011). Determination of most important part of yield components by path analysis in corn. J.
Am. Sci. 7: 646-650.
Munawar M, Shahbaz M, Hammad G and Yasir M (2013). Correlation and path analysis of grain yield components in exotic maize (Zea mays L.) hybrids. Int. J. Sci. Basic Appl. Res. 12: 22-27.
Nemati A, Sedghi M, Sharifi RS and Seiedi MN (2009). Investigation of correlation between traits and path analysis of corn (Zea mays L.) grain yield at the climate of Ardabil region (Northwest Iran). Not. Bot. Horti Agrobot.
Cluj-Napoca 37: 194-198.
Parimala K, Raghu B and Reddy AV (2011). Correlation and path analysis for yield and quality traits in maize (Zea mays
L.).Plant Arch. 11: 1045-1047.
Pudjiwati EH, Kuswanto K, Basuki N and Sugiharto AN (2013). Path analysis of some leaf characters related to downy mildew resistance in maize. Agrivita 35: 167-173. http://dx.doi.org/10.17503/Agrivita-2013-35-2-p167-173
R Development Core Team (2016). R: a language and environment for statistical computing. Available at [https://www.r-project.org/].
Rigon JPG, Rigon CAG and Capuani S (2014). Quantitative descriptors and their direct and indirect effects on corn yield.
Biosci. J. 30: 356-362.
Samonte SOPB, Tagle SAL, Lales JS, Villegas GM, et al. (2005). Path analysis of traits affecting grain yield and its components in corn. Philipp. Agric. Sci. 88: 400-407.
Selvaraj CI and Nagarajan P (2011). Interrelationship and path-coefficient studies for qualitative traits, grain yield and other yield attributes among maize (Zea mays L.). Int. J. Plant Breed. Genet. 5: 209-223 http://dx.doi.org/10.3923/ ijpbg.2011.209.223.
Shiri M, Momeni H and Geranmayeh B (2013). The survey of the morphological and physiological basis of maize grain yield under drought stress condition through path analysis. Tech. J. Eng. Appl. Sci. 3: 3647-3651.
Teodoro PE, Silva CA, Junior., Corrêa CC, Ribeiro LP, et al. (2014). Path analysis and correlation of two genetic classes of maize (Zea mays L.). J. Agron. 13: 23-28 http://dx.doi.org/10.3923/ja.2014.23.28.
Toebe M and Cargnelutti Filho A (2013). Multicollinearity in path analysis of maize (Zea mays L.). J. Cereal Sci. 57: 453-462 http://dx.doi.org/10.1016/j.jcs.2013.01.014.
Wang G, Kang MS and Moreno O (1999). Genetic analyses of grain-filling rate and duration in maize. F. Crop. Res. 61: 211-222 http://dx.doi.org/10.1016/S0378-4290(98)00163-4.