101
Volume LX 11 Number 7, 2012
THE IMPACTS OF THE GLOBAL ECONOMIC
CRISIS ON SELECTED SEGMENTS OF THE
WORLD TRADE IN COMMODITIES
E. Horská, L. Smutka, M. Maitah
Received: May 28, 2012
Abstract
HORSKÁ, E., SMUTKA, L., MAITAH, M.: The impacts of the global economic crisis on selected segments of the world trade in commodities. Acta univ. agric. et silvic. Mendel. Brun., 2012, LX, No. 7, pp. 101–110
This paper deals with the impacts of the economic crisis on the world trade in order to highlight the mutual interdependence of the development of the world output and trade. The paper observes mutual correlation in development of the world trade and output. The results of the analysis indicate that changes in the value of world GDP and world trade are correlated by more than 90%. It is important to mention that in the years 2000–2009, the value of world trade and world output increased signifi cantly (although in 2009, a signifi cant decline in both value and volume of global production and trade was recorded due to the crisis). In relation to the world trade, it should be noted that its commodity structure is dominated by trade in manufactures. The crisis that occurred in the period 2008–2009 greatly aff ected the world economy and trade in particular. In this respect it should be pointed out that the crisis mainly aff ected trade in manufactures and then trade in fuels and mining outputs in terms of both absolute and relative indicators. Agrarian trade dealt with the crisis the best and the impact of the crisis on development of its values and volume was the least signifi cant. This verifi es the fact that agrarian and food products tend to be the most resistant to the crisis (on contrary, in times of global economic growth or reconstruction, the trade in agrarian and food products shows lower degree of elasticity in relation to the global GDP growth in comparison to other segments of commodities trade).
world, trade, output, relationship, crisis, impacts, structure, commodities, sensitivity, value
The world economy experienced very signifi cant changes in the last few years. First, it witnessed very rapid economic growth that infl uenced last two decades (1990–2010) in general, however, this growth was not continuous and it was interrupted by a few minor recessions and one notable crises. Among the most important problems of the world economy, it is possible to include the recession from the year 2001 and the crisis that hit the world economy in late 2008 and early 2009 (WTO, 2010).
If we le out of consideration the shocks that aff ect the world economy mentioned in the introduction of this paper, last 20 years can be classifi ed very positively and it can be said that the world economy grew at a record pace (WB, 2010). During the last ten years, the world output increased to a record USD 61 trillion in 2008. Compared to 2000, it was an increase of about USD 30 trillion in current prices.
and Southeast Asia in the value of the world commodity trade is more than 80% (Horská et al., 2011). The world commodity trade is basically represented by the transactions implemented in three commodity segments (manufactures, fuels and mining products, and agricultural and food products) (Jeníček, 2009). Currently, the share of individual segments in the resulting value of trade is approximately 76% in the case of manufactures, approximately 16% in the case of fuels and mining products and less than 8% in the case of food and agricultural commodities (Svatoš et al., 2009). Details regarding the development of the value of individual segments of the world trade in 2000– 2009 are included in the following Tab. I.
Constantly decreasing the share of trade in agrarian and food production in particular is caused by consistently lower dynamics of growth of its value and volume in comparison to the growth rate of value and volume of trade in manufactures especially (Fig. 1).
In this respect it should be noted that global trade and global output development are closely related. Based on the comparison of Tabs. I and II, it can be seen that the value of the world trade and the value
of the world output are closely correlated. In this regard, the degree of mutual correlation in both current and constant prices amounts to more than 90%. This fact is refl ected in the Fig. 2.
It should be emphasized that the correlation between changes in the value of global production and trade is subject of many studies (Rodriguez and Rodrik, 2000; Summers, Heston and Aten, 2001; Thomas et al., 1991; Weiss, 1992; Joshi and Little, 1996; Helleiner, 1994; Bleaney, 1999 and Ahmed, 2000). These studies point out the fact that it is the trade that allows enhancing of economic cooperation among economies at increased level. Moreover, it allows better use of existing resources through the international division of labour and thereby leads to an increase in global output.
On the other hand, it is necessary to mention that it is the development of global output as a whole which infl uences the development of trade because when the global economy grows, it creates the space for cooperation and there are free resources for international exchange not only of goods and services; but when there is more or less signifi cant slowdown of economic growth, both at the level of the global economy and at the level of individual
1: The development of the volume of individual segments of the world trade in the period time 1950–2009 (Index, 1950 = 100) Source: WTO, 2011
I: The value of the world commodity trade in the time period 2000–2009
World Trade (export) b. USD 2000 2001 2002 2003 2004 2005 2006 2007 2008 2009 Agrarian and Food products 401.7 416.8 443.6 512.9 586.6 638.2 708.8 849.6 1 021.5 910.0
Fuels and Mining products 814.5 747.0 754.6 917.4 1 198.1 1 559.7 1 985.9 2 142.0 3 020.8 1 965.6
Manufactures 4 926.2 4 776.6 5 045.7 5 841.4 7 052.1 7 769.6 8 945.8 10 247.5 11 256.7 9 030.1
II: The value of the world GDP in the time period 2000–2010
Indicator Name 2000 2001 2002 2003 2004 2005 2006 2007 2008 2009 2010
World 2000 US$) – in bil.GDP (constant 32 249 32 785 33 436 34 334 35 739 37 007 38 505 40 037 40 613 39 677 41 348
World GDP (current US$)
- in bil. 32 240 32 046 33 305 37 466 42 229 45 658 49 506 55 849 61 305 58 088 63 124 World Trade (% of GDP) 49.61 48.33 47.70 48.23 51.33 53.56 56.33 57.27 59.44 50.84 55.86
World Population, total
(in bilion) 6.08 6.16 6.23 6.31 6.38 6.46 6.53 6.61 6.69 6.76 6.84
Source: WB, WDI database, 2011
2: Correlation between values of deviations from trend in case of development of world trade and world output in the time period 1992–2009 Source: WTO, 2011
3: The value of global GDP (percentage change) including the most important regions of the world in 2000 to 2011 (estimation according to the WTO)
(especially large) economies, there is a signifi cant slowdown of the trade in particular because of the reduction in demand for both goods and services (Dollar and Kray, 2004; Thirlwall and Santos-Paulino, 2004; Tervio and Irwin, 2002; Frankel and Romer, 1999).
This reduction in demand is further enhanced by the eff orts of number of countries to protect their own economies and solve their own problems primarily. These eff orts o en lead to the introduction of protectionist measures which are restricting the development of foreign trade volume even more (Beneš, 2004).
Mutual sensitivity between the development of global output and development of trade value is further enhanced by the development of prices in the global market (Van Marrewijk, 2002). While in the time of general economic growth the value of global trade is increasing not only through the growth of traded goods but also through raising prices which are increasing due to high demand; during a recession, or crisis, the value of global trade is declining not only due to the decline of the physical quantity of goods demanded but also because of the decline in global prices which occurs due to the decline in global demand. This can be easily demonstrated by the crisis of the years 2008 and 2009. During this period, there was a signifi cant reduction in prices in the global market compared with the reduction of production which subsequently resulted in the non-proportional development when, for example, the volume of trade in fuels decreased by about 4.5% but its dollar value decreased by about 37% (Tabs. III and IV).
The results of the analysis imply that the world trade is very sensitive to changes in the development of world economy.
Any signifi cant decline of global output value development was followed by a sharp decline in the world trade and vice versa and it is worth highlighting that the degree of sensitivity of the world trade value to the change in the global output value is very high. Interdependence in the development of the global output and development
of the world trade is documented by Figs. 3 and 4. Comparing the two fi gures, close interconnection between the two variables can be observed.
OBJECTIVES AND METHODS
The aim of this paper is to analyze the development of values and structures of the world trade in relation to the development of the world GDP value in order to identify the impacts of the global economic crisis of 2008/2009 on development and structure of the world commodity trade. Subsequently, the paper analyzes the development in 2010 in order to analyze the recovery process of economic growth.
In order to achieve the aim pursued in this paper, the development of the GDP and development of the world commodity trade in current and constant prices of the year 2000 are observed (constant prices are based on the methodology applied by the World Bank). The value of both GDP and trade is denominated in the USD. In terms of time frame, an emphasis is laid on the period 2000–2009. However, development of the global economy and trade in the year 2010 is also analyzed in order to analyze the processes associated with the process of restructuring of global economy. However, the primary aim of this paper is to compare the recession of the year 2001 and the crisis of the years 2008/2009 and to determine whether there are some similarities typical for the development of value and structure of commodity trade in the case that the global economy gets into troubles. The second aim of this paper is to monitor the process of global economy growth recovery.
The development of the commodity trade is observed based on the division into three main segments according to SITC (see methodology of the WTO) which are: trade in manufactures (SITC aggregation as nom. 5, 6, 7, 8), trade in fuels and mining products (aggregation according to SITC nom. 2 and 3) and trade in agrarian and food production (according to SITC aggregation nom. 0, 1 and 4). The paper analyzes mutual 4: The value of world trade in the time period 1985–2009
relation between the development of value of the world output and trade (degree of correlation). Furthermore, it is observed the impact of decline in the GDP growth on value of the world trade and its structure (in this respect, it is worth noting that not only elasticity of the above mentioned aggregation groups is observed, but also elasticity of individual sub-aggregations1), through functional elasticity
calculations based on the following formula (Tvrdoň, 2006):
y x E
x y
,
where x represents the average value of the world trade and y represents the theoretical value of the global GDP.
The elasticity is calculated by regression function (in the form: y = ax + c) which expresses the relationship between the development of
value of the trade in individual aggregation or sub-aggregation (endogenous variable) and development of value of the global GDP (exogenous variable).
RESULTS AND DISCUSSION
The results of the analysis shows that the economic crisis in 2008/2009 had very large impact on the global output development as well as on trade (Tab. III).
From the above it is obvious that the volume of world production fell by more than 2.5% annually and the volume of production of manufactures was the most infl uenced one, it decreased by 7%. In the case of the world trade, there was a very signifi cant decrease in the volume of realized transactions. The volume of traded goods was reduced by about 12%. The most aff ected segment was trade in manufactures where there was a reduction in realized trade by more than 15.5%. The least aff ected segment of the world economy and world trade was
III: The development of the world trade, production and GDP
Annual change (%) 2000–2009 2008 2009
World commodity trade 3.0 2.0 −12.0
Agrarian and food products 3.0 2.0 −3.0
Fuels and mining products 2.0 0.5 −4.5
Manufactures 3.5 2.5 −15.5
World commodity production 1.5 1.0 −5.0
Agrarian and food products 2.0 3.5 0.5
Fuels and mining products 1.0 1.0 −2.0
Manufactures 1.0 1.0 −7.0
World GDP 2.0 1.5 −2.5
Source: WTO, FAO, WB, 2011
IV: The value of the world trade in the time period 2008–2009
Agricultural and food production
Fuels and mining products
Manufactures
Total Total Fuels Total Steel Chemistry
Offi ce, communication
technique
Automobiles
Textile and clothes Value 1 169 2 263 1 808 8 355 326 1 447 1 323 847 527
Share in commodity trade (%)
9.6 18.6 14.8 68.6 2.7 11.9 10.9 7.0 4.3
Annual change in %
2008 18 33 41 10 23 14 4 4 5
2009 −13 −36 −37 −20 −45 −14 −16 −32 −16 Source: WTO, 2010
agrarian and food sector. The volume of its trade and production decreased only minimally. This refl ects the reality that due to the fact that the agrarian and food products serve to meet basic human needs (see Maslow), their ability to resist a consumption crisis is very high (moreover, demand is stimulated by constant growth of world population (Jeníček, 2010) that grows independently on the global economy). Tab. IV provides an overview of the development of the world trade in the observed period.
The data presented in Tab. IV implies that in terms of value, the most aff ected segment of the world trade was the trade in fuels and mining products and then the trade in manufactures (mainly in steel and automobiles). On the contrary, trade in agricultural and food production reduced its value by about 13% only.
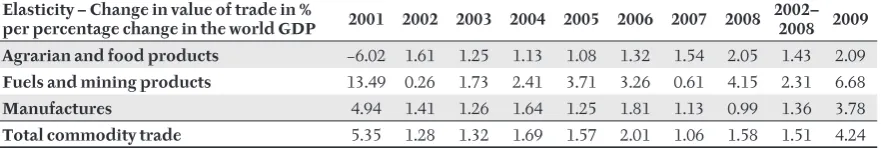
In relation to the sensitivity of individual segments of the world trade in global economy, it can be stated the following. The value of the world trade is always sensitive to changes in global output development, and thus to the demand (Tab. V). This is showed mainly by the development between the years 2001 and 2009. An interesting fi nding is how a change in development of the world output aff ects the individual segments of the commodity trade. It is always clearly observable that trade in fuels, mining products and manufactures is the most aff ected one by the global recession while trade in agricultural and food production is the least aff ected one. This fact is illustrated by Tab. VI – it monitors the development of elasticity of individual segments of the world commodity trade in relation to the percentage change of the world GDP. The results of the analysis show again that the agricultural and food production is the most resistant group to economic crisis.
World trade and production in 2010 Global economy responded to the sharp decline in production and trade in the year 2009 by
a signifi cant growth one year later. Both global trade and the GDP raised (Fig. 5). The presented data show that the economic drop in the year 2009 was more or less fully compensated. While in 2009, there was a decline in volume of the global production and trade by 2.5% and 12% respectively, in 2010, there was an increase in the volume of the global production and trade by about 4% and 14%, respectively. The table above (Tab. II) provides a brief overview of the development of the global economy. The presented results imply, based on the analysis of data of the development of the global GDP both in current and constant prices, that in 2010, the value of the global output reached even higher values than in 2008, thereby it compensated for the loss in 2009. In case of the world trade, which declined much more signifi cantly compared to the global output due to the crisis, an increase in the volume and value of transactions in 2010 was not enough to off set the 2009 decline. The increase in the value of the global commodity trade in 2010 off set the decrease from 2009 by only about 73% (measured in constant USD prices of the year 2000). The details concerning the development of growth of value of the commodity trade are provided in Tab. VII. The table implies that agricultural products, which were aff ected by the crisis only marginally, continued to grow in the value of the realized business contracts and in 2010, the world agricultural trade exceeded USD 1.3 trillion (global rise in prices of agricultural and food products contributed to the growth of the values very signifi cantly). In the case of the trade in fuels and mining products, increase in value of the realized trade in 2010 did not manage to fully compensate the fall in 2009. However, the value of the realized trade (about USD 3 trillion) in 2010 very closely reached values from 2008 (by 99%). As well as in the case of agricultural trade, growth in global prices of mining products contributed to the rapid decrease in their value.
V: The annual changes in the development of the values of world commodity trade and its individual segments in the time period 2001–2009
(chain index) 2001 2002 2003 2004 2005 2006 2007 2008 2009 Agrarian and food products 1.038 1.064 1.156 1.144 1.088 1.111 1.199 1.202 0.891
Fuels and mining products 0.917 1.01 1.216 1.306 1.302 1.273 1.079 1.41 0.651
Manufactures 0.97 1.056 1.158 1.207 1.102 1.151 1.146 1.098 0.802
Total commodity trade 0.967 1.051 1.165 1.215 1.128 1.168 1.137 1.156 0.778 Source: own calculations, 2011
VI: The change in the value of trade of each observed commodity segments in % per percentage change in world GDP
Elasticity – Change in value of trade in %
per percentage change in the world GDP 2001 2002 2003 2004 2005 2006 2007 2008 2002–
2008 2009 Agrarian and food products −6.02 1.61 1.25 1.13 1.08 1.32 1.54 2.05 1.43 2.09
Fuels and mining products 13.49 0.26 1.73 2.41 3.71 3.26 0.61 4.15 2.31 6.68
Manufactures 4.94 1.41 1.26 1.64 1.25 1.81 1.13 0.99 1.36 3.78
Regarding the trade in manufactures, it can be mention that growth of trade value in 2010 did not manage to compensate the decrease of value from 2009. While in 2008, the value of global trade was around USD 11.3 trillion, in 2009, it was only a little over USD 9 trillion dollars. And then, in 2010, the value of transactions reached only about 10 trillion (so it can be seen that the decline of value in 2009 was far from being compensated at such high levels as in the case of trade in fuels and mining products as well as in the case of agrarian trade). In 2010, trade in manufactures did not grow as much as trade in fuels and mining products and trade in agrarian products because while the prices of primary mining products recorded growth, in the case of manufactures there was a decline.
In relation to the development of the global trade, it should be mentioned that during the period of reconstruction of the global economy, the trade in agrarian and food products showed lower sensitivity to the GDP growth in comparison to the trade in mining products and manufactures. In 2010, the GDP value of the global economy grew by about 8.7% annually (at current USD prices), agrarian trade increased its value by 15%, trade in mining products increased by 33% and trade in manufactures increased by approximately 20%. Therefore, the facts mentioned above imply that one percent growth in the value of global output cause an increase of trade in agrarian products by about 1.75%, in fuel and mining products by about 3.85% and elasticity of the trade in manufactures reached about 2.26%.
-14 -12 -10 -8 -6 -4 -2 0 2 4 6 8 10 12 14 16
1950-60
1960-70
1970-80
1980-90
1990-00
2000-10
2001 2002 2003 2004 2005 2006 2007 2008 2009 2010
Exports GDP
5: The volume of world commodity exports and GDP in the time period 1950–2010 (Annual Percentage Change) Source: WTO, 2011
VII: The world commodity exports by major product group, 2010
(Billion dollars and percentage)
Share Annual percentage change in world
commodity trade
1980–85 1985–90 1990–95 1995–00 2000–05 2005–10 2008 2009 2010
Agricultural products 9.2 −2 9 7 −1 9 10 19 −12 15
Fuels and mining products 20.4 −5 3 2 10 16 11 33 −36 33
VIII: The development of the sensitivity of individual aggregations of the world commodity trade in relation to the change of the world GDP
CONCLUSION
The results of the analysis imply that in the time period 2000–2008, the value of the world trade increased signifi cantly. The growth of this value was temporarily slowed-down by problems of the global economy only in the year 2001. Another signifi cant fl uctuation in the global economy occurred in 2009 and it was then refl ected by fall in values of the global GDP and trade. However, just a year later, i.e. in 2010, a re-growth of economy occurred and it largely off set the losses from 2009.
In 2009, the world trade decreased from 15 to 12 trillion compared to 2008 but one year later, in 2010, there was an increase in the value of the world trade to about 14.3 trillion USD again (WTO estimates). This growth did not fully compensate the drop from 2009 but it is important to stress that it led to the overall stabilization of the world economy in which further slowdown was stopped. However, lower growth rate of trade (compared to the period before the crisis) remains to be a weakness in relation to the further development of the global economy which subsequently has a direct impact on the limited growth of the world GDP.
If we look at the resistance of individual segments of the world trade to the crisis, the results indicate that the most resistant segment of the global commodity trade is the trade in agrarian and food products. On the contrary, the most vulnerable segment of the world trade in relation to the decline of the global GDP value is trade in mining products, fuels and manufactures. On the other hand, in relation to the period of growth and reconstruction of the economy, agrarian trade has the lowest
sensitivity level in relation to growth of the global product value.
In the case of a crisis food and agrarian products behaves very specifi cally, as it can be seen in Tab. VIII (see Appendix). The table implies that agrarian and food products, which have below average growth rate of values in general and which are characterized by only an average to below average level of elasticity in relation to the development of the world GDP in the case that the economy is growing, tend to resist in the case of a crisis and inherently, they response to the crisis by reducing the elasticity with respect to a change in the world GDP. Tab. VIII shows that in the case of the crisis, agrarian aggregations (items highlighted by yellow colour, according to the Combined Nomenclature) tend to get together at the bottom of the table. This table shows individual aggregation of the world commodity trade in relation to their reaction to the percentage change in the value of the global GDP. It is interesting to see that this is particularly evident when there are global problems, as it happened in 2001 and 2009. The year 2001 was also specifi c in the fact that while all other segments of the commodity trade, on average, reduced their value, the value of agrarian trade continued to grow which resulted in an exceptional situation when the trade in agrarian and food production responded to the stagnation of the global economy by continued growth of its value. However, in 2009, when the global economic crisis was associated with a temporary drop in prices on the world markets, the value of trade in agrarian and food production decreased as well, despite the fact that unlike other segments of the global economy, agrarian and food sector increased its own production capacity.
SUMMARY
in times of global economic growth or reconstruction, the trade in agrarian and food products shows lower degree of elasticity in relation to the global GDP growth in comparison to other segments of commodities trade). The year 2010 was marked by renewed growth in the global economy which was showed by growth of the value of global trade as well but the decrease of values in 2009 was not fully compensated, especially in the segment of trade in manufactures.
REFERENCES
AHMED, N., 2000: Export responses to trade liberalisation in Bangladesh: a cointegration analysis, Applied Economics, Vol. 32, pp. 1077– 1084.
BENEŠ, V. a kol., 2004: Zahraniční obchod, Grada Publishing, ISBN 80-247-0 558.
BIELIK, P. et al., 2010: Economics, social policy and citizenship in the EU – Evidence of V4 countries and perspectives for Ukraine, SPU, Nitra, ISBN 978-80-552-0448-2.
BIELIK, P. et al., 2010: Economics, social policies and citizenship in the Europe of regions, SPU, Nitra, ISBN 978-80-552-0366-9.
BLEANEY, M., 1999: Trade reform, macroeconomic performance and export growth in ten Latin American countries 1979–1995, Journal of International Trade and EconomicDevelopment, Vol. 8, pp. 89–105.
DOLLAR, D. AND KRAY A., 2004: Trade, Growth and po verty, Economic Journal, Vol. 114, Issue 493, pp. 22–49.
FRANKEL, J. A. and ROMER, D., 1999: Does trade cause growth?, The American Economic Review, Vol. 89, Issue No. 3, pp. 379–399.
IRWIN, D. A. and TERVIO, M., 2002: Does trade raise income? Evidence from the twentieth century, Journal of International Economics, Vol. 58, pp. 1–18.
JENÍČEK, V., 2010: Population problem in the future – challenges, questions, Agric. Econ. – Czech, 56 (2010): 97–107, ISSN 0139-570X.
JENÍČEK, V., 2009: The role of foreign trade and its eff ects, Agric. Econ. – Czech, 55 (2009): 211–220, ISSN 0139-570X.
JOSHI, V. and LITTLE, I. M. D., 1996: India’s economic reforms 1991–2001, Oxford: Oxford University Press.
HELLEINER, G., 1994: Trade policy and industrialisation in turbulent times, London: Routledge, pp. 31.
HORSKÁ, E. et al., 2011: European studies on intercultural dimension of international business, SPU, Nitra, ISBN 978-80-552-0530-4.
RODRIGUEZ, F. and RODRIK, D., 2000: Trade policy and economic growth: A Skeptic’s guide to the cross-national evidence, National Bureau of Economic Research, (NBER) No. 7081, Cambridge MA.
SUMMERS, R., HESTON, A. and ATEN, B., 2001: Penn world table version 6.0, Center for International Comparisons at the University of Pennsylvania (CICUP).
SVATOŠ, M. a kol., 2009: Zahraniční obchod – teorie a praxe. Grada. 1. vyd. Praha. ISBN 978-80-247-2708-0.
THIRLWALL, T. and SANTOS-PAULINO, A., 2004: The impact of trade liberalisation on exports, imports and the balance of payments of developing countries, The Economic Journal, February issue, Vol. 114, Issue 493, pp. 50–73.
THOMAS, A., 1991: Economic modelling of the Canada-U.S. free trade agreement: introduction, Journal of Policy Modelling, Vol. 13(3), pp. 417– 419.
TVRDOŇ, J., 2006: Econometrics. ČZU, Praha; ISBN 80-213-0819-2.
UN, 2011: COMTRADE trade database, available at: http://comtrade.un.org/db/, 06/06/2011.
UN FAO, 2011: FAOSTAT database, available at: http://faostat.fao.org/site/339/default.aspx, 04/05/2011.
VAN MARREWIJK, CH., 2002: International trade and the world economy, Oxford University Press, USA; 1st edition, ISBN-10: 0199250049.
WEISS, J., 1992: Export response to trade reforms: recent Mexican experience, Development Policy Review, Vol. 10, pp. 43–60.
WORLD BANK, 2010: WDI on-line database, available at: http://data.worldbank.org/data-c a t a l o g / w o r l d - d e v e l o p m e n t- i n d i http://data.worldbank.org/data-c a t o r s , 05/06/2011.
WTO, 2010: International trade statistics 2010, Ženeva, ISBN 978-92-870-3466.
WTO, 2011: World trade report 2010, Ženeva, ISBN 978-92-870-3708-4.
Address