SINGLE-CELL GENE-EXPRESSION ANALYSIS BY QUANTITATIVE RT-PCR
Thesis by Luigi A. Warren
In Partial Fulfillment of the Requirements For the Degree of
Doctor of Philosophy
California Institute of Technology Pasadena, California
2008
ACKNOWLEDGEMENTS
I would like to thank the members of my thesis committee, Ellen Rothenberg, Scott Fraser, Paul Sternberg, James R. Heath, and (above all) my advisor, Stephen Quake, for their advice and support. My scientific collaborators, David Bryder and Derrick Rossi, and their director, Irving Weissman, allowed me to apply novel single-cell analysis techniques to real biological problems. Stuart Kim and Jan Vijg were guiding influences for the aging study, and Geoffrey Schiebinger helped out tremendously with the experimental work. I extend my appreciation to the members of the Quake lab—most especially, to Joshua Weinstein, who worked out the analytic solution to the digital-PCR response-curve problem that appears in the appendix, and to Joshua Marcus, who gave freely of his time to get me started on
ABSTRACT
TABLE OF CONTENTS
Acknowledgments... iii
Abstract ... iv
Table of Contents ... v
List of Figures ... vi
1. Overview ... 1
2. Regulatory Coding of Lymphoid Lineage Choice by Hematopoietic Transcription Factors ... 6
3. Single-Cell Gene-Expression Analysis ... 42
4. Thesis Methods ... 62
5. Transcription Factor Profiling in Individual Hematopoietic Progenitors by Digital RT-PCR ... 133
6. Transcriptional Instability is Not a Universal Attribute of Aging ... 160
Appendix: The Digital Array Response Curve ... 188
LIST OF FIGURES
Figure 1.1. Single-cell gene-expression analysis ... 5
Figure 2.1. Alternative models of regulatory network architecture ... 10
Figure 2.2. Subdivision of early hematopoietic regulatory space ... 14
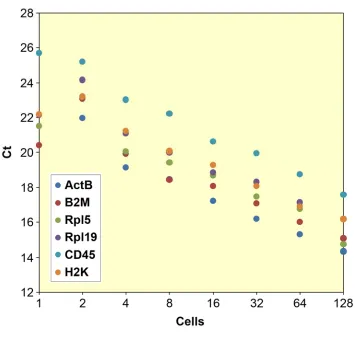
Figure 4.1. Cell-concentration ramp analysis ... 73
Figure 4.2. Least-squares fit of mRNA loss model ... 76
Figure 4.3. Effect of SUPERase-In on mRNA recovery ... 79
Figure 4.4. Cell-concentration ramp control from the aging study ... 80
Figure 4.5. Hypotonic lysis versus chaotropic mRNA isolation ... 82
Figure 4.6. Melt-curve analysis of qRT-PCR products ... 84
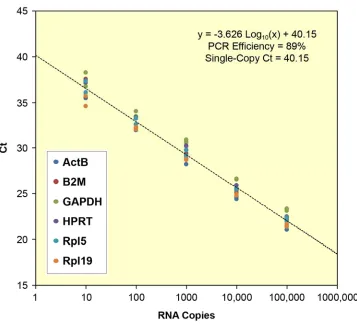
Figure 4.7. Six-plex qRT-PCR standard curve with SSIII/Taq ... 90
Figure 4.8. Secondary structure prediction ... 92
Figure 4.9. Design of a cDNA-specific assay ... 93
Figure 4.10. Primer design using Primer3 ... 94
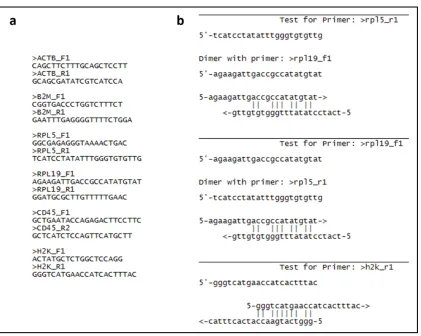
Figure 4.11. FastPCR analysis of primer-dimer interactions... 95
Figure 4.12. Primer-dimer extension ... 100
Figure 4.13. On-chip standard-curve assays ... 102
Figure 4.14. Clustering of RNA standards Cts ... 103
Figure 4.15. Analyte subdivision in an elastomeric chip ... 107
Figure 4.16. Triplex digital PCR on purified cDNA ... 112
Figure 4.17. Primer-dimer product formation by reverse transcriptase ... 115
Figure 4.19. Digital PCR assay report ... 120
Figure 4.20. Pre-PCR secondary-product amplification in qPCR ... 124
Figure 4.21. Technical noise in SYBR Green and TaqMan preamp assays ... 127
Figure 5.1. The Digital Array chip ... 136
Figure 5.2. Experimental procedure used in the single-cell survey ... 139
Figure 5.3. Early progenitors in the hematopoietic lineage tree ... 140
Figure 5.4. Gene expression in cDNA copies per cell, by cell type ... 144
Figure 5.5. Resolution of flk2- and flk2+ CMP populations based on gene expression ... 146
Figure 6.1. HSC sort strategy ... 164
Figure 6.2. Granulocyte sort strategy ... 165
Figure 6.3. B-cell sort strategy ... 166
Figure 6.4. T-cell sort strategy ... 167
Figure 6.5. Experimental method ... 168
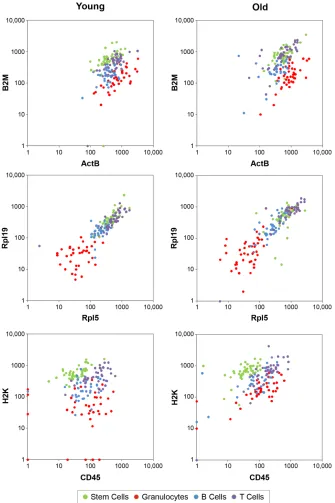
Figure 6.6. RNA expression data ... 170
Figure 6.7. Gene-expression profiles ... 171
Figure 6.8. Cell-to-cell variability ... 173
Figure 6.9. Technical noise in RNA quantitation ... 174
Figure 6.10. Bootstrap resampling analysis. ... 175
Figure 6.11. Rpl5-Rpl19 correlation data ... 177
Figure 6.12. Transcript correlations ... 178
Chapter 1
OVERVIEW
1.1
Introduction
Progress in stem-cell biology has raised hopes for a revolution in therapeutics, based on the application of tissue regeneration techniques to make up deficits arising from injury, disease, and old age. A more detailed understanding of the molecular mechanisms that govern development will be needed before the promise of regenerative medicine can be realized. The broad principles underlying the action of gene regulatory networks have already been elucidated, and it is no longer a mystery how a fixed DNA sequence can specify the dynamic, conditional processes involved in cellular differentiation and morphogenesis. Nevertheless, the genetic networks controlling development are highly complex, and their characterization remains difficult even with the most sensitive molecular assays available today. New
techniques will be required to gather the data needed to model these circuits and rationally intervene in cellular differentiation programs for the purposes of “tissue engineering.”
emerged as intermediates in the branching path by which hematopoietic stem cells (HSCs) develop into the specialized cell types of the blood. FACS has facilitated the progressive refinement of progenitor taxonomies, which has in turn allowed researchers to focus in on key molecular actors and decision points in the cellular-differentiation process.
FACS is limited in that it surveys only membrane-protein expression, and yet we know that cell-fate choice is directly controlled by transcription factors acting in the cell nucleus. The expression of these regulatory factors can be evaluated using a variety of standard mRNA assays, including qRT-PCR, SAGE, and microarray analysis, and such measurements have provided insight into the networks controlling hematopoiesis. Still, conventional assays only give us population-average expression profiles, based on mRNA derived from thousands of cells, so the data they provide is necessarily conditioned by preestablished cell taxonomies.
To analyze population structure at the transcriptional-network level, we need assays sensitive enough to quantitate multiple, low-abundance transcripts in single cells, and convenient enough to expedite the analysis of many individual cells. This thesis describes two projects undertaken to improve the sensitivity and throughput of single-cell gene profiling:
levels of the housekeeping transcript GAPDH and the hematopoietic transcription factor PU.1 were measured in 116 cells using this methodology.
2. The second project measured the cell-to-cell variability of transcript levels in cells isolated from young and old mice, to evaluate the hypothesis that transcriptional regulation is destabilized with age. Again, FACS was used to prepare single-cell lysates for analysis. For this study, achieving high sample throughput was more important than maximizing assay sensitivity. This motivated a different technical approach to cDNA quantitation, based on “preamplification PCR.” Reverse transcription was coupled with 15 cycles of multiplex PCR, and the “preamplified” cDNA was diluted and analyzed in six independent SYBR Green qPCR assays using a standard real-time PCR machine. Parallel reactions on RNA quantitation standards were used to convert qPCR threshold-cycle readouts into absolute mRNA copy numbers. A total of 324 cells were evaluated in the study (figure 1.1).
1.2
Organization
Chapter 2. Regulatory Coding of Lymphoid Lineage Choice by Hematopoietic Transcription Factors
This chapter reviews the literature on the transcriptional control of differentiation in the branch of hematopoiesis which gives rise to the adaptive immune system.
Chapter 3. Single-Cell Gene-Expression Analysis
Chapter 4. Thesis Methods
This chapter explains the technical choices behind the two single-cell analysis protocols developed for the thesis work, and discusses their respective merits and potential.
Chapter 5. Transcription Factor Profiling in Individual Hematopoietic Progenitors by Digital RT-PCR
This chapter describes the hematopoiesis/digital PCR study.
Chapter 2
REGULATORY CODING OF LYMPHOID LINEAGE CHOICE
BY HEMATOPOIETIC TRANSCRIPTION FACTORS
*Luigi A. Warren and Ellen V. Rothenberg
2.1
Summary
During lymphopoiesis, precursor cells negotiate a complex regulatory space, defined by the levels of several competing and cross-regulating transcription factors, before arriving at stable states of commitment to the B-, T- and NK-specific developmental programs. Recent perturbation experiments provide evidence that this space has three major axes,
corresponding to the PU.1 versus GATA-1 balance, the intensity of Notch signaling through the CSL pathway, and the ratio of E-box transcription factors to their Id protein antagonists.
2.2
Abbreviations
bHLH basic helix–loop–helix
CLP common lymphoid progenitor CMP common myeloid progenitor CSL CBF1, Suppressor of Hairless, Lag-1
DC dendritic cell
GM-CSF granulocyte-macrophage colony-stimulating factor HSC hematopoietic stem cell
Id inhibitor of differentiation
IL interleukin
IL-7Rα IL-7 receptor α
M-CSF macrophage colony-stimulating factor NK natural killer
Notch-ICN Notch intracellular domain TCR T-cell receptor
2.3
Introduction
Hematopoiesis offers us an unusually revealing picture of cellular differentiation, a process which underpins all metazoan development. In contrast to the situation in solid tissue, blood cells maintain, and to a lesser extent arrive at, their terminal phenotypes cell autonomously, without the influence of the fate choices of neighboring cells and without requiring stable association with the supporting matrix. This independence of a fixed tissue geometry makes hematopoietic differentiation relatively simple to adapt to in vitro conditions, thereby
facilitating inquiry into the causative factors involved in lineage choice and developmental program progression. Furthermore, at least ten different hematopoietic cell types are generated continuously throughout life from a pool of multipotent stem cells. Neither multipotentiality nor the processes through which individual cells winnow their options down towards lineage commitment are dependent on any special conditions restricted to embryonic states. Thus, hematopoiesis affords us our best hope of answering the
symmetry breaking and diversity in development? How is homeostatic control over specific cell-type populations achieved? How do transcription factor expression profiles encode lineage decisions and divide up the multitude of possible cell fates? How do differentiation programs unfold? What stabilizes the end states of development?
This review focuses on the elements of the hematopoietic program that generate
lymphocytes; that is, B cells, T cells and natural killer (NK) cells. Our concern here is with the early branch points leading to the three basic lymphoid career choices, and not the later decisions that fine-tune morphologically similar cells to highly specific immunological roles, such as the CD4+ versus CD8+ choice in late T-cell development. Much is known about how these choices activate the downstream gene expression cascades that implement B-lineage differentiation [1–3, 4**, 5–7], but these causal relationships are far less clear for the NK and T-cell lineage programs. Therefore, differentiation genes will be touched on only briefly and our principal interest will be the generation of developmental diversity itself.
2.4
Developmental Choices are Defined by Combinations of Essential
Functions
potentials. It could be that stochastic variation of gene expression in HSCs, either within a population or within an individual cell over time, correlates with future differentiation potential without defining a canonical series of intermediate types. Each “destination” in the differentiation process is defined by its own unique set of regulatory functions, but the path that leads to that destination may not be uniquely prescribed [11**].
It is particularly important to consider this model because stem cells and immature precursor cells actively express genes that could serve any of several developmental fates, before they make absolute lineage decisions. Stem cells and multilineage precursors coexpress lymphoid and myeloerythroid genes in the same cells [12, 13*, 14]. Populations of CLPs and their myeloid counterparts (common myeloid progenitors; CMPs) still express combinations of genes associated with all of their potential descendents [13*, 15**–17**]. Few, if any,
“differentiation genes” in this system are true markers of lineage commitment. Furthermore, the uncommitted progenitors simultaneously express many of the transcription factors that serve later in the differentiation pathway as specific regulators of divergent differentiation. A vivid precedent for the ways in which such a system can give rise to diverse cell types is provided by the gene regulatory networks that have been developed in detail for some embryonic tissues [18, 19**, 20, 21].
In light of these considerations, we will resist the temptation to taxonomize intermediates and instead concentrate on identifying the transcription factors and regulatory subnets that play decisive roles in channeling HSC development towards the three lymphoid fates. With respect to each lineage option, we can ask the following questions: What is the proximate causative factor determining the choice to pursue that option? How does this factor push development in a particular direction? What is the ultimate source of the diversity in the fate decision?
2.5
PU.1- and GATA-Family Transcription Factor Levels Jointly Encode
Lymphoid, Myeloid and Erythroid Lineage Choice
When expressed at a high level, the Ets transcription factor PU.1 induces several
M-CSF receptor (CD115) [22, 23, 24**, 25]. Lack of PU.1 completely blocks macrophage development and impairs other myeloid development [26, 27]. However, PU.1 is also
required for the generation of lymphoid lineages, albeit at a lower level. PU.1 knockouts lack B cells and are deficient in fetal thymocytes [27, 28]. At low levels—but not at high levels— PU.1 directly induces the receptor for the canonical lymphoid cytokine, IL-7 [4**, 29]. IL-7 receptor α (IL-7Rα) promotes both survival and proliferation of pro-B cells and pro-T cells, with a continuing role in mature T cells. This is likely to be a major function, if not the only one, for which PU.1 is needed in B-cell development, because retroviral transduction with IL-7Rα can rescue PU.1-/- B-cell precursors, albeit at low efficiency [4**, 29]. At least some of the effects of IL-7 are mediated by inhibition of apoptosis through the caspase inhibitor Bcl2, but there is evidence that this cytokine is more than just a survival factor [30]. PU.1 knockouts also show defects in natural killer (NK) cell development, although these are less severe than the defects in the B or T lineages [31], which may be explained by their reduced dependency on IL-7Rα. Whether IL-7Rα is the only PU.1 target gene that is needed for T-lineage precursors still remains to be tested. GATA-1 is a positive regulator of erythroid and megakaryocytic genes and is essential for erythroid development.
When expressed at high levels, GATA-1 can participate in a mutually antagonistic
It is a plausible working hypothesis that the subdivision of hematopoietic precursor potential into lymphoid, myeloid and erythroid compartments is governed by the mutual antagonism of PU.1 and GATA-1, a coupling which may be said to constitute a simple regulatory subnet. In this hypothesis, cells with GATA-1 in a self-sustaining high-activity state turn on erythroid gene batteries, while repressing the gene batteries required for the competing myeloid and lymphoid programs by antagonizing PU.1. When GATA-1 is in the “off” condition, the choice between myeloid and lymphoid programs is determined by the PU.1 expression regime. High PU.1 expression, stabilized by positive feedback, activates the myeloid batteries, including myeloid cytokine receptors, while turning off IL-7Rα expression and disabling lymphoid program progression. Low levels of PU.1 activity could promote the lymphoid programs through IL-7-mediated pathways and through the absence of competing myeloid and erythroid gene expression. Figure 2.2 shows the proposed division of
2.6
The Origin of Diversity in Primary Hematopoietic Lineage Choice
is Unknown
If this model is correct it raises a question: what is the source of the diversity in the
expression levels of the primary fate-determining genes? Given the apparent absence of any instructive signals from neighboring cells, the null hypothesis for the source of diversity in gene expression must be stochastic variation. Single-cell assays show significant
heterogeneity in gene expression among hematopoietic progenitors within the same apparent class, including even the precocious low-level expression of terminal differentiation genes [15**]. This suggests that multipotent cells may operate in a loosely regulated regime in which random fluctuations in gene expression are exploited for symmetry breaking and the
generation of developmental diversity.
rise to the additional cell fate choice of mast cells [45], and low levels of both PU.1 and GATA-3 are essential for early T-cell development, although high levels of either disrupt it [46**]. Alternatively, complexity might reside in other transcription factors whose roles have yet to be characterized.
This general model may suggest new possible explanations for the roles of some apparently unrelated factors. For example, the transcription factor Ikaros has long been known to be essential for most lymphocyte development [47], but there has been some controversy over its precise function. Ikaros has no definite positive regulatory targets and is suspected of regulating the packaging of multiple genes into open or closed chromatin states [48]. Loss of function of this factor has little effect on erythroid or myeloid cells but blocks lymphocyte development specifically in a pattern resembling loss of function of PU.1 [47]. It would be interesting to investigate, therefore, whether a major role of Ikaros is to stabilize the precarious low-PU.1 expression state that lymphocyte development depends upon.
Finally, it is conceivable that the statistical distributions and kinetics of the fate decision mechanism obviate the need for a stable lymphoid progenitor expression code. Instead, a delay before commitment to alternative lineage programs might be sufficient. For example, if the average dwell time before excursions into positive feedback-stabilized GATA-1hi and PU.1hi regimes is long enough, a significant fraction of unstable PU.1lo precursors could be swept into the lymphoid program first. This diversion could be rendered irreversible by downstream “lockdown” in the lineage-specific programs. It is not clear whether the CLP intermediate itself has such lockdown mechanisms; however, in the case of B-cell
such as SCL/Tal-1, LMO-1 and LMO-2, and eventually of PU.1 (and Spi-B) itself [24**, 51, 52].
2.7
The Thymus Promotes the T-Lineage Fate Choice via Notch
Signaling
The regulatory space that is permissive for lymphocyte development is subdivided along axes on the basis of Notch activity and on the balance of E-box-binding transcription factors with Id (for “inhibitor of differentiation”) proteins (figure 2.2).
The regulation of differentiation and morphogenesis through Notch signaling is a recurring theme in a wide range of organisms and tissues. Even within hematopoiesis, Notch has diverse, context-dependent functions. For example, Notch signaling in the bone marrow can keep HSCs self-renewing [53], and the pathway also has important roles in the later,
immunological stages of lymphocyte development [54, 55]. A large transmembrane protein, Notch is found in four forms in mammals, encoded by paralogous genes expressed in distinctive but overlapping patterns. Notch has multiple activating ligands, antagonists and downstream pathways. The integration of a complex set of signaling inputs with a
developmentally specific transcription factor context underlies the multivalent character of Notch as a regulator.
Despite these poorly understood nuances, it does seem clear that activation of Notch by ligands produced in the thymus is the determining factor in channeling lymphoid
development away from the B-cell program and towards the T-cell program [55, 56]. We cannot exclude the possibility that the starting population of HSCs or multipotent
molecules. However, transgenically induced Notch signaling is sufficient by itself to produce T-lineage committed precursors in the bone marrow [57, 58*, 59, 60], whereas conditional knockout or inhibition of Notch1 signaling is sufficient to instigate B lymphopoiesis within the thymus [61–63].
The mechanisms by which Notch signaling induces the T-fate choice are still under investigation. Thymic stimulation of the Notch pathway is mediated by the binding of the Delta-like ligand to the Notch1 receptor. Notch signaling involves proteolytic cleavage that liberates the intracellular domain (Notch-ICN) as a consequence of ligand binding. Multiple downstream interactions are known or suspected to mediate the effects of Notch on gene expression, including the NF-kB pathway [64]. However, it appears that the impact of Notch on the T-fate choice is routed primarily through CSL (for CBF1, Suppressor of Hairless, Lag-1), also called recombination signal binding protein J (RBP-J), the mammalian ortholog of Drosophila Su(H). A ubiquitous transcriptional repressor, CSL binds to Notch-ICN, which incorporates a transcriptional activation domain. The CSL-Notch-ICN complex becomes an activator of the same genes that CSL alone would otherwise repress, creating a sharp binary switch in the regulatory state. Conditional knockout of CSL is sufficient to arrest T-cell development and divert progenitors to B-lineage fates in the thymus, while leaving myeloid and B development in the bone marrow untouched [65**].
At minimum, the Notch-ICN–CSL complex promotes T-lineage fates by initiating
though it has no essential functional role there. Nevertheless, although pTα plays an important part in advancing the T-cell development program, it seems improbable that its downstream effects can be felt early enough to block the B-lineage program.
HES-1, which is also upregulated by Notch-ICN–CSL, is a bHLH protein related to
Drosophila hairy and enhancer-of-split. It seems to function as an early T-lineage survival factor. It is critical for the expansion of T-lineage precursors during the first phase of TCR gene rearrangement [68]. However, the block to T-cell differentiation in HES-1-/- mice does not prevent T-lineage specification, in contrast to the situation in Notch1-/- mice.
Overexpression of HES-1 or the related gene HES-5 in bone marrow progenitors partially blocks B-cell development, albeit much more weakly than Notch-ICN itself [69*]. Thus, it seems that HES family gene induction mediates only a subset of the effects of Notch on the T/B lineage choice.
It has also been proposed that Notch signaling blocks the B-lineage differentiation program by antagonizing E47, an E-box transcription factor transcribed from the E2A locus [56]. E47 is centrally involved in B-cell commitment [3]: it participates in the regulation of virtually all B-cell genes, and activates EBF and in turn Pax5, the factor responsible for locking down the B lineage choice. However, E47 and its splice variant E12 also play
2.8
Id2 Titration of E Proteins Shunts Lymphoid-Inclined Progenitors
Towards the NK Fate
As effectors of innate immunity, NK cells resemble T cells morphologically, but forego the somatic gene rearrangements needed to generate the TCR. In contrast to B and T cells, NK cells can emerge from either the bone marrow or the thymus. Accordingly, they are neither inhibited by nor dependent upon Notch1 signaling [58*, 59, 71]. It appears that the decisive factor in the NK fate choice is an early, sustained inhibition of E protein function mediated by high levels of Id protein expression [72, 73**].
Both E proteins and Id proteins belong to the class of bHLH transcription factors. The E proteins bind E-box sites as dimers. Id proteins lack the basic regions needed for DNA binding, but can still dimerize with E proteins. The resulting E–Id heterodimers cannot bind DNA. Thus, Id proteins act as “dominant negative” stoichiometric antagonists, titrating the activity of the E factors. There is evidence that the Id proteins often act as buffers,
sequestering E proteins before they are needed to engage developmental programs.
As we have mentioned, the E47 protein is crucial to the initiation of the B-lineage program. E proteins also play a part in T-cell survival at early stages of commitment, including pTα
in the bone marrow [76]. Id2 knockouts give rise to T cells but not NK cells, whereas forced expression of the related Id3 protein pushes thymocytes towards the NK-cell fate [72, 77].
2.9
Lymphoid/Dendritic Cell Relationships: A Legacy of PU.1
Dependence?
The role we propose for PU.1 in the generation of lymphoid precursors could explain the close relationship between these cells and dendritic cells (DCs). DCs, similar to
macrophages, express PU.1 and depend upon PU.1 for their development in vivo [78, 79], and overexpression either of PU.1 or of its close relative, Spi-B, can cause preferential DC development [80*, 81]. Lymphoid precursors remain capable of differentiating into DCs, or in some cases into macrophages, until after the T- and B-lymphoid specification pathways have diverged [82–87]. In T-cell differentiation, PU.1 downregulation, shortly followed by Spi-B downregulation, coincides with the end of the period in which DC or macrophage differentiation can occur [28, 52, 86, 87, 88**]. In B cells, PU.1 and Spi-B continue to be expressed throughout maturation. This might underlie the susceptibility of some B-lineage cell types to conversion into macrophage-like cells, even after immunoglobulin gene rearrangement [82–84].
The other conditions that divide up the developmental potential space of lymphoid
precursors are all permissive for at least some classes of DCs. Notch signaling is not required for DC development, but equally, it is not inhibitory [71, 89]. In fact, Notch signaling can induce preferential DC-like differentiation from monocytes while blocking their
macrophage) development can result from an increase in the activity of PU.1 (or possibly Spi-B) across the whole plane of lymphoid-permissive conditions shown in figure 2.2.
2.10
Conclusions
In this discussion, we have reviewed evidence suggesting that the crucial conditions for initiating lymphoid development and specifying distinct lymphoid types are the balances established among different transcription factors, including PU.1, GATA-1, Notch-ICN– CSL, and E proteins versus Id proteins. In our model, the transcriptional subnet state PU.1lo GATA-1– “encodes” the lymphoid choice in a hematopoietic stem cell or an early,
multipotent progenitor. The Id2hi state shunts these progenitors towards the NK-lineage pathway, whereas CSL-mediated Notch signaling in response to an instructive Delta signal forces thymically localized cells towards the T-lineage pathway. The remainder of the lymphoid-tagged cells activate the B-cell program.
This model prompts us to classify the B-cell fate as the default pathway for lymphoid development, in as much as it pinpoints two agents, Notch and Id2, whose intervention appears to be required to promote the alternative T- and NK-lineage fates. Given our ignorance of the antecedents that establish the all-important E:Id protein expression profiles of lymphoid precursors, we should probably resist such a leap of logic. An evolutionary argument can be made for the NK cell as the founder member of the lymphoid class, and there is at least a suggestion of this in the way that E proteins play key roles both in B- and T-lineage fate commitment and in the downstream engagement of adaptive immunity-specific differentiation genes.
factors engage the selected developmental programs. The best-understood case, that of B cells, prominently features two additional transcription factors activated only within the B-cell pathway: EBF and Pax5. It is not known what factors might play corresponding roles in the T- or NK-lineage pathways. The most problematic part of the story is the means by which Notch signaling promotes the T-lineage fate at the expense of the B-lineage fate. We know that E proteins are critical in the early development of both lineages, but it remains obscure how the E protein-triggered cascade that leads to Pax5 expression and B-lineage commitment is disabled in Notch-activated thymic progenitors.
The biggest open question remaining, however, is the most interesting, and the most general in its implications: where does the diversity in the lineage-choice-directing factors come from? In lymphopoiesis, we have a partial answer for T cells, as we know that the T-lineage fate choice is directed by at least one instructive signal from the microenvironment, even if some of the details are uncertain. We can only speculate on the basis of the variety in
2.11
References and Recommended Reading
Papers of particular interest, published within the annual period of review, have been highlighted as follows: * of special interest; ** of outstanding interest.
1. Schebesta M, Pfeffer PL, Busslinger M: Control of pre-BCR signaling by Pax5-dependent activation of the BLNK gene. Immunity 2002, 17:473-485.
2. Schebesta M, Heavey B, Busslinger M: Transcriptional control of B-cell development. Curr Opin Immunol 2002, 14:216-223.
3. Quong MW, Romanow WJ, Murre C: E protein function in lymphocyte development. Annu Rev Immunol 2002, 20:301-322.
4.** DeKoter RP, Lee H-J, Singh H: PU.1 regulates expression of the interleukin-7 receptor in lymphoid progenitors. Immunity 2002, 16:297-309.
Hematopoietic progenitors recovered from PU.1-null mutant embryos do not express the lymphoid cytokine receptor gene IL-7Rα. Both PU.1 and IL-7Rα transgenes rescue B-lineage differentiation, which is normally abrogated in these mutants, PU.1 being more effective in this regard than IL-7Rα. Chromatin immunoprecipitation (ChIP) assays revealed that PU.1 binds directly to the IL-7Rα promoter. It therefore appears that PU.1 promotes early B-lineage development in large part by facilitating IL-7 signal transduction.
6. Sigvardsson M, O’Riordan M, Grosschedl R: EBF and E47 collaborate to induce
expression of the endogenous immunoglobulin surrogate light chain genes. Immunity 1997, 7:25-36.
7. Garvie CW, Hagman J, Wolberger C: Structural studies of Ets-1/Pax5 complex formation on DNA. Mol Cell 2001, 8:1267-1276.
8. Akashi K, Traver D, Miyamoto T, Weissman IL: A clonogenic common myeloid progenitor that gives rise to all myeloid lineages. Nature 2000, 404:193-197.
9. Kondo M, Weissman IL, Akashi K: Identification of clonogenic common lymphoid progenitors in mouse bone marrow. Cell 1997, 91:661-672.
10.* Rothenberg EV, Dionne CJ: Lineage plasticity and commitment in T-cell development. Immunol Rev 2002, 187:96-115.
This is an interpretive review that argues for a regulatory gene-based understanding of lymphoid lineage choices. Lymphoid developmental choices are characterized as more consistent with a “window of opportunity” model, based on the overlap of transcriptional regulators than with a particular mandated succession of binary choices. Also discussed is evidence that discrete lockdown functions are used to terminate developmental plasticity in T-cell development (see also [24**, 46**]).
11.** Rothenberg EV, Anderson MK: Elements of transcription factor network design for T-lineage specification. Devel Biol 2002, 246:29-44.
draft assembly of genetic regulatory network elements for T-cell specification and discusses the interpretation of the linkages in developmental terms (see also [24**, 46**]).
12. Hu M, Krause D, Greaves M, Sharkis S, Dexter M, Heyworth C, Enver T: Multilineage gene expression precedes commitment in the hemopoietic system. Genes Dev 1997, 11:774-785.
13.* Akashi K, He X, Chen J, Iwasaki H, Niu C, Steenhard B, Zhang J, Haug J, Li L: Transcriptional accessibility for multi-tissue and multi-hematopoietic lineage genes is hierarchically controlled during early hematopoiesis. Blood 2003, 101:383-389.
This paper presents the first systematic microarray hybridization analysis to compare gene expression patterns in hematopoietic stem cells with those of partially restricted CLPs and CMPs. The results emphasize the developmental breadth of gene expression pattern among primitive stem cells, and the role of negative as well as positive gene regulation in lineage commitment. The authors propose that stem cells start with a characteristically open chromatin conformation spanning many loci, giving rise to promiscuous, low-level expression of lineage-specific transcripts. In this model, lineage restriction involves the progressive closing of chromatin domains with the concomitant loss of promiscuous gene expression (see also [15**–17**]).
15.** Miyamoto T, Iwasaki H, Reizis B, Ye M, Graf T, Weissman IL, Akashi K: Myeloid or lymphoid promiscuity as a critical step in hematopoietic lineage commitment. Dev Cell 2002, 3:137-147.
Inspired by the approach of [12], this paper uses powerful single-cell gene-expression analyses to prove that individual cells of the CLP and CMP classes are generally lymphoid- or myeloid-restricted in their gene expression profiles, respectively. The authors also show that individual cells of the CLP and CMP classes simultaneously express sets of genes that are normally associated with mutually exclusive developmental fates in their descendants, albeit at levels approximately an order of magnitude below those characteristic of legitimate expression in committed cell types. CLPs coexpress genes that are both T- and B-cell specific, and CMPs coexpress genes that are both myeloid and erythroid specific. However, although HSCs promiscuously express a broad spectrum of hematopoietic lineage genes, they are largely devoid of lymphoid expression, perhaps reflecting the late emergence of lymphopoiesis in evolution. Considerable heterogeneity in gene expression profiles was also noted within each class of cells. Given the snapshot-like nature of the assay, these variations could represent either fluctuating levels in individual cells or a distribution of stable
expression patterns. The findings suggest that multipotency is sometimes mediated by coexpression of competing lineage programs at intermediate or “floating” levels as a prelude to exclusive, winner-takes-all commitment.
17.** Gounari F, Aifantis I, Martin C, Fehling HJ, Hoeflinger S, Leder P, von Boehmer H, Reizis B: Tracing lymphopoiesis with the aid of a pTα-controlled reporter gene. Nat Immunol 2002, 3:489-496.
These two papers, [16**, 17**], show that a practical implication of the multilineage gene activation in precursors is that lymphoid precursors can be recognized and isolated at an extremely early stage, by their expression of stable reporter genes under the control of early lymphoid regulatory elements. Cells expressing RAG1 [16**] or pTα [17**] are capable of differentiating into T, B, or NK cells, although in each case repression as well as activation of genes is seen with particular cell fates. This body of work emphasizes the regulatory instability of the intermediate states between hematopoietic stem cells and committed lymphoid precursors.
18. Davidson EH, Rast JP, Oliveri P, Ransick A, Calestani C, Yuh C-H, Minokawa T, Amore G, Hinman V, Arenas-Mena C et al.: A provisional regulatory gene network for specification of endomesoderm in the sea urchin embryo. Devel Biol 2002, 246:162-190.
19.** Davidson EH, Rast JP, Oliveri P, Ransick A, Calestani C, Yuh CH, Minokawa T, Amore G, Hinman V, Arenas-Mena C et al.: A genomic regulatory network for development. Science 2002, 295:1669-1678.
20. Tumpel S, Maconochie M, Wiedemann LM, Krumlauf R: Conservation and diversity in the cis-regulatory networks that integrate information controlling expression of Hoxa2 in hindbrain and cranial neural crest cells in vertebrates. Dev Biol 2002, 246:45-56.
21. Dasen JS, Rosenfeld MG: Combinatorial codes in signaling and synergy: lessons from pituitary development. Curr Opin Genet Dev 1999, 9:566-574.
22. Lloberas J, Soler C, Celada A: The key role of PU.1/SPI-1 in B cells, myeloid cells and macrophages. Immunol Today 1999, 20:184-189.
23. Fisher RC, Scott EW: Role of PU.1 in hematopoiesis. Stem Cells 1998, 16:25-37.
24.** Anderson MK, Weiss A, Hernandez-Hoyos G, Dionne CJ, Rothenberg EV: Constitutive expression of PU.1 in fetal hematopoietic progenitors blocks T-cell development at the pro-T stage. Immunity 2002, 16:285-296.
This work uses the approach pioneered in [77] to demonstrate an upper limit for PU.1 expression levels in T-cell precursors, similar to the dose-dependence of PU.1 activity in B-cell development [4**, 29]. The definition of the developmental window for PU.1 effects here correlates with in vivo regulation of PU.1 in normal pro-T cells, and links the perturbation to
in vivo developmental plasticity. The effects of PU.1 misexpression on the pattern of gene expression in a pro-T-like cell line are shown to be governed by bistable switchlike behavior that implicates additional network functions in the response.
26. Scott EW, Simon MC, Anastasi J, Singh H: Requirement of transcription factor PU.1 in the development of multiple hematopoietic lineages. Science 1994, 265:1573-1577.
27. McKercher SR, Torbett BE, Anderson KL, Henkel GW, Vestal DJ, Baribault H, Klemsz M, Feeney AJ, Wu GE, Paige CJ, Maki RA: Targeted disruption of the PU.1 gene results in multiple hematopoietic abnormalities. EMBO J 1996, 15:5647-5658.
28. Spain LM, Guerriero A, Kunjibettu S, Scott EW: T cell development in PU.1-deficient mice. J Immunol 1999, 163:2681-2687.
29. DeKoter RP, Singh H: Regulation of B lymphocyte and macrophage development by graded expression of PU.1. Science 2000, 288:1439-1441.
30. Berg LJ, Kang J: Molecular determinants of TCR expression and selection. Curr Opin Immunol 2001, 13:232-241.
31. Colucci F, Samson SI, DeKoter RP, Lantz O, Singh H, Di Santo JP: Differential
requirement for the transcription factor PU.1 in the generation of natural killer cells versus B and T cells. Blood 2001, 97:2625-2632.
32. Cantor AB, Orkin SH: Hematopoietic development: a balancing act. Curr Opin Genet Dev 2001, 11:513-519.
34. Nerlov C, Tenen DG, Graf T: Regulatory interactions between transcription factors and their role in hematopoietic lineage determination. In Hematopoiesis: a Developmental Approach. Edited by Zon LI. New York: Oxford University Press; 2001:363-367.
35.* Hong W, Kim AY, Ky S, Rakowski C, Seo S-B, Chakravarti D, Atchison M, Blobel GA: Inhibition of CBP-mediated protein acetylation by the Ets family oncoprotein PU.1. Mol Cell Biol 2002, 22:3729-3743.
This paper describes a mechanism through which PU.1 can antagonize GATA-1 activity by interference with its acetylation. Even if this should not turn out to be the major mechanism for PU.1/GATA antagonism, it could be significant as a way for PU.1 to selectively
antagonize acetylationdependent functions of GATA factors while permitting their acetylation-independent functions [36]. This mechanism could contribute to the
combinatorial regulatory potential for intermediate states in which both PU.1 and GATA factors are expressed.
36. Yamagata T, Mitani K, Oda H, Suzuki T, Honda H, Asai T, Maki K, Nakamoto T, Hirai H: Acetylation of GATA-3 affects T-cell survival and homing to secondary lymphoid organs. EMBO J 2000, 19:4676-4687.
37. Chen H, Ray-Gallet D, Zhang P, Hetherington CJ, Gonzalez DA, Zhang DE, Moreau-Gachelin F, Tenen DG: PU.1 (Spi-1) autoregulates its expression in myeloid cells. Oncogene 1995, 11:1549-1560.
39. Tsai SF, Strauss E, Orkin SH: Functional analysis and in vivo footprinting implicate the erythroid transcription factor GATA-1 as a positive regulator of its own promoter. Genes Dev 1991, 5:919-931.
40. Anderson KP, Crable SC, Lingrel JB: The GATA-E box-GATA motif in the EKLF promoter is required for in vivo expression. Blood 2000, 95:1652-1655.
41. Nerlov C, Graf T: PU.1 induces myeloid lineage commitment in multipotent hematopoietic progenitors. Genes Dev 1998, 12:2403-2412.
42.* Dahl R, Ramirez-Bergeron DL, Rao S, Simon MC: Spi-B can functionally replace PU.1 in myeloid but not lymphoid development. EMBO J 2002, 21:2220-2230.
This paper uses a knock-in system to test the interchangeability of Spi-B and PU.1. The results emphasize the key role of PU.1 and/or the perfect regulation of PU.1 levels to generate lymphoid lineages.
43. Chen D, Zhang G: Enforced expression of the GATA-3 transcription factor affects cell fate decisions in hematopoiesis. Exp Hematol 2001, 29:971-980.
44. Weiss MJ, Keller G, Orkin SH: Novel insights into erythroid development revealed through in vitro differentiation of GATA-1-embryonic stem cells. Genes Dev 1994, 8:1184-1197.
46.** Anderson MK, Hernandez-Hoyos G, Dionne CJ, Arias A, Chen D, Rothenberg EV: Definition of regulatory network elements for T-cell development by perturbation analysis with PU.1 and GATA-3. Devel Biol 2002, 246:103-121.
This paper presents evidence that T-cell specification depends on low levels, but not high levels, of GATA-3, just as it depends on low, but not high, levels of PU.1. This demonstrates the distinction between T-lymphoid regulatory requirements and the regulatory requirements of erythromegakaryocytic development, as emphasized in the accompanying review [11**]. An extensive analysis of gene-expression alterations in T-cell precursors under perturbation with GATA-3 and PU.1 leads to the assembly of the first draft assembly of regulatory network elements for T-cell specification.
47. Georgopoulos K: Transcription factors required for lymphoid lineage commitment. Curr Opin Immunol 1997, 9:222-227.
48. Brown KE, Guest SS, Smale ST, Hahm K, Merkenschlager M, Fisher AG: Association of transcriptionally silent genes with Ikaros complexes at centromeric heterochromatin. Cell 1997, 91:845-854.
49.* Mikkola I, Heavey B, Horcher M, Busslinger M: Reversion of B cell commitment upon loss of Pax5 expression. Science 2002, 297:110-113.
This paper formally proves that normal precursors undergoing B-cell specification cannot become committed without sustained expression of the lockdown functions provided by Pax5.
51. Herblot S, Steff AM, Hugo P, Aplan PD, Hoang T: SCL and LMO1 alter thymocyte differentiation: inhibition of E2A-HEB function and pre-Tα chain expression. Nat Immunol 2000, 1:138-144.
52. Anderson MK, Hernandez-Hoyos G, Diamond RA, Rothenberg EV: Precise developmental regulation of Ets family transcription factors during specification and commitment to the T cell lineage. Development 1999, 126:3131-3148.
53. Varnum-Finney B, Xu L, Brashem-Stein C, Nourigat C, Flowers D, Bakkour S, Pear WS, Bernstein ID: Pluripotent, cytokine-dependent, hematopoietic stem cells are immortalized by constitutive Notch1 signaling. Nat Med 2000, 6:1278-1281.
54. Allman D, Punt JA, Izon DJ, Aster JC, Pear WS: An invitation to T and more: notch signaling in lymphopoiesis. Cell 2002, 109(Suppl):S1-S11.
55. Borowski C, Martin C, Gounari F, Haughn L, Aifantis I, Grassi F, von Boehmer H: On the brink of becoming a T cell. Curr Opin Immunol 2002, 14:200-206.
56. MacDonald HR, Wilson A, Radtke F: Notch1 and T-cell development: insights from conditional knockout mice. Trends Immunol 2001, 22:155-160.
57. Allman D, Karnell FG, Punt JA, Bakkour S, Xu L, Myung P, Koretzky GA, Pui JC, Aster JC, Pear WS: Separation of Notch1 promoted lineage commitment and
expansion/transformation in developing T cells. J Exp Med 2001, 194:99-106.
This reference presents an in vitro culture system in which hematopoietic precursors can be isolated and shown to differentiate into T/NK precursors when transduced with activated Notch, losing B-cell differentiation activity. This confirms and extends earlier results from whole animal studies and culture systems that do not permit the direct determination of T-lineage potential [59–63].
59. Jaleco AC, Neves H, Hooijberg E, Gameiro P, Clode N, Haury M, Henrique D, Parreira L: Differential effects of Notch ligands Delta-1 and Jagged-1 in human lymphoid
differentiation. J Exp Med 2001, 194:991-1002.
60. Pui JC, Allman D, Xu L, DeRocco S, Karnell FG, Bakkour S, Lee JY, Kadesch T, Hardy RR, Aster JC, Pear WS: Notch1 expression in early lymphopoiesis influences B versus T lineage determination. Immunity 1999, 11:299-308.
61. Koch U, Lacombe TA, Holland D, Bowman JL, Cohen BL, Egan SE, Guidos CJ: Subversion of the T/B lineage decision in the thymus by lunatic fringe-mediated inhibition of Notch-1. Immunity 2001, 15:225-236.
62. Radtke F, Wilson A, Stark G, Bauer M, van Meerwijk J, MacDonald HR, Aguet M: Deficient T cell fate specification in mice with an induced inactivation of Notch1. Immunity 1999, 10:547-558.
63. Wilson A, MacDonald HR, Radtke F: Notch 1-deficient common lymphoid precursors adopt a B cell fate in the thymus. J Exp Med 2001, 194:1003-1012.
65.** Han H, Tanigaki K, Yamamoto N, Kuroda K, Yoshimoto M, Nakahata T, Ikuta K, Honjo T: Inducible gene knockout of transcription factor recombination signal binding protein-J reveals its essential role in T versus B lineage decision. Int Immunol 2002, 14:637-645.
Using a conditional knockout, the authors showed that CSL is essential for early T-cell differentiation in the thymus. The knockout also had the effect of inducing B lymphopoiesis in the thymus, again recapitulating the effects of a Notch knockout and supporting the central role of the CSL–Notch-ICN complex in regulating the B versus T lineage choice.
66.* Reizis B, Leder P: Direct induction of T lymphocyte-specific gene expression by the mammalian Notch signaling pathway. Genes Dev 2002, 16:295-300.
The first demonstration of a pathway through which a T-lineage-associated gene is directly regulated by Notch–CSL in the earliest stages of T-lineage specification. The initial onset of pTα expression is shown to depend on the CSL site in its cis-regulatory region for correct timing.
67. von Boehmer H, Aifantis I, Feinberg J, Lechner O, Saint-Ruf C, Walter U, Buer J, Azogui O: Pleiotropic changes controlled by the pre-T-cell receptor. Curr Opin Immunol 1999, 11:135-142.
68. Tomita K, Hattori M, Nakamura E, Nakanishi S, Minato N, Kageyama R: The bHLH gene Hes1 is essential for expansion of early T cell precursors. Genes Dev 1999, 13:1203-1210.
HES genes encode bHLH transcription factors that can act as repressors. HES-1 and HES-5 are directly upregulated by Notch via the CSL (here called CBF1) pathway. Transplantation of transgenic mouse bone-marrow tissue expressing either Hes family genes or Notch-ICN showed that, although constitutive Notch signaling leads to a complete block in B-lineage development, overexpression of HES-1 or HES-5 can produce a partial block. In a reporter gene assay, NotchIC, HES-1 and HES-5 (but not HES-2 or HES-3) were found to inhibit the transactivation potential of E2A, an E protein that plays a key role in B-lineage
commitment. These experiments suggest that Notch could suppress the B-lineage fate in part through HES-mediated repression of the E2A gene.
70. Zhuang Y, Barndt RJ, Pan L, Kelley R, Dai M: Functional replacement of the mouse E2A gene with a human HEB cDNA. Mol Cell Biol 1998, 18:3340-3349.
71. Radtke F, Ferrero I, Wilson A, Lees R, Aguet M, MacDonald HR: Notch1 deficiency dissociates the intrathymic development of dendritic cells and T cells. J Exp Med 2000, 191:1085-1094.
72. Yokota Y, Mansouri A, Mori S, Sugawara S, Adachi S, Nishikawa S, Gruss P:
Development of peripheral lymphoid organs and natural killer cells depends on the helix-loop-helix inhibitor Id2. Nature 1999, 397:702-706.
73.** Ikawa T, Fujimoto S, Kawamoto H, Katsura Y, Yokota Y: Commitment to natural killer cells requires the helix-loop-helix inhibitor Id2. Proc Natl Acad Sci USA 2001, 98:5164-5169.
expressing the NK cell marker CD122 (IL-2R) in the mutants. Overall thymocyte cellularity was about the same for mutant and wild type, which suggests that thymically localized hematopoietic progenitors simply follow the T-lineage program in the absence of Id2. Buttressing this inference, Id2-null fetal thymic organ culture (FTOC) failed to produce mature NK cells but exhibited normal T-cell development, whereas RT–PCR analysis of wild-type progenitors fractionated on the basis of CD122 expression revealed a strong correlation between Id2 levels and NK-lineage commitment.
74.* Kee BL, Bain G,Murre C: IL-7Rα and E47: independent pathways required for development of multipotent lymphoid progenitors. EMBO J 2002, 21:103-113.
This paper shows that the pathways regulating IL-7Rα expression and the pathways dependent on E47 are not redundant but complementary in promoting the survival of T-lymphoid progenitors through the earliest stages of their development.
75. Petersson K, Ivars F, Sigvardsson M: The pTα promoter and enhancer are direct targets for transactivation by E box-binding proteins. Eur J Immunol 2002, 32:911-920.
76. Rosmaraki EE, Douagi I, Roth C, Colucci F, Cumano A, Di Santo JP: Identification of committed NK cell progenitors in adult murine bone marrow. Eur J Immunol 2001, 31:1900-1909.
77. Heemskerk MHM, Blom B, Nolan G, Stegmann APA, Bakker AQ, Weijer K, Res PCM, Spits H: Inhibition of T cell and promotion ofnatural killer cell development by the
78. Anderson KL, Perkin H, Surh CD, Venturini S, Maki RA, Torbett BE: Transcription factor PU.1 is necessary for development of thymic and myeloid progenitor-derived dendritic cells. J Immunol 2000, 164:1855-1861.
79. Guerriero A, Langmuir PB, Spain LM, Scott EW: PU.1 is required for myeloid-derived but not lymphoid-derived dendritic cells. Blood 2000, 95:879-885.
80.* Schotte R, Rissoan MC, Bendriss-Vermare N, Bridon JM, Duhen T, Weijer K, Briere F, Spits H: The transcription factor Spi-B is expressed in plasmacytoid DC precursors and inhibits T, B, and NK cell development. Blood 2003, 101:1015-1023.
The PU.1 relative Spi-B has been shown to have similar effects to PU.1 itself when it is overexpressed in lymphoid precursors [24**]. Here, Spi-B is also shown to be expressed normally in the plasmacytoid class of DCs, and its overexpression enhances the generation of these cells from hematopoietic precursors in a permissive culture system. These
observations strengthen the link between the normal expression of Spi-B and PU.1, which continues through the early stages of T-cell development, and the ability of these early T-cell precursors to differentiate along the DC pathway.
81. Iwama A, Osawa M, Hirasawa R, Uchiyama N, Kaneko S, Onodera M, Shibuya K, Shibuya A, Vinson C, Tenen DG, Nakauchi H: Reciprocal roles for CCAAT/enhancer binding protein (C/EBP) and PU.1 transcription factors in Langerhans cell commitment. J Exp Med 2002, 195:547-558.
83. Principato M, Cleveland JL, Rapp UR, Holmes KL, Pierce JH, Morse HC III, Klinken SP: Transformation of murine bone marrow cells with combined v-raf-v- myc oncogenes yields clonally related mature B cells and macrophages. Mol Cell Biol 1990, 10:3562-3568.
84. Borrello MA, Phipps RP: The B/macrophage cell: an elusive link between CD5+ B lymphocytes and macrophages. Immunol Today 1996, 17:471-475.
85. Res PCM, Couwenberg F, Vyth-Dreese FA, Spits H: Expression of a pTα mRNA in a committed dendritic cell precursor in the human thymus. Blood 1999, 94:2647-2657.
86. Lee C-K, Kim K, Geiman TM, Murphy WJ, Muegge K, Durum SK: Cloning thymic precursor cells: demonstration that individual pro-T1 cells have dual T-NK potential and individual pro-T2 cells have dual αβ-γδ T cell potential. Cell Immunol 1999, 191:139-144.
87. Shortman K, Vremec D, Corcoran LM, Georgopoulos K, Lucas K, Wu L: The linkage between T-cell and dendritic cell development in the mouse thymus. Immunol Rev 1998, 165:39-46.
88.** King AG, Kondo M, Scherer DC, Weissman IL: Lineage infidelity in myeloid cells with TCR gene rearrangement: a latent developmental potential of pro-T cells revealed by ectopic cytokine receptor signaling. Proc Natl Acad Sci USA 2002, 99:4508-4513.
precursors are found to be fully committed. As discussed in [10*], the loss of responsiveness coincides with the timing of endogenous PU.1 downregulation. These results emphasize the regulatory instability of precursors during the first stages of lymphoid differentiation, even while the cells are initiating expression of T-cell genes such as pTα.
89. Ohishi K, Varnum-Finney B, Serda RE, Anasetti C, Bernstein ID: The Notch ligand, Delta-1, inhibits the differentiation of monocytes into macrophages but permits their differentiation into dendritic cells. Blood 2001, 98:1402-1407.
Chapter 3
SINGLE-CELL GENE-EXPRESSION ANALYSIS
3.1
Gene-Expression Assays
The “central dogma” of developmental biology holds that development is underwritten by regulated changes in gene expression. In order to study this process, we need techniques for measuring how gene activity patterns vary within the developing organism. Since most genes encode messenger RNAs which are translated into proteins, expression can be assessed at either the RNA or the protein level. In principle, protein quantitation is more informative, because only a gene’s peptide end product directly affects cell function. As translation and protein degradation can be loci for gene-specific regulation, RNA assays cannot capture all the expression changes which attend development. This is mitigated by the fact that post-transcriptional control is often effected by post-transcriptional modulation of regulatory genes. Moreover, it has been discovered recently that eukaryotic genomes harbor large, previously unrecognized classes of untranslated genes, such as microRNAs and shRNAs [1-3]. These genes encode short RNAs which modulate translation, mRNA degradation, epigenetic silencing, and perhaps still other processes; many seem to be involved in developmental processes. It seems likely, then, that most of the gene-expression changes involved in development are associated with measurable changes in the level of cellular RNAs.
3.1.1 In Vivo Assays
protein (e.g., Green Fluorescent Protein, or GFP), or an enzyme which catalyzes the production of a visualizable product (e.g., β-galactosidase or luciferase), is introduced into a living organism. The transgene may be expressed under the control of a promoter sequence derived from a gene of interest, so that its spatiotemporal expression recapitulates that of the natural gene. Alternatively, the endogenous gene is replaced with one encoding a fusion protein which incorporates a reporter peptide sequence into the natural product. Reporter genes can provide unprecedented insight into developmental processes, and have also been used to study the basic mechanisms of gene regulation. Advanced microscopy techniques allow reporter expression to be evaluated at the single-cell level—in some cases, even at the single-molecule level. Reporter-based experiments have been used to investigate the sources of noise in gene expression [4, 5]; to characterize a stochastic genetic switch [6, 7]; to
evaluate the “gene regulation function” of a gene [4, 8]; to analyze the behavior of natural and artificial transcriptional circuits [7, 9, 10]; to demonstrate the bursty nature of translation [11]; and, to quantitate the kinetics of transcription factor induction, binding, and facilitated (1D/3D) diffusion [12]. Of course, the experimental procedures involved in reporter-based studies are difficult and time consuming. Another important limitation is that these analyses are generally limited to evaluating a single gene, or at most a very few genes, at one time.
3.1.2 In Situ Assays
other cellular macromolecules with some degree of specificity. The generality and selectivity of the histological staining approach has been greatly enhanced by the development of immunological methods, and it is now possible to make dye-conjugated antibodies to label almost any protein of interest. In situ staining of RNA targets can be achieved with
oligonucleotide hybridization probes. In traditional in situ hybridization (ISH) protocols, a radioactive probe is used to label the RNA of interest. This approach is being supplanted by fluorescence in situ hybridization (FISH), which employs dye-conjugated probes.
Techniques like confocal microscopy have made it possible to look at the subcellular localization of protein or RNA targets with fluorophore-tagged antibodies or oligo probes. Advanced FISH protocols have been used to take snapshots of transcriptionally active genes, and to count RNA transcripts in the nuclei and cytoplasm of individual mammalian cells; these studies have revealed the bursty character of transcription, and suggest that gene expression in eukaryotes involves the stochastic decondensation of large chromatin domains [13-15]. Fluorescence-based assays can be multiplexed through the use of multiple dye colors in the same assay. Generally, spectral overlap between dyes severely limits the number of targets that can be assayed in the same in situ experiment; however, simultaneous evaluation of ten different genes has been demonstrated using a bar-coding strategy in which different fluorophore combinations are assigned to each RNA target [13].
3.1.3 In Vitro Assays
yielded by in vivo and in situ methods tend to be non-quantitative, and generally do not lend themselves to statistical analysis, collation in public databases, or systematic data mining. In vitro protein and RNA assays were originally developed to facilitate detection of rare
molecular species in homogenized samples using specialized chemistries. Improvements in the sensitivity of these molecular assays, and in the technology for reading out the results, have yielded methods which can rapidly and inexpensively generate masses of quantitative gene-expression data. In consequence, the term gene profiling is now almost synonymous with the use of in vitro techniques such as quantitative RT-PCR (qRT-PCR) and “gene chip” arrays.
3.1.3.1 Protein Assays
Antibody-based protein assays such as western blot, chromatin immunoprecipitation (ChIP), and Enzyme-Linked Immunosorbent Assay (ELISA) are widely used to isolate, detect and quantitate specific proteins within homogenized samples. However, the production of an antibody against a novel protein target is a lengthy and expensive process. Moreover, the specificity of protein-antibody binding in any given experimental context is unpredictable, so immunological assays frequently require considerable optimization. These techniques are incompatible with high-order multiplexing and, since proteins cannot be amplified, relatively large amounts of analyte are required to perform even a single assay.
3.1.3.1.1 Immuno-PCR
of two antibodies to the same molecule brings these “tails” into proximity, establishing a substrate for ligation and qPCR-based quantification. Immuno-PCR is at least a hundred times as sensitive as ELISA, the traditional “gold standard” for in vitro protein detection. In principle, the method can detect a single protein molecule. This level of sensitivity is rarely approached in practice owing to the relatively poor specificity of antibody-target binding.
3.1.3.1.2 Protein Microarrays
Highly multiplexed protein microarray assays have recently become available [18]. In a protein microarray, antibody probes for thousands of different targets are arrayed on a solid substrate. A sample of protein extract is incubated on the array, and the probes capture and segregate their specific targets. The array is imaged after the incubation to obtain the abundance profile of the probed species. The antigens bound to the antibody array can be detected using a variety of different labeling techniques—for example, covalent coupling of fluorophores to the sample proteins prior to the incubation step. Typically, the intensities of equivalent spots in assays run on distinct biological samples are compared to read out fold differences in the expression of the associated species; absolute quantitation and interspecies abundance comparisons are generally not supported.
3.1.3.1.3 FACS
analysis. Within the instrument, cells are pressure-fed through a narrow channel in single file. Each cell is individually illuminated by a laser and photodetectors measure the light output, thus affording a quantitative readout of protein expression. The more sophisticated instruments incorporate a programmable electrostatic cell-deflection mechanism which permits the selective recovery of cells based on surface phenotype. FACS is therefore a powerful tool for sorting and purifying cells, as well as for protein expression analysis.
The latest generation of cell sorters can analyze thousands of cells per second. Advances in optics and dye chemistry are constantly increasing the number of different cell-surface markers which can be evaluated simultaneously [19-21]. Four- or five-way multiplexing is now common practice. High-end systems can support the quantification of ten or more proteins at once, although exploiting their full potential remains challenging given the unpredictable specificity of antibody labeling. While FACS is normally used to analyze surface-protein expression, intracellular protein levels can be evaluated in situ in fixed, permeabilized cells. This is still relatively uncommon, owing to the limited availability of antibodies against intracellular proteins and the complexity of the sample preparation protocol. Intracellular fluorescent reporters such as GFP can be assayed without the need for permeabilization and staining [22, 23].
expression measurements on samples derived from thousands or even millions of individual cells. For developmental studies, the significance of the data they produce is limited by the phenotypic purity of the cells contributing to the analyte. In contrast, FACS can be used to explore the population structure of a biological sample. By revealing how morphologically similar cells cluster into subpopulations when viewed in gene-expression space, FACS has spurred the stepwise refinement of cell taxonomies. As the classification of developmental progenitors gets more fine grained, it becomes more practical to pinpoint the regulatory events which move differentiation forward. From this standpoint, the main limitation of FACS is that it does not let us follow these events directly, since the key actors involved are predominantly transcription factors which operate within the cell nucleus.
3.1.3.2 RNA Assays
cell. It can also provide more accurate quantification of specific transcripts, and is the most flexible and cost-effective assay for focused studies targeting from one to a few dozen genes.
3.1.3.2.1 SAGE
In SAGE, the messenger RNA fraction of an RNA isolate is reverse transcribed into cDNA using oligo(dT) primers that bind the transcripts’ poly(A) tails. Special restriction enzymes are used to clip short (10–14 bp) fragments from the transcripts; these “tags” are amplified by PCR and the products are ligated together to form long “concatamers” which are cloned and sequenced. The resulting sequence data is parsed to determine the relative frequencies of recovered tags in the cDNA pool. These “expressed sequence tags” (ESTs) can be matched against cDNA and genomic sequence databases to profile the abundance of known mRNAs, individual exons, and previously unknown transcripts in the original sample. As with all techniques which rely on global reverse transcription of mRNA, SAGE incurs the risk of underrepresenting hard-to-transcribe sequences. In addition, while the tag-sampling approach may give fairly accurate profiling of particular exons, it cannot accurately measure the abundance of specific mRNA splice forms.
Other sequencing-based profiling strategies can provide the coverage of SAGE while
3.1.3.2.2 Microarray Analysis
In microarray analysis, polyadenylated RNA is globally reverse transcribed into cDNA using oligo(dT) primers, fluorescently labeled, and hybridized to immobilized oligonucleotide or cDNA probes arrayed on a glass slide or a “gene chip.” In some protocols, the cDNA pool is used to template runoff RNA transcription reactions, in which case complementary RNA (cRNA) rather than cDNA is hybridized to the array. Dye labels are incorporated into the transcripts using fluorophore-tagged primers or by means of covalent-coupling chemistries. Following hybridization of the analyte, the microarray is imaged to obtain a readout of the mRNA expression profile in the original sample. Typically, microarray analyses are run in parallel on at least two biologically distinct samples; after normalization to allow for global variations in signal level, relative spot intensities are used to estimate fold expression changes in differentially regulated genes.
3.1.3.2.3 Quantitative RT-PCR
Quantitative RT-PCR is currently the “gold standard” for mRNA analysis, offering the best sensitivity, dynamic range, and reproducibility of any standard technique [27]. In qRT-PCR, mRNA transcripts are first reverse transcribed into cDNA using oligo(dT), random
since very small amounts of template are required, evaluation of multiple targets can usually be achieved more easily by aliquoting sample to parallel simplex qPCR reactions.
3.2
Single-Cell Analysis
With the exception of FACS, in vitro protein assays are generally insufficiently sensitive to carry out expression analysis on individual cells. RNA assays are more readily adapted to this task, but single-cell mRNA profiling is still uncommon. The first studies were reported about twenty years ago, and several dozen more have since appeared in the literature. The main obstacle that must be overcome is the tiny quantity of RNA recoverable from an individual cell. Most mammalian cells contain about 10–40 pg of RNA, of which about 0.1– 1 pg is mRNA, corresponding to 105–106 messages [30-32]. The mRNA population of these cells includes ~104 transcript species, mostly present at below ten copies. Housekeeping and effector genes tend to be expressed at medium-to-high levels (102–104 copies). Transcription factors, which are among the most interesting targets for developmental studies, are usually expressed at low abundance (<100 copies) even when the genes are fully active.
3.2.1 Technical Approaches
Standard SAGE and microarray protocols call for microgram quantities of input material, corresponding to on the order of 106 cells’ worth of RNA. The sample requirement can be reduced by two orders of magnitude in advanced versions of these assays [33, 34]. Global mRNA amplification methods have been developed which can generate sufficient analyte from much smaller amounts of RNA; the most popular approaches are runoff transcription from cDNA templates, and PCR amplification of cDNA using generic primers. Both
in applying SAGE to single cell analysis, presumably because of the labor and expense that would be entailed in the processing of each individual sample.
In principle, qRT-PCR can detect a single molecule of messenger RNA. With efficient reverse transcription, detection of one mRNA copy using standard qPCR dye chemistries requires about forty cycles of PCR; a typical housekeeping transcript in a single cell might be detected after around thirty cycles of amplification. However, the RNA input for gene profiling experiments is routinely scaled to support detection after around 15–25 PCR cycles, as this is considered the most trustworthy regime for quantitation. qRT-PCR-based
expression profiling is therefore usually performed on homogenized samples derived from hundreds or thousands of cells. While conventional protocols have occasionally been applied to quantitate mRNA transcripts in single-cell lysates, such assays have been limited to the evaluation of a few, relatively highly expressed genes.
The difficulty of achieving reliable qRT-PCR quantitation from a single cell is compounded when multiple genes or rare transcripts are targeted in the analysis. Global mRNA