DOI: 10.1051/epjconf/20135304003 C
Owned by the authors, published by EDP Sciences, 2013
The Yakutsk array experiment: Main results and future
directions
Anatoly Ivanov
afor the Yakutsk array group
bShafer Institute for Cosmophysical Research & Aeronomy, Lenin Avenue, 31, Yakutsk 677980, Russia
Abstract.The results of the Yakutsk array experiment aimed at investigations of ultra-high energy cosmic rays (UHECRs) are presented. We outline the current status of the instrument and an outlook for future directions and areas of study.
1. INTRODUCTION
- In 1959 D.D. Krasilnikov has formulated an idea of the EAS array in Yakutsk [1]; - 1967: The construction begun of EAS-13 prototype;
- 1970: Engineering stage built up; first showers detected;
- To 1973 the 1st stage array was completed consisting of 43 stations with 2 scintillators, Cherenkov light detectors, detectors of muons;
- 1991: the 2nd stage of the array completed. Infill array of 18 stations, and a large area muon detector were added;
- In 2005 the array modernization program was approved.
2. PRESENT STATUS OF THE YAKUTSK ARRAY EXPERIMENT
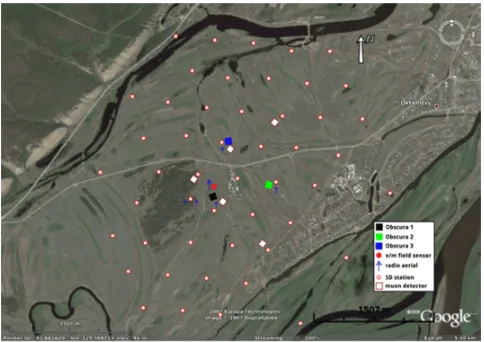
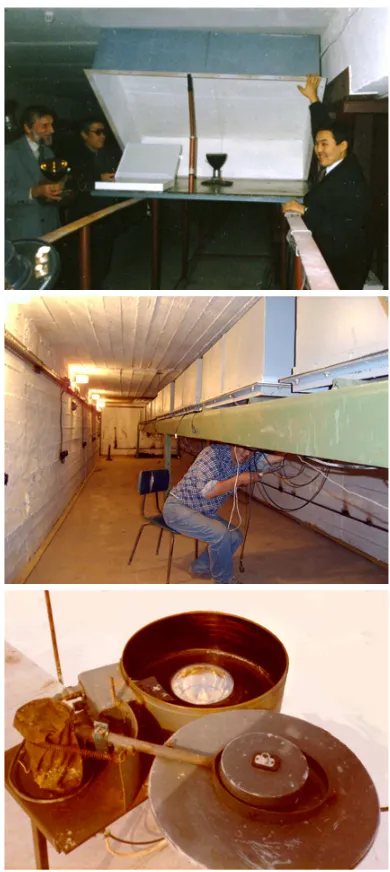
A schematic view of the present layout of the array detectors and photos of the main detectors are shown in Figs.1,2. 58 stations are distributed within the triangular hierarchical grid of the total area1 10 km2. The three main components of EAS are detected with scintillators, 6 muon detectors and 48 air Cherenkov light detectors [2,3]. The shower events are selected by the coincidence of signals from n≥3 stations, which in turn have triggered by the two scintillation detectors in each station.
Actually, all detectors of the array are obsolete, energy estimation and angular resolution accuracies are insufficient; the array is urgently needed for modernization [4].
3. MAIN RESULTS AND FUTURE DIRECTIONS OF INVESTIGATIONS
In this section we briefly overview some results of the Yakutsk array experiment concerning, mainly, astrophysics of UHECRs and our purposes for a future.
ae-mail:[email protected]
bFor the full authorlist see Appendix “Collaborations” in this volume. 18.2 km2since 2010
Figure 1. The map of the Yakutsk array.
Energy spectrum of CRs measured with the Yakutsk array in the energy rangeE∈(1015, 1020) eV
is shown in Fig.3in comparison with some other relevant experiments. All the data are in agreement with the ‘knee’, ‘ankle’ and GZK suppression features in the spectrum [5], if to correct CR intensities observed and to scale the energies estimated by the arrays, for instance, along suggestion [6].
The mean shower maximum depth in the atmosphere, Xmax, is estimated using the connection
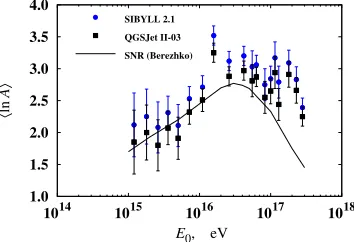
between this parameter and the lateral distribution slope of Cherenkov light intensity and the half-width of the signal at the ground level [7] (Fig.4). This data are used to estimate the average mass of CR particles using Horandel’s relation [8] (Fig.5). TheXmaxpositions are calculated with QGSJet
II-03 and SIBYLL 2.1 models, while the expected GCR composition is given by the SNR model [9]. A comparison with GCR simulation results demonstrates a consistent behavior oflnAchanging with energy: in the range E∈(1015, 1016) eV the composition becomes heavier, the average mass gets its maximum, then the composition becomes lighter above the energy∼3×10¹⁶eV.
Arrival directions of UHECRs detected with the Yakutsk array were analyzed in conjunction with the data from other arrays searching for correlation with the two large-scale structures in the nearby universe – Milky Way disk within the Galaxy and the supergalactic plane (SGP) in the local galactic field [10]. We have used the (super)galactic plane enhancement parameter,R, defined as
R= n(|b|< d)−n(|b| ≥d)
n(|b|< d)+n(|b| ≥d),R =2
n(|b|< d)n(|b| ≥d) (n(|b|< d)+n(|b| ≥d))3,
where b is the (super)galactic latitude;d =100 is the plane border. The results are shown in Fig. 6
taken from [11], in comparison with an expected-for-isotropyR0calculated by the Monte Carlo method
(N =106). There is no statistically significant excess flux from the galactic disk and SGP in the whole energy range, but it seems to be a systematic increase of the UHECR flux from the SGP according to the Yakutsk array data which is supported by the data from AGASA and PAO above 4×10¹⁸eV: all the
observed enhancement parameters are greater than those expected in the isotropic case.
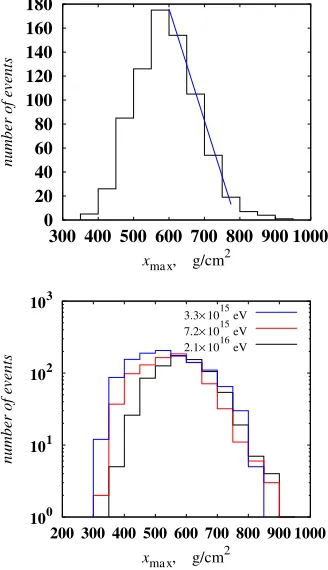
Distribution ofXmax, namely, the slope of distribution,, beyond the peak (Fig.7, upper panel),
can be used to estimate the total inelastic proton-air cross-section,p−air, using model simulation of the
relation=Kp−air[12]. Basing on our measuredXmaxdistributions (Fig.7, bottom panel) at energies
3.3×10¹⁵eV, 7.2×10¹⁵eV, 2.1×10¹⁶eV, we have estimated proton-air cross-section [13]. Figure8
Figure 2.Main detectors of the array: scintillator (top); muonic (middle); Cherenkov (bottom).
results in the energy range (1011, 1020) eV. Our previous estimations [14] are shown, as well. As it is seen from the Figure, CR data together with accelerator data set some limits on hadronic interaction models used to describe EAS development at the highest energies.
4.0 4.2 4.4 4.6 4.8 5.0 5.2
14 15 16 17 18
log 10 (J E 2.75 , GeV 1.75 m -2s -1sr -1)
log10(E, eV)
23.5 24.5 25.5
18 19 20
log 10 (J*E 3,m -2 s -1 sr -1 eV 2)
log10(E, eV) HiRes
AGASA
PAO Yakutsk, sc Yakutsk, Ch
Figure 3. Differential energy spectrum of CRs below (left panel) and above (right panel)E=1018eV measured
with the Yakutsk array are shown in comparison with other experiments. CR intensity and energy are corrected for systematic errors. Details are given in the text.
550 600 650 700 750 800 850
1017 1018 1019 1020
〈
xmax
〉
, g/cm
2
E0, eV
Yakutsk CASA-MIA PAO TA QGSJetII EPOS-1.6 SIBYLL-2.1
Figure 4. Depth of EAS maximum: measurements and models atE >1017eV.
1.0 1.5 2.0 2.5 3.0 3.5 4.0
1014 1015 1016 1017 1018
〈
ln
A
〉
E0, eV SIBYLL 2.1
QGSJet II-03
SNR (Berezhko)
Figure 5. The average mass,lnA, as a function of energy. Models SIBYLL 2.1 and QGSJET II-03 are used to
estimatelnAbasing onXmax(E) measured with the Yakutsk array.
4. MODERNIZATION OF THE ARRAY
The modernization program of the array is aimed at a set of items:
– Is the knee in energy spectrum due to the energy/mass distribution of GCR sources, or to the CR diffusion in G magnetic fields?
-0.4 0 0.4 0.8
1 10 100
E, EeV
R-R0
-0.2 0 0.2 0.4 0.6 0.8
1 10 100
E, EeV
R-R0
Figure 6.A search for excess flux from galactic (left panel) and supergalactic (right panel) planes.
0 20 40 60 80 100 120 140 160 180
300 400 500 600 700 800 900 1000
number of events
xma x, g/cm2
100 101 102 103
200 300 400 500 600 700 800 900 1000
number of events
xma x, g/cm2
2.1×10¹⁶eV
7.2×10¹⁵eV
3.3×10¹⁵eV
Figure 7.Upper panel: estimation ofXmaxdistribution slope. Bottom panel: experimentalXmaxdistributions.
– Where is the transition region between G & EG components of CRs?
– Which features of CRs should be measured in a future to constrain a variety of CR acceleration and propagation models?
The key to this program is an accurate determination of the mass composition of CRs (Fig.10), which is a weak point of existing EAS arrays. We plan to adapt the well-known imaging Cherenkov telescope technique to measure the angular and temporal structure of the signal connected to EAS longitudinal profile, and hence toXmaxand the mass composition of CRs aboveE=1015eV [16].
200 300 400 500 600 700
1011 1012 1013 1014 1015 1016 1017 1018 1019 1020
102 103 104 105
σp-air
, mb
E , eV
Ec.m. , GeV
Tevatron LHC QGSJET01c SIBYLL2.1 EPOS-1.61 Theory Experiment Yakutsk Fly’s Eye HiRes Narikura EAS-TOP Tien Shan ARGO-YBJ Akeno PAO Tevatron
Figure 8. Total inelastic proton-air cross section. Experimental data and hadronic interaction model calculations.
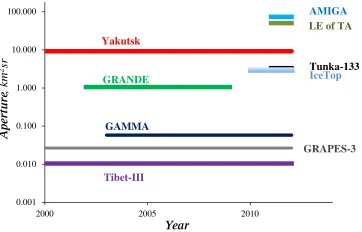
0.001 0.010 0.100 1.000 10.000 100.000
2000 2005 2010
Year
Aperture
, km
2sr
AMIGA LE of TA
Yakutsk GRANDE Tibet-III IceTop Tunka-133 GAMMA GRAPES-3
Figure 9. Comparing array apertures in the energy range 1014–1017eV.
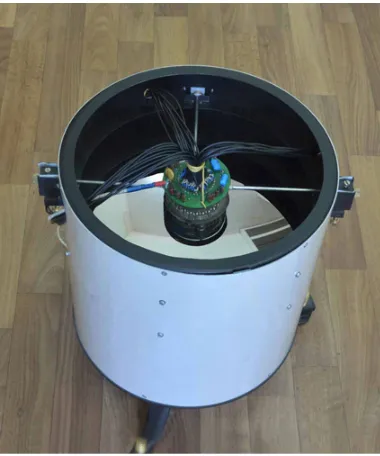
Figure 11.The detector made of plastic scintillator.
Figure 12.A scheme of camera obscura detector working.
assemble new station controllers to achieve the accuracy of timing∼10 ns; construct new differential detectors to measure the air Cherenkov light; modernize muon detectors; create a radio detection system of EAS in the frequency range from∼10 GHz to∼10 MHz.
Particularly, soft component detector will consist of one layer (1 m2area, 1–3 cm thickness) plastic scintillator manufactured in the Institute of High Energy Physics, Protvino (Fig.11). New stations in a triangular grid with appropriate spacing will consist of two detectors in metal housing. All the data will be transmitted to the central processor where the shower events have to be triggered via the signal coincidences.
A snapshot of the longitudinal profile of the cascade in Cherenkov light will be taken with the camera obscura detectors (Fig.12) and wide FOV Cherenkov telescopes (Fig.13). The angular and temporal structure of the signal will be used to locate Xmax and to estimate the mass composition of CRs at
energies above 1015eV [16].
To verify the ability of air Cherenkov light differential detectors to discriminate angular and temporal profiles of signals from showers initiated by primary nuclei and photons at energies above 1015eV, we
Figure 13. Wide FOV Cherenkov telescope.
0.00 0.05 0.10 0.15
60 70 80 90
Viewing angle, degree
Relati
ve intensity
Figure 14. Angular profile of the Cherenkov signal from EAS.
E=1015eV. It appears from the Figure that the angular resolution∼10and time resolutiont <10 ns
of the Cherenkov telescope are sufficient to distinguish the primaries, at least the -quanta from the nuclei, basing on the angular and temporal distributions of the signal.
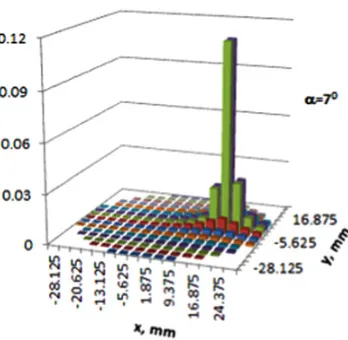
The result of ray tracing within the telescope is shown in Fig.16. The light intensity from a distant point source with slant angle=70is shown as a function of coordinates on the camera surface. Pixel
size is 3.75×3.75 mm2. This demonstrates the ability of our prototype Cherenkov telescope to convert
0 0.002 0.004 0.006 0.008
0 200 400 600 800 1000
t, ns
R
e
lative intensity
Figure 15.Temporal profile of the Cherenkov signal from EAS.
Figure 16.Image of a distant point source in the Cherenkov telescope.
5. CONCLUSIONS
– The main object to study with the Yakutsk array modernized is the transition region between G and EG components of CRs;
– Another task is to measure the intrinsic features of G component of CRs: energy spectrum and mass composition of GCRs will be measured with the Yakutsk array modernized. Sources of GCRs will be searched for;
– Longitudinal profile of the showers will be measured with differential detectors of air Cherenkov light from EAS;
– Another future direction is a co-operation with the CR community in dealing with a next-generation ground based detector of EG CRs.
References
[1] M.N. Dyakonov et al.,Cosmic Rays of Extremely High Energy(Nauka, Novosibirsk, 1991) [2] V.P. Egorova et al., Nucl. Phys. B (Proc. Suppl.)136(2004) 3
[3] A.A. Ivanov, S.P. Knurenko I.Ye. Sleptsov, New Journ. of Phys.11(2009) 065008 [4] A.A. Ivanov et al., Proc. 26th ICRC, Beijing1(2011) 186
[5] M. Nagano and A.A. Watson, Rev. Mod. Phys.72(2000) 689 [6] A.A. Ivanov, Astrophys. Journ.712(2010) 746
[7] S.P. Knurenko and A.V. Sabourov, This Conference, ID:43, (2012) [8] J.R. Horandel et al., J. Phys.: Conf. Ser.47(2006) 41
[9] E.G. Berezhko, H.J. Volk, Astrophys. Journ.661(2007) L175 [10] G. de Vaucouleurs, Astron. Journ.58(1953) 30
[11] A.A. Ivanov, Nucl. Phys. B (Proc. Suppl.)190(2009) 204 [12] R.W. Ellsworth et al., Phys. Rev. D26(1982) 336
[13] S.P. Knurenko and A.V. Sabourov, This Conference, ID:42, (2012) [14] S.P. Knurenko et al., Proc. 26th ICRC, Salt Lake City1(1999) 372