A Study of Regional
Determinants of Mortality
Differentials in Children (Kenya)
Henry Abraham Ochieng Ondolo
Thesis submitted for the degree of Doctor of Philosophy
of the University of London
Institute of Child Health
University of London
ProQuest Number: 10106601
All rights reserved
INFORMATION TO ALL USERS
The quality of this reproduction is dependent upon the quality of the copy submitted.
In the unlikely event that the author did not send a complete manuscript and there are missing pages, these will be noted. Also, if material had to be removed,
a note will indicate the deletion.
uest.
ProQuest 10106601
Published by ProQuest LLC(2016). Copyright of the Dissertation is held by the Author.
All rights reserved.
This work is protected against unauthorized copying under Title 17, United States Code. Microform Edition © ProQuest LLC.
ProQuest LLC
789 East Eisenhower Parkway P.O. Box 1346
ABSTRACT
A community-based study o f Regional Determinants o f Mortality Differentials in
Children, was conducted in 1994 in 4 randomly selected communities in two
neighbouring districts o f Homa Bay and Kisii in Nyanza Province, Kenya. Aim: to
investigate why child mortality differentials exist between and within the districts of
Kenya which have identical infrastructures for the delivery o f social services.
Methodology: Data was collected by retrospective recall on the reproductive health of
women o f child bearing age and the health o f their children bom within five years prior to
the study. Concurrent data was collected on the same children, their parents and
household. Secondary data was used to describe the environmental conditions. Result:
The study established that for the period covered by the study (1989-1994) child
mortality differential o f 2.3 fold exists between the two districts (1.7 fold between
communities in the high mortality district and 2 fold in the low child mortality district).
The largest difference recorded in the study was 4.5 fold between two communities with
the highest and lowest child mortality. Among the infants which accounted for 67% o f all
child deaths, the differential was 9.7 fold between the two communities. Measles, malarta
and tetanus emerged as the major causes o f death in the highest mortality community but
none o f them was reported in lowest mortality area. Mortality rates were inversely related
to the altitudes o f the study communities. The socioeconomic, cultural and demographic
factors, which were significantly associated with child mortality are the number o f
children bom to a mother in five years, age at marriage, age at first delivery, place o f last
delivery and level o f education (all maternal factors); father’s income level; ownership o f
radio; and presence o f a toilet in the compound. In high mortality community where
multiple infections acted synergistically, the risk o f child death increased by 8 times if the
mother experienced 3-4 compared to those with 1-2. live births in five years.
Conclusions: Currently there is no documented information on child mortality at the sub
district level for informed decision about effective interventions on child mortality; there
are synergistic interactions between environmental, socioeconomic, cultural and
demographic determinants o f child mortality on one hand and infections on the other; and
Recommendations: There is need for: complete and accurate birth and death certification,
including cause o f death desegregated by local area; intensive supervision o f
immunization programme to achieve coverage rates o f 80% and above; inter-disciplinary
district-wide surveys to generate local area statistics for assessment o f health and
economic status in order to identify high risk communities and to monitor trend o f
change; further surveys in areas o f high mortality to identify possible contributory
factors; to set short- and long-term goals to address the emerging socioeconomic,
demographic and cultural factors relevant to the improvement o f the health o f the mothers
and children in various communities; and re-orientation and re-organization towards a
“People-centred Health Policy ” which focuses on the determinants o f the common
endemic diseases. In such a policy the emphasis will be on public information as much as
TABLE OF CONTENTS Page
List o f Tables 7
List o f Figures 10
List o f Maps 10
List o f abbreviations 11
Dedication 12
Acknowledgment 13
Outline o f the thesis 14
SECTION ONE: BACKGROUND TO THE STUDY
15CHAPTER ONE: BACKGROUND TO THE STUDY 17
1.1: INTRODUCTION 17
1.2: DEFINITION OF TERMINOLOGY 18
1.3: KENYA 20
1.3.1 The state o f the Kenyan children 20
1.3.2 Environment, physical and geographical features 24 1.3.3 Demographic profile o f the Kenyan population 28 1.3.4 Political and administrative infrastructures 31
1.4: JUSTIFICATION FOR THE STUDY ' 33
1.4.1 Research question 33
1.4.2 Rationale for selecting the study communities 34
1.4.3 Objectives o f the study 34
1.5: LITERATURE REVIEW 38
1.5.1 Common childhood infections 3 8
1.5.2 Health services 44
1.5.3 Education 45
1.5.4 Economic status 47
1.5.5 The environment 48
CHAPTER TWO: THE STUDY COMMUNITIES 52
2.1 : NYANZA PROVINCE 52
2.2: ENVIRONMENT AND THE COMMUNITY 52
2.2.1 Topography 52
2.2.2 Water 54
2.2.3 Climate 54
2.3 : DEMOGRAPHIC PROFILE OF THE NYANZA POPULATION 56
2.3.1 Population distribution 56
2.3.2 The people in the study communities 59
2.4: SUMMARY OF THE MAIN FEATURES OF NYANZA PROVINCE 62
CHAPTER THREE: RESEARCH DESIGN 65
3.1 PREPARATION AND APPROVAL OF THE STUDY PROTOCOL 65
3.2 THE STUDY DESIGN 65
3.3 SELECTION OF THE STUDY AREA AND POPULATION 67
3.3.1 The sampling framework 67
3.3.2 The study population and sample size 69
3.4 METHODS OF DATA COLLECTION 69
3.5 DATA MANAGEMENT 73
3.6 STRENGTHS AND LIMITATIONS OF THE STUDY 75
3.6.1 Strengths o f the study and research design 75
3.6.2 Potential areas o f bias 75
SECTION TWO: DESCRIPTION OF RESEARCH FINDINGS
77
CHAPTER FOUR: CHILD HEALTH AND SURVIVOURSHIP 78
4.1 THE UNDER-FIVE CHILD POPULATION AND SURVIVOURSHIP 78
4.1.1 Birth and mortality rates 78
4.2 CHILD MORBIDITY AND MORTALITY PATTERNS 84
4.2.1 Childhood morbidity 84
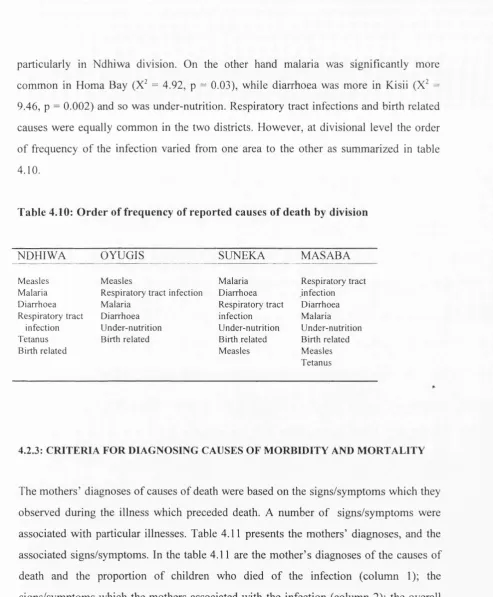
4.2.2 Medical causes o f childhood deaths 87 4.2.3 Criteria for diagnosing causes o f morbidity and mortality 88
4.2.4 Clustering o f medical causes o f death 91
4.2.5 Interactions between infections 95
4.2.6 Duration o f illness 96
4.2.7 Place o f death o f children 97
4.2.8 Summary o f morbidity and mortality patterns 98
4.3 CHILD HEALTH SERVICES 99
4.3.1 Certification o f child births and clinic utilization 99
4.3.2 Child nutrition 100
4.3.3 Immunization 104
4.4 HEALTH SEEKING BEHAVIOUR 108
4.4.1 Choice o f health services 108
4.4.2 Choice o f health institutions 111
4.4.3 Summary o f health seeking behaviour 114
CHAPTER FIVE: MATERNAL HEALTH SERVICES 115
5.1 FAMILY PLANNING 115
5.2 ANTE-NATAL CARE 119
5.3 DELIVERY SERVICES 123
CHAPTER SIX: CHARACTERISTICS OF SAMPLED HOUSEHOLDS 126
6.1 MATERNAL CHARACTERISTICS 126
6.1.1 Marital status 126
6.1.2 Age o f the mothers 127
6.1.3 Education o f mothers 131
6.1.4 Economic status o f the mothers 132
6.1.5 Summary o f maternal characteristics 134
6.2 PATERNAL CHARACTERISTICS 136
6.2.1 Usual residence o f fathers o f index children 136
6.2.2 Age o f fathers 136
6.2.3 Education o f fathers 137
6.2.4 Economic status o f the fathers 138
6.3 HEADS OF HOUSEHOLDS 144 6.3.1 Summary o f the characteristics o f heads o f households 148
6.4 POPULATION OF THE SAMPLED HOUSEHOLDS 149
6.4.1 Household size and composition 149
6.4.2 The study population structure 150
6.4.3 Education 156
6.4.4. Summary o f education status in Homa Bay and Kisii districts 161
6.5 AGRICULTURAL AND ECONOMIC ACTIVITIES OF THE STUDY
HOUSEHOLDS 162
6.6 HOUSING AND SANITATION 164
6.7 HOUSEHOLD PROPERTY OWNERSHIP 166
CHAPTER SEVEN: MATERNAL, PATERNAL AND HOUSEHOLD
RISK FACTORS ASSOCIATED WITH CHILD MORTALITY 169
SECTION THREE: DISCUSSION, CONCLUSIONS AND
RECOMMENDATIONS
175
CHAPTER EIGHT: DISCUSSION, CONCLUSION AND
RECOMMENDATIONS 175
8.1 DISCUSSION 176
8.1.1 Child mortality rates and geographic and climatic differences 176 8.1.2 Causes o f childhood morbidity and mortality 182
8.1.3 Health services 189
8.1.4 Socioeconomic and cultural determinants o f child mortality 192
8.2 CONCLUSIONS AND RECOMMENDATIONS 197
8.2.1 Child mortality rates and differentials 198
8.2.2 Mother and child health services 200
8.2.3 Socioeconomic and cultural determinants o f child mortality 205 8.2.4 Summary o f conclusions and recommendations 208
LIST OF REFERENCES 211
LIST OF TABLES
Table 1.1: Table 1.2: Table 1.3: Table A 1.1 Table A 1.2 Table A1.3
Agro-ecological zones o f Kenya
Distribution o f Kenyan population by provinces
Administrative, political and development structures in Kenya Distribution o f under-five child mortality, 1979 and 1989 Kenyan and Nairobi city population structure by age and sex Homa Bay and Kisii population structure by age and sex
26 28 32 220 221 221 Table 2.1 Table 2.2 Table 2.3 Table 2.4
Main climatic features o f Homa Bay and Kisii Districts 54 M ain geographical and agricultural potential o f the study areas 55 Population distribution by districts of Nyanza and study divisions 57 Summary o f geographical and agro-ecological 63 features o f the study areas
Table 3.1: Key variables which were used in the household survey Table A3.1 : Locations, sub-Locations and study clusters
66
222
Table 4.1 : Distribution o f the study mothers and their live births 78
Table 4.2: M other’s experience with child death 79
Table 4.3 : Distribution o f mothers by number o f live births and
child deaths during five years 79
Table 4.4: Under-five child mortality rates for the study areas 80 Table 4.5: Distribution o f surviving children by age and study area 8 f Table 4.6: Distribution o f children who died during
infancy by age and study area 83
Table 4.7: Proportion o f children with illness four weeks before the interview 85 Table 4.8: Main signs/symptoms o f childhood illnesses
which the mothers recognized 86
Table 4.9: Distribution o f childhood illnesses by mothers’ diagnoses 87 Table 4.10: Order o f frequency o f reported causes o f death by division 88 Table 4.11: Signs/symptoms which the mothers associated with
main medical causes o f death 90
Table 4.12: Signs/symptoms which were significantly associated
with the mother’s diagnosis 91
Table 4.13: Distribution o f children by causes o f death and age 92 Table 4.14: Distribution o f infants who died by cause o f death, age and district 93 Table 4.15: Distribution o f infants who died by cause o f death, age and division 94 Table 4.16: Main signs/symptoms o f causes o f neonatal
deaths (mother’s diagnosis 95
Table 4.17: Distribution o f children by duration o f illness 97 Table 4.18: Distribution o f children by place o f death and study area 98 Table 4.19 Distribution o f children by place o f birth, presence o f birth certificate
and clinic card 100
Table 4.21: Table 4.22 Table 4.23: Table 4.24: Table 4.25: Table 4.26: Table 4.27: Table 4.28: Table 4.29: Table 4.30: Table 4.31: Table A4.1: Table A4.2:
Table 5.1:
Table 5.2: Table 5.3: Table 5.4:
Table 5.5:
Table 5.6: Table 5.7: Table 5.8: Table 5.9: Table 5.10: Table 5.11: Table 6.1: Table 6.2: Table 6.3: Table 6.4: Table 6.5: Table 6.6: Table 6.7 Table 6.8 Table 6.9: Table 6.10: Table 6.11: Table 6.12: Table 6.13: Table 6.14: Table 6.15:
Reasons for partial or non-immimization by district 104 Distribution o f children who were breastfeeding by age and study area 105 Distribution o f children by age at stopping breast feeding 105
Reasons for stopping breast feeding 106
Distribution o f children by age at the time o f weaning 106 Distribution o f children by number o f weighings and study area 107 Distribution o f children by growth curve trend and study area 108 Distr. o f children by type o f service which was used during illness 110 Parental preference o f services for childhood illnesses by type o f illness 110 Distribution o f children by type o f action parents took during illness 112 Action taken for illnesses and services used before the child died 113 Characteristics o f mothers whose children died by no. o f child deaths 223 Distribution o f children by immunization study area and vaccine 225
Distribution o f mothers by knowledge and use o f contraceptive
methods and study areas 115
Types o f contraceptive methods used currently or in the past 116 Distribution o f contraceptive method users by method and division 117 Distribution o f contraceptive users by person
who recommended the method 117
Distribution o f mothers by reason for stopping or non-use
o f contraceptive methods 118
Distr. o f mothers according to desire to use contraceptive methods 119 Health workers and place o f first ante-natal contact with mothers 126 Time o f first ante-natal contact and number o f visits 121 Distribution o f mothers by number o f tetanus toxoid injections given 121 M other’s risk status and its management during last pregnancy 122 Distribution o f mothers by type o f care during delivery o f last child 124
Distribution o f mothers by marital status and study area 126 Distribution o f mothers by current age and study area 127 Distribution o f mothers by age at first delivery and study area 130 Distribution o f mothers by level o f education and study area 131 Distribution o f mothers by main source
and level o f income and study area 133
Table 6.16: Table 6.17: Table 6.18: Table 6.19: Table 6.20: Table 6.21: Table 6.22: Table 6.23: Table 6.24: Table 6.25: Table S6.1: Table S6.2: Table S6.3: Table S6.4: Table S6.5: Table 7.1a: Table 7.1b: Table 7.1c: Table 7.2: Table A7.1: Table A7.2: Table A7.3: Table 8.1: Table 8.2:
Distribution o f population aged over 15 years by
marital status and study area 155
Distribution o f population over 7 years by school attendance and
study area 156
Distribution o f people over 10 years who were at school by age 157 Distribution o f population over 7 years by level o f education and sex 158 Distribution o f residents by literacy status, sex, and study area 160 Distr. o f the population by main economic activity and study area 162 Types o f cash crops grown in Homa Bay and Kisii Districts 163 Distr. o f houses by materials used in construction and study area 164 Distribution o f households by methods o f
waste disposal and water supply 166
Proportion o f households which own the selected property 167
Summary o f maternal characteristics 135
Summary o f fathers’ characteristics 143
Summary o f main characteristics o f heads o f household 149 Proportion o f population aged over 10 years by literacy status 161 Proportion o f population over 7 years with >9 years o f schooling 161
Major differences in maternal, paternal, housing and sanitation factors between Kisii and Homa Bay Districts in Nyanza 170 Major differences in maternal, paternal, housing and sanitation factors between Oyugis and Ndhiwa Divisions in Homa Bay District 171 Major differences in maternal, paternal, housing and sanitation factors ^ between Masaba and Suneka Divisions in Kisii District 172
Risk factors associated with child mortality
in logistic regression model 174
Trend o f choloquine resistance in Kenya 226
Methods for prevention and control o f malaria 227 KRCS PHC/CBHC immimization outreach programme 228
Mortality differentials by age and selected study areas 179 Risk o f dying by number o f children bom in five years
LIST OF FIGURE 10
Figure 1.1: The under-five child mortality rates, differentials and
trends by provinces o f Kenya 22
Figure 1.2: Distribution o f Kenyan population 29
Figure 1.3: Distribution o f Nairobi City population 30 Figure 1.4: Kenyan population over 6 years by level o f education and sex 31
Figure 2.1 : Distribution o f Homa Bay population 57
Figure 2.2: Distribution o f Kisii population 58
Figure 3.1: Framework for the study design 68
Figure 4.1: The under-five child mortality rates by study area 81 Figure 4.2: Proportion o f children by age at the time o f death and district 83 Figure 4.3: Proportion o f children by age at the time o f death and division 84 Figure 4.4: Percent distribution o f children by cause o f death reported by mothers 89 Figure 4.5: Interactions o f infections causing death o f infants 96 Figure 4.6: Immunization coverage for selected vaccines by district 101 Figure 4.7: Immunization coverage for selected vaccines by division 102 Figure 4.8: Status o f immunization coverage appropriate for the child’s age 103 Figure 4.9: First choice o f modem health facility used before the child died 114 Figure 6.1: Distribution o f mothers by age at marriage and district 128 Figure 6.2: Distribution o f mothers by age at marriage and division 129 Figure 6.3 : Distribution o f mothers with secondary education by division 132 Figure 6.4: Distribution o f fathers by average monthly income and district 140 Figure 6.5: Distribution o f fathers by average monthly income and division 141 Figure 6.6: Distribution o f female heads o f households by age and district 146 Figure 6.7: Distribution o f female heads o f households by age and division 147 Figure 6.8: Distribution o f Homa Bay study population 152 Figure 6.9: Distribution o f Kisii study population 153 Figure 6.10: Distribution o f population over 7 years by level o f education 159 Figure 8.1: The relationship between U5CMR and * Altitude 178 Figure 8.2: Conceptual framework for analysis o f determinants o f child mortality 182
LIST OF MAPS 10
Map 1: Kenya: Political and administrative boundaries: Provinces and Districts 16
Map 2: Kenya: Early childhood mortality rates 23
Map 3: Physical and geographical features o f Kenya 25
Map 4: Agro-ecological zones o f Kenya 27
Map 5: Districts o f Nyanza Province 36
LIST OF ABBREVIATIONS
ARI - Acute respiratory tract infections BCG - Bacillus Calmette Guerin
CBHC - Community Based Health Care CBS - Central Bureau o f Statistics DC - District Commissioner
DHS - Demographic and Health Surveys DPT - Deptheria, Pertusis and Tetanus D O. - District Officer
KEPI - Kenya Expanded Programme on Immunization KRCS - Kenya Red Cross Society
MAP - Medical Assistance Programme
MEPND - Ministry o f Economic Planning and National Development M.P. - Member o f Parliament
NCPD - National Council for Population and Development PHC - Primary Health Care
r/EO - Rainfall / Evapo-transpiration ratio U5CMR - Under-five child mortality rate
UNESCO - United Nations Education, Scientific and Cultural Organization UNICEF - United Nations Children Fund
WHO - World Health Organization
DEDICATION
This work is dedicated to my daughter Silpa, my mum Mama Beldina, and my dad, Moselal Jaduong’ Ibrahim Ondolo to whose health and lives my academic endeavours have special endearment;
and
A C K N O W L E D G M E N T
My first and forem ost thanks go to Professor G. J. Ebrahim for his tireless efforts, personal com m itm ent
and technical input and guidance into this work from the tim e o f its initiation to its su ccessfu l com pletion.
S econdly, 1 w ould like to thank Professor S. N . Kinoti fornier Director at M edical Research Centre o f
Kenya M edical Research Institute (K EM R I) for w orking join tly with Professor Ebrahim during the
form ative stages o f this w ork and continued technical and financial support for the period o f this work.
To the m others in Hom a Bay and K isii Districts o f N yanza Province, Kenya, I sin cerely appreciate their
w illin gn ess and com m itm ent to volunteering such useful and personal infonnation for the purpose o f this
study. The com m unity health workers w ho w orked studiously on this project, w alking up and dow n with
forms, are m ost appreciated for the consistency in the data w hich they collected. The support given to this
work by the targeted hou seh old s, com m unities, local provincial administration, particularly the D istrict
O fficers, C h iefs and their A ssistants, the M inistry o f Health personnel particular. Dr. Sam w el O chola,
M edical O fficer o f Health in Hom a Bay and Mr. Maranga, Public Health N urse, K isii, District Registrars o f
Births and D eaths and Population O fficer, w as o f uttermost importance in executing field w ork.
1 am very grateful for the institutional support I received from K enya M edical Research Institute and the
Institute o f Child Health. To the Kenya M edical Research Institute, I am grateful to Dr. D avy Koech for his
support, assistance and granting study leave for the entire period o f this w ork. For coordination,
preparation and supervision o f data collection and m anagem ent, I am very grateful to Mr. Justus O m ondi
O ulo and the sta ff at the Com puter unit o f M edical Research Centre. At the Institute o f Child Health, I
extend m y sincere thanks to Professor A ndrew Tom kins for his technical advise during his visits to K enya,
and at Centre for the International Child Health, Institute o f Child Health. Dr. Sullivan Keith, m y
supervisor, for his guidance and technical assistance during the stages o f data m anagem ent and analysis
and Elizabeth Paul for her assistance with data analysis. M adeiline Green for her on-tim e support in the
department and correspondence w hile in K enya, is appreciated, join tly with the sta ff at Centre for
International C hild Health.
For the financial support, I w ish to sincerely thank C om m onw ealth R egional Health C om m unity
Secretariat (C R H C S), A rusha Tanzania for financing the field activities o f this project, and W ellcom e
Trust, London for financing m y project work in London.
Finally, and m ost im portantly, I am indebted to m y fam ily, m y w ife Grace A kinyi and children, Jackline
A m ondi, C lem ent Seje, Silpa A dhiam bo, Ja d u o n g Ibrahim O ndolo, O livia A tieno and C hristine A ch ien g, my mother M am a B eldina and m y father, M o sela l J a d u o n g Ibrahim O ndolo. M y dear Brother- and Sister-in-law Stephen and S ylvia Scott o f W aterloo, Canada are com m ended for the personal responsibility they
took to care for m e and m y fam ily.
THE OUTLINE OF THE THESIS
The thesis is presented in four sections and eight chapters. Section One - Background o f the Study has three chapters. Chapter One: Background to the Study which includes introduction, definition o f terminology, the state o f the Kenyan children, demographic, physical and environmental features of Kenya, objectives o f the study and literature review. Chapter Two: The Study Communities describes the demographic, physical and agro-ecological features o f Nyanza Province, the site for the study. Chapter Three: Research Design describes the methods used in the study from the time o f preparation to data collection, analysis and writing o f this thesis.
Section Two: Description o f Research Findings has four chapters. Chapter Four: Child Health and Survivourship presents the results on child mortality rates, morbidity and mortality patterns, preventive and promotive child health services, their uptake and health seeking behaviour during illness o f a child. Chapter Five: Maternal Health Services describes the pattern o f uptake o f family planning, ante-natal and delivery services. Chapter Six: Characteristics o f the Sampled Households presents findings on characteristics o f the mothers and fathers of the index children, the heads and residents in the sampled households, agricultural and economic activities, housing, sanitation and household property ownership. Chapter Seven: Maternal, paternal and Household Risk Factors Associated with Child Mortality summarizes the similarities and differences between and within the study districts and the risk factors which are associated with child mortality for all and individual study communities.
Section Three: Chapter Eight: Discussion, Conclusions and Recommendations presents the major findings o f the study and proposes further action as recommendations.
SECTION ONE
BACKGROUND TO THE STUDY
0
---CHAPTER ONE: BACKGROUND TO THE STUDY
CHAPTER TWO: THE STUDY COMMUNITIES
CHAPTER THREE: RESEARCH DESIGN
MAP 1:
KENYA
Political and Administrative Boundaries
Provinces and Districts
M andera
Turkana
Marsabit
W est Pokot
Samburu
Trans \ Elgeyo
Nzoia 'iM arakwel Isiolo
B u n g o c n a
\B a r tn g o
V
Western
B u s< a'
K a k a m a g a L a lk ip la Nandi
K i s u m u ,
CNakuruQ
K ericho Nyen
^ M u ra n g a \ \ E m b u
Central
V ic to ria
xH om a^ Kisu
\
Narok
Garlssa Tana
River
Nairobi
Machakos
Kiiiado Lamu
Study Area
M om basa Kwa e
0
CHAPTER ONE
BACKGROUND TO THE STUDY
1.1 INTRODUCTION
Child death is very painful to the mother who after nine months o f expectation and
carrying the burden o f pregnancy and o f labour pains, loses, through death, the newborn,
the infant or older child.
“A voice is heard in Ramah, weeping and great mourning, Rachel weeping fo r her children and refusing to be comforted, because they are no more. ” (Matthew 2 : 18.)
The neonatal period is a stage o f transition from intrauterine life to an independent
existence. It is a stage too, when most children die. The causes o f these deaths are known
to be biological in nature and influenced by health services, but they are also culturally
determined. On the other hand, post-neonatal and child deaths are more associated with
economic and environmental factors, in addition to the socio-cultural factors and quality
o f health care.
Internationally, between regions and between countries within regions, there are marked
differentials in child mortality levels. In developing countries, the majority o f deaths in
children are preventable, and great strides have been made in preventing child mortality.
Yet, differentials in mortality persist and sometimes they occur intriguingly between
neighbouring communities. The available knowledge, technology and resources are
capable o f enabling mothers and health care providers to recognize and manage serious
illness and utilize existing services.
The trend o f child mortality rate in some developing countries, including Kenya, is on the
decline, but not at a pace proportionate to the level o f knowledge, technology and
resources at our disposal for managing the major killers o f children. However, political
and professional will, in addition to infrastructural and operational interventions are
required in order to accelerate the rate o f decline in child mortality.
Amidst the rapidly growing western model o f health care, there is urgent need to
understand the underlying web o f causation o f child deaths in developing countries. For
this, a deeper understanding o f the complexity o f traditional practices, social structures
and cultural values within individual societies is also necessary.
This study attempted to establish the patterns o f child deaths and to investigate the
regional determinants o f mortality differentials at household, community and district
levels, in two neighbouring districts, Homa Bay (a high mortality district - 216 deaths per
1000 live births) and Kisii (a low mortality district - 101 deaths per 1000 live births) in
the Nyanza Province o f Kenya (Republic o f Kenya/CBS/UNICEF, 1984).
1.2 DEFINITION OF TERMINOLOGY
Kenya and its political and administrative units, provinces, districts, divisions, locations
and sub-locations, as used in this thesis refer to the state o f administrative boundaries o f
the country as they were in 1989 and does not include or use the names o f any sub
divisions which have been created thereafter. Kenya is divided into eight administrative
units called Provinces, among the eight provinces is Nyanza, the setting o f this study.
Districts are administrative units o f a province.
Community: Shaffer, et al. (1987) working in Kenya, defined community as “a group o f
people living within a defined geographical and administrative area where every family
responsibilities with each other” (Shaffer, 1987). In this study, the term ‘community’
refers to division, and location within a division according to the Kenyan Government
administrative and political definition which also coincides with clan boundaries. A
division is an administrative unit o f a district represented politically by the peoples’
elected Member o f Parliament (M.P.) and headed administratively by a District Officer
(D.O.); a location is a unit o f a division and is represented politically by an elected
Councilor and headed administratively by a Chief.
Homestead is a family unit living in one compound (home) and composed o f the head o f
the homestead (usually a man) his wife or wives (if in polygamous marriage), and his/her
sons and their wives (if they are married). Each wife o f the head o f the homestead and the
individual sons and their wives who are directly responsible for economic support and
subsistence o f their dependants, constitute separate households within a homestead.
Household is a social and economic family unit mutually sharing resources like meals,
residential house and psychological support for each other. Residents o f a household are
those who regularly accrue their daily subsistence from the household continuously for
three consecutive months prior to the time o f the study, including those who were in
boarding schools. Labour out-migrant is a member o f the household, supporter or
dependant o f the head o f household, who was staying away for at least the three months
prior to the study for the purpose o f employment. Father is the father o f the index child in
the study. Mother is a woman o f reproductive age, who experienced at least one live birth
between January 1989 and the time o f the study (May-October 1994). An index child is a
live birth to the mother during the study period. A surviving child is an index child who
was alive at the time o f the study. A child death is death o f an index child before the time
o f the study.
Ecology is the state o f interrelationship between the environmental, biological,
demographic and technical conditions o f life o f any people, including a series o f
determinants o f form and functions in human culture and social systems and associated
skills and resources upon which are depended human behaviour and a body o f
emotionally charged beliefs. Culture is the totality o f the inherited ideas, beliefs, values
and knowledge which constitute the shared basis for social action. Lifestyle is a set o f
attitudes, habits or possessions associated with a particular person or group. Health
institution is any type o f health care establishment used for preventive and/or curative
services for mothers and children, and includes dispensary, health centre, nursing home
and hospital, traditional healer and community health worker. Self-medication was also
considered as an alternative form o f health care.
1.3 KENYA
1.3.1 STATE OF THE KENYAN CHILDREN
The national population censuses in Kenya conducted in 1948, 1962, 1969, 1979 and
1989 have formed the main sources o f data for the national, provincial and district level
estimates o f child mortality rates and trends in Kenya. In addition, multinational surveys
like the more recent Demographic Health Surveys (Republic o f Kenya/NCPD/CBS/DHS,
1989 and 1993) have also given child mortality estimates, but only at national and
provincial levels. Based on these sources, child mortality trends in Kenya have shown
steady decline from about 250 in the 1950s to about 110 deaths per 1000 live births in
1989 (Republic o f Kenya/CBS/UNICEF, 1989; CBS, 1996). While these declines in child
mortality continue into the 1990s, within Kenya large differences in child mortality rates
exist between provinces, ranging from 50 in Central Province to 179 deaths per 1000 live
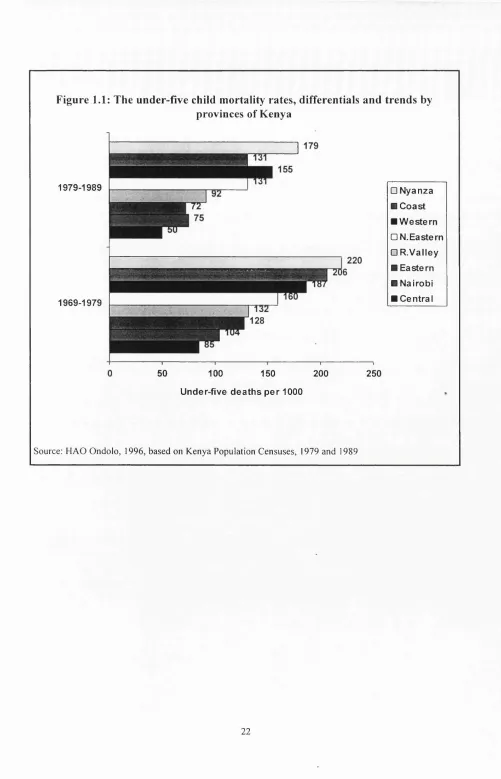
births in Nyanza Province, a difference o f about 3.6 fold (figure 1.1, table A 1.1, Republic
o f Kenya/CBS, 1996). Over the years child mortality differentials have remained, but
with narrowing o f differences between provinces. For example, for the period 1969-1979
the differentials in child mortality between the provinces were more marked and spread
out but for the period 1979-1989 there was evidence o f the differences narrowing down
and clustering, as was the case o f Nairobi and Eastern Provinces and Coast and North
‘high mortality’ while Central, Nairobi, Eastern and Rift Valley Provinces continued to
be ‘low mortality’ (figure 1.1). The mortality levels in the districts also correspond with
those of the provinces. In the ‘high mortality’ provinces, the districts too had above
average mortality rates, for example, for the early childhood deaths (0-2 years), 7 out of
10 highest mortality districts were from Nyanza and Coast Provinces, the remaining 3
were from Rift Valley and Western Provinces. Within Coast Province, 4 out o f 6 districts
had over 160 child deaths per 1000 live births and the remaining 2 with over 195 child
deaths per 1000 live births. In Nyanza Province, 3 out o f 4 districts experienced high
child mortality levels o f over 195 deaths per 1000 live births and the remaining one had a
rate o f about 100 deaths per 1000 live births. In Western Province only 1 out o f 3 districts
had over 195 deaths per 1000 live births. Rift Valley on the other hand was
heterogeneous with 2 out o f 13 districts exhibiting over 170 deaths per 1000 live births.
At national level, there was a difference o f 4.4 fold between Homa Bay in Nyanza
Province (highest mortality) and Nyeri in Central Province (lowest mortality) with 216
and 49 deaths per 1000 live births, respectively, table A 1.1, maps 1 and 2 (Republic o f
Kenya/CBS/UNICEF, 1984, Republic o f Kenya/CBS, 1996). As shown on map 2, nine o f
the ten leading districts with high child mortality rates in Kenya are in contact with large
surface water masses. For example, Homa Bay, Siaya, Kisumu and Busia Districts (Lake
Victoria); Kilifi, Lamu, Kwale, Tana River (Indian Ocean) and Baringo District (Lake
Baringo) (maps 1 and 2).
Figure 1.1: The under-five child mortality rates, differentials and trends by provinces of Kenya
1979-1989
1969-1979
□ Nyanza ■ Coast ■ W estern □ N. Eastern □ R .V alley ■ Eastern ■ Nairobi ■ Central
50 100 150 200
Under-five deaths per 1000
Source: H A O O ndolo, 1996, based on K enya Population C ensuses, 1979 and 1989
MAP 2
KENYA
Early Childhood Mortality Rates
E thiopia
m m
Number O f children dying in the first two years of life per 1000 live births
5 5 - 8 9
SO - 1 2 4
1 2 5 - 1 5 9
1 6 0 - 1 9 4 0
Scale I 1250 kms
S c u r w : 8 A S Ê 0 O N 1 9 7 8 C E N S U S E S T I M A T E S BY M. K I 8 E T : P O P U L A T I O N S T U D I E S R E S E A R C H
1.3.2 ENVIRONMENT, PHYSICAL AND GEOGRAPHICAL FEATURES
Kenya is situated on the eastern coast o f Africa. It is bordered by the Indian Ocean and
Somalia on the east; Tanzania to the south; Lake Victoria and Uganda to the west and
Sudan and Ethiopia on the north. Kenya is divided into about two equal halves by the
Equator. It lies between latitudes 4° North and 4° South and longitudes 34° East on the
west and 44° East on the east (map 3). Despite sitting astride the Equator, Kenya exhibits
very diverse physical and geographical features, namely:
• Between large water masses, the Indian Ocean on the eastern coast and Lake Victoria
on the west;
• From sea level at the coast to about 5200 metres above sea level at the snow tipped
Mount Kenya and at its border with Tanzania, Mount Kilimanjaro at about 5895
metres above sea level.
• From the dry , hot and unproductive arid areas in north eastern Kenya to the cool
fertile and productive ‘granary’ o f Kenya in central and western Kenya;
• The gentle S-shaped 36-56 kilometres wide and 5600 kilometres long Great
Rift Valley which divides Kenya into eastern and western highlands (map 3).
These diverse physical and geographical features o f Kenya fall into seven distinct agro-
ecological zones which also correspond to the political and administrative demarcations
and the regional distribution o f the various ethnic groups o f Kenya. The main agro-
MAP 3: PHYSICAL AND GEOGRAPHICAL FEATURES OF KENYA
4 0'
E t h i o p i
IMni
L o w
M l
T a n z a n i a
I N D IA N O C E A N
100
1 5 0 2 0 0 K i l o m e l t e t
100
Table 1.1: Agro-ecological zones of Kenya
ZONE FEA TU R ES
Zone 1
(Includes Eastern and Western highlands)
- 3% o f K enya’s land mass - supports humid forested area
- annual average rainfall - 1100 - 2 7 0 0 m illim etres - evaporation - low
- rainfall/evapo-transpiration (r/EO ) - over 80%
- potential o f plant growth is very high and risk o f failure low
Z one 11
(U plands plateau)
- 4% o f K en ya’s land mass
- supports sub-hum id, m oist and dry forest - annual average rainfall - 1000 - 1600 m illim etres - evaporation - 1300 - 21 0 0
- r/EO - 60 -80%
- risk o f crop failure is low (1-5% )
Zone 111 (L ow lands plateau)
- 5% o f K en ya’s land mass - supports dry and m oist w oodland
- average annual rainfall - 800 - 1400 m illim etres ' - evaporation - 1450 - 2000
- r/EO - 50 -65%
- potential for plant growth is high to m edium , risk o f crop failure is low (5-10% )
Zone IV - 5% o f K enya’s land mass - m edium to sem i-arid
- supports dry w oodland, medium potential for vegetation growth - average annual rainfall - 600 - 1100 m illim etres
- evaporation - 1550 - 220 0 m illim etres - r/EO - 40 -50%
- lik elih ood o f crop failure is high (10 - 25% )
Zone V - 15% o f K enya’s land mass - sem i-arid
- support dry bush vegetation - average annual rainfall - 4 50 - 900 - evaporation - 1650 - 23 0 0 m illim etres - r/EO - 25 - 40%
- potential for plant growth is m edium to low , risk o f crop failure is high (25 -75% )
Zone VI - 22 % o f K enya’s land mass - arid
- potential for plant growth is n egligib le - average annual rainfall - 300 - 550 m illim etres - evaporation 1900 - 240 0 m illim etres
Z one VII - 46% o f K en ya’s land mass - very arid
- average annual rainfall - 150 - 350 m illim etres - evaporation - 2 1 0 0 - 2 5 0 0 m illim etres
MAP 4: AGRO-ECOLOGICAL ZONES OF KENYA
L a k e V i c t o r i i
ZONE ZONES ZONES IV-V
O C E A N
I
I
ZONES Vl-Vll0 75 150 225Km
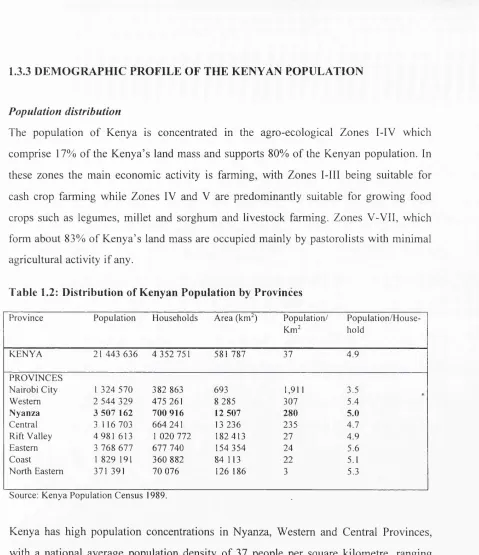
1.3.3 DEMOGRAPHIC PROFILE OF THE KENYAN POPULATION
Population distribution
The population of Kenya is concentrated in the agro-ecological Zones I-IV which
comprise 17% of the Kenya’s land mass and supports 80% of the Kenyan population. In
these zones the main economic activity is farming, with Zones 1-111 being suitable for
cash crop farming while Zones IV and V are predominantly suitable for growing food
crops such as legumes, millet and sorghum and livestock farming. Zones V-Vll, which
form about 83% of Kenya’s land mass are occupied mainly by pastorolists with minimal
agricultural activity if any.
Table 1.2: Distribution of Kenyan Population by Provinces
Province Population H ouseholds Area (km^) Population/ Km^
P opulation/H ouse hold
K EN Y A 21 4 43 6 36 4 352 751 581 787 37 4.9
PRO VINC ES
N airobi City 1 3 24 570 3 82 863 693 1,911 3.5
Western 2 544 329 475 261 8 285 307 5.4
N yan za 3 5 07 162 700 916 12 507 280 5.0
Central 3 116 703 664 241 13 236 235 4.7
Rift V alley 4 981 613 1 0 20 772 182 413 27 4.9
Eastern 3 768 677 6 77 740 154 354 24 5.6
Coast 1 829 191 360 882 84 113 22 5.1
North Eastern 371 391 70 076 126 186 3 5.3
Source: K enya Population C ensus 1989.
Kenya has high population concentrations in Nyanza, Western and Central Provinces,
with a national average population density of 37 people per square kilometre, ranging
from 2 persons per square kilometre in Marsabit and Wajir Districts in the North Eastern
Province to 517 persons per square kilometre in Kisii (in Nyanza Province) the most
densely populated district in Kenya. Nyanza Province, the target for this study has the
second largest population and is also the second most densely populated. Its population
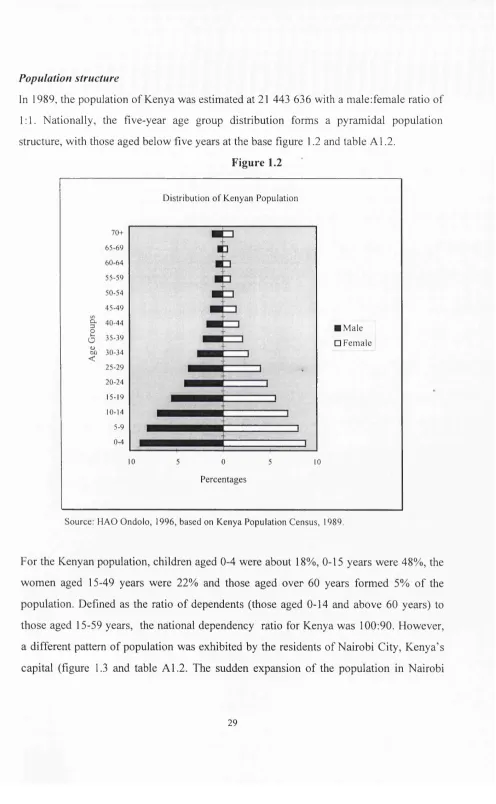
Population structure
In 1989, the population of Kenya was estimated at 21 443 636 with a male:female ratio of
1:1. Nationally, the five-year age group distribution forms a pyramidal population
structure, with those aged below five years at the base figure 1.2 and table A1.2.
Figure 1.2
Distribution o f Kenyan Population
CL
3
2
o <u
CJ)
<
70+
65-6 9 60-6 4 55 -5 9 50-54 4 5 -4 9 40 -4 4 3 5 -3 9 30-34 25-2 9 20-24 15-19 10-14 5-9 0-4
10 5 0 5 10
■ M ale
□ Fem ale
Percentages
Source: HAO O ndolo, 1996, based on K enya Population C ensus, 1989.
For the Kenyan population, children aged 0-4 were about 18%, 0-15 years were 48%, the
women aged 15-49 years were 22% and those aged over 60 years formed 5% of the
population. Defined as the ratio of dependents (those aged 0-14 and above 60 years) to
those aged 15-59 years, the national dependency ratio for Kenya was 100:90. However,
a different pattern o f population was exhibited by the residents of Nairobi City, Kenya’s
capital (figure 1.3 and table A1.2. The sudden expansion o f the population in Nairobi
from age 20 years is explained by the influx into the City by young adults in the same age
group from rural districts, as shown in the population structures for the study populations
(figures 6.8 and 6.9). Nairobi has a male:female ratio of 100:80 and dependency ratio of
100:203.
Figure 1.3
D istribution of Nairobi City Population
70+
6 0 -6 4
50 -5 4
(A a 3 4 0 -4 4
2 0
D) 3 0 -3 4 <
2 0 -2 4
10-14
0-4
■ M ale
□ Fem ale
10 10
P e rcen tag es
Source: H A O O ndolo, 1996, based on K enya Population C ensus, 1989.
Education
According to the 1989 Population Census, Kenya had an overall literacy rate of 71%
(78% for males and 66% for females) for those aged over 6 years. For the women aged
over 25 years of age only 46% o f them could read and write. Although 71% of Kenyans
indicated that they could read and write, only 14% had attained secondary and above
level of education, 56% had obtained only primary education, and 30% had never been to
school. The differences in level of education between the Kenyan males and females is
Figure 1.4: Kenyan population over 6 years by level of education and sex
35 .
30
25
-34
None
36
18
12
1
one-four five-eight nine-tw elve thirteen +
Level of education (Years of schooling)
I M ale o F e m a le
Source: HAO O ndolo, 1996, based on Kenyan Population C ensus, 1989
1.3.4 POLITICAL AND ADMINISTRATIVE INFRASTRUCTURES
Kenya has an area o f about 581,787 square kilometres. It is divided into eight
administrative units called Provinces and these are then divided into districts, (map 1).
Politically, the Head of State and the Government is the President. Members of
Parliament who are elected by the people represent the divisions in the central
government and Councilors represent the people at the location level, in the local
governing authority.
District fo c u s fo r rural development
Following the Alma A ta declaration in 1978 and official launching of Primary Health
Care and its eight elements, as a strategy for attaining Health For All by the year 2000,
the Kenyan Government adopted the resolutions o f the declaration and set up inter
sectoral and multidisciplinary mechanisms for implementation of primary health care
strategies. The main thrust for Kenya was the introduction of a strategy called, “District
Focus for Rural Development” whose principle was described as:
“The responsibility f o r p la n n in g a n d im plem enting rural developm ent is being sh ifted fr o m the headquarters o f m inistries to the districts. This strategy, know n as the “D istrict F ocus f o r R ural Developm ent, ” is b ased on the p rin c ip le o f a com plem entary relationship betw een the m inistries with their sectoral approach to developm ent, a n d the districts with their integrated approach to add ressin g local needs. The responsibility f o r the operational aspects o f d istrict-specific rural developm ent p ro jects has been delegated to the districts. R esponsibility f o r general policy, a n d the p la n n in g o f m ulti-district a n d national p rogram m es rem ains with the m inistries. The objective is to broaden the base o f rural developm ent a n d encourage local initiative in order to im prove p roblem identification, resource m obilization, and p ro je ct im plem entation. ” (Republic o f Kenya, O ffice o f the '
P resident: D istrict F ocus f o r R ural D evelopm ent R evised June 1984).
In order to implement the strategy, administrative and political structures in the form of
development committees were created at district, division and location levels as vehicles
for delivery o f social services to the people down to the household level (table 1.3).
Table 1.3: Administrative, political and development structures in Kenya.
A D M IN IST R A T IV E A D M IN IST R A T IV E POLITICAL D E V E L O PM E N T
LEVEL H EA D R EPR ESEN TA TIV E C O M M ITT EE
N ational President President C abinet
Provincial Provincial - Provincial M onitoring and
C om m issioner Evaluation
District D istrict C om m issioner - District D evelop m en t
D ivision al D istrict O fficer M em ber o f Parliament D iv isio n D evelop m en t
The strengths in the strategy were creation o f the infrastructure to “encourage local
initiative in order to improve problem identification, resource mobilization and project
implementation”, emphasis at the location, division and district levels and creation o f
development committees at these levels, table 1.3. This strategy had two main
advantages, namely, providing opportunity for local development initiatives through
self-help groups, and encouraging participation o f the people in collaboration with their
elected political representatives (Councilor at the location, and Member o f Parliament at
the division level). However, over the years, the emphasis on the strategy has been
pursed less vigorously, but the infrastructure remains in place still offering opportunities
for reactivation.
1.4 JUSTIFICATION FOR THE STUDY
Based on the review o f the state o f the Kenyan children, with regard to mortality rates
and distribution; the geographical, agro-ecological and demographic features o f the
country and the political and administrative infrastructures, the study developed a
research question, stated the rationale for selecting the study communities and set the
study objectives as stated below. Literature which was reviewed is further discussed after
the objectives.
1.4.1 RESEARCH QUESTION
The main research question for the study was to investigate why in Kenya with identical
infrastructure for administration and delivery o f social services at district level, there exist
infant and child mortality differentials o f approximately 4.7 levels o f magnitude between
districts with the highest and lowest child mortality.
1.4.2 RATIONALE FOR SELECTING THE STUDY AREA
Nyanza Province was chosen for this study because it was the only province in Kenya
with the widest range and clustering o f child mortality with a difference o f about 2 fold
between one district viz. Kisii District (low mortality - 100 deaths/1000 live births) and
the remaining three, Homa Bay, Siaya and Kisumu Districts (high mortality - 200
deaths/1000 live births). Kisii and Homa Bay districts were subsequently selected for the
study because o f their close physical proximity for the purposes o f easy administration of
the project (map 5). In each o f the two districts, two divisions were randomly selected for
data collection based on the pre-set criteria (section 3.3.1), viz. Ndhiwa and Oyugis in
Homa Bay and Suneka and Masaba in Kisii (map 6).
1.4.3 OBJECTIVES OF THE STUDY
The objectives o f the study were:
• To describe the pattern o f under five child mortality for one high and one low
mortality communities (divisions) in each o f the two selected districts.
• To determine the age specific distribution o f the prevalence and outcome o f the
common causes o f morbidity such as malaria, measles, diarrhoea, respiratory
diseases, tetanus, anaemia, prematurity and under-nutrition among infants and
children in Homa Bay and Kisii Districts; and to investigate whether the differentials
are uniformly spread over the first five years o f life or have a tendency to cluster in a
particular age group, for example, the first week o f life, first month, post-neonatal,
first year or the ‘toddler age’.
• To describe the association between the distribution o f infant and child mortality and
maternal, paternal, demographic, socio-anthropological, -economic, environmental and
To assess the alternative sources o f health care and the pattern o f their uptake by
women during pregnancy and child birth and for children during infancy and early
childhood.
To describe the infrastructure for delivery o f health services and the pattern o f their
use in management o f common childhood diseases.
MAP ê
Districts of
Nyanza Province
Busia
Kakamega
Nandi
Kisumu
V ictoria
Homa
5
T
Narok
Kericho
MAP 6:
Homa Bay and Kisii Districts Administrative Units
Homa Bay
Lak*
Vicuxia
C«nlr«l
K a n n lu o
Katipui \
Kaowv
i un»i \ Kamagambo
Caw ai
Kama*aimbo__y
taulb
Kafungu
VICTORIA
Keny#mk#$c
South
Suna Wm i
^ ^
s r - “
L o c a tio n s
U rban C ontras
A R u ra l C a n » # :
— — District B oundurias — ■ ---Division B oundary
■ --- Location B oundary
Souroa : South Nyanza and Kisii District Davalopmant Plans (1968 _ 19*3)
1.5 LITERATURE REVIEW
In order to have more in-depth understanding o f the research question and also to
adequately address the study objectives further literature was reviewed covering various
topics which are related to child mortality, namely, childhood infections, health services,
education, economic status and the environment as presented below.
1.5.1 COMMON CHILDHOOD INFECTIONS
The leading causes o f childhood deaths in developing countries are malaria, measles,
diarrhoea, respiratory tract infections, tetanus, under-nutrition and prematurity. However,
the importance o f each disease varies according to region and the age o f the child.
Similarly, the outcome o f these infections is commonly influenced by the m other’s ability
to recognize early enough the signs and symptoms o f the disease and her access to
resources for appropriate medical care.
The disease-specific epidemiological studies have often found that the disease under
investigation is often not the leading or even a major cause o f death in the selected
community. Instead, others or even a combination o f infections might be more important.
For example, in the Joint Project Machakos, Kenya measles and diarrhoea which were the
leading causes o f infant and child deaths were responsible for only 20% o f the deaths
(Leeuwenburg, 1984a), in Saradidi, a malaria holoendemic area, malaria accounted for
only 7.4% o f the infant deaths (Spencer, 1987a) and in a diarrhoeal diseases control
project in Kiambu District o f Kenya, pneumonia was found to be the leading cause o f
infant and child deaths (Kinoti, 1989). Likewise, in the Gambia, a study on malaria and
childhood mortality, prematurity was identified as the leading underlying cause o f death
(Greenwood, 1987a). It is evident therefore that there are combinations o f fatal infections
which are responsible for the observed pattern o f mortality in any given community
Malaria is an infective condition caused by species o f the genus called Plasmodium. Four
types which infect human are P. falciparum, P. vivax, P. ovale and P. malariae. The
distribution o f these species worldwide is as follows: P. falciparum - Africa, New
Guinea, and Haiti; P vivax - Central and South America, North Africa, Middle East, India
and rarely in sub-Saharan Africa; P. Ovale - West Africa; and P. malaria relatively
uncommon outside Africa. The vector for transmission o f malaria is female Anopheles
mosquito.
Until the 19th century, malaria was found in Northern Europe, North America and Russia
and transmission in Southern Europe was intense. But since then, it has been eradicated
from these areas, and the number of cases in the Middle East, China and India has fallen.
Elsewhere in the tropics there has been resurgence o f the disease. Transmission o f
malaria is favoured by high humidity, temperatures between 20 and 30° C and breeding
sites for mosquitoes. It is often seasonal, coinciding with the rainy season which provides
water for mosquito breading sites, increases humidity which favours survival and
therefore boosts the population o f mosquitoes, hence fluctuations in prevalence o f the
disease. However, in some areas, the number o f people with malaria parasites in their
blood (parasitaemia rate) are relatively constant throughout the year with the majority o f
cases occurring during the wet seasons. Transmission o f malaria is therefore proportional
to the density o f the mosquito, the number o f mosquito bites per day and the survival
time o f the mosquito. Malaria does not normally occur at altitudes above 2000 metres
above sea level and temperatures below 16° C or above 33° C.
P. falciparum is responsible for the severe form o f malaria in children. Despite
acquisition o f maternal antibodies, in malaria holoendemic areas, life-threatening malaria
occurs early in infancy and may be as early as 6 weeks o f life, and increasing gradually to
reach its peak after 6 months, with parasitaemia rate o f up to 100% by the age 12 months
(Hindrickse, 1996). In the tropics, malaria is a household name for most childhood
illnesses and is believed to be the leading cause o f childhood deaths. Records from health
institutions also report malaria as the leading cause o f morbidity. In Kenya, for example.
Nyanza Province reported the highest number o f malaria cases, followed by Western,
Eastern and Coast (Republic o f Kenya/CBS, 1988a). The number o f malaria cases
reported by health institutions by Province did not correspond however with the level of
mortality in each province, indicating that malaria may not necessarily be the illness
responsible for most o f these child deaths. However, analysis o f available information
showed that the three districts, Homa Bay, Siaya and Kisumu in Nyanza and Busia in
Western Province which reported high child mortality rate (maps 1 and 2) also recorded
high number o f malaria cases; and the Central Province districts which experienced low
child mortality also reported few cases o f malaria. But other districts like Kisii in Nyanza,
Bungoma and Kakamega in Western and Taita-Taveta in Coast Province reported
mortality levels which did not correspond with the reported high prevalence o f malaria.
Baringo District in Rift Valley Province in contrast, had notably high child mortality
despite low malaria prevalence (Blacker, 1987a).
Malaria is holoendemic in most o f Nyanza Province, and transmission occurs throughout
most o f the year, but the high prevalence could also be due to over diagnosis hence, it did
not feature as the highest contributor to child mortality (Williams, 1987a). It is possible
that deaths due to malaria may be attributed to resistance to anti-malarial drugs (Grounds,
1984; Spencer, 1987a), and this may explain why wide distribution o f chloroquine
phosphate for chemoprophylaxis against and treatment o f malaria did not have an impact
on infant mortality (Spencer, 1987b).
In malaria holoendemic areas, parasitaemia is reported early in infancy, for example
Spencer et al. (1987) reported malaria parasitaemia rate o f 49.6% by the age o f 4 months
(Spencer, 1987b) and elsewhere in East Africa a rate o f 90% by the age o f 12 months
(Bradley, 1984). In the holoendemic areas, this early infection with malaria parasites
enable the infants to acquire immunity against malaria early in life. But, in malaria
endemic areas, fewer infants are immune and therefore succumb during epidemics
(Gamham, 1949). But even in malaria holoendemic areas, malaria specific deaths are
12.2% o f child deaths were due to malaria (Spencer, 1987a). In the Gambia, 4% o f infant
and 25% o f child deaths were attributed to malaria (Greenwood, 1987a), and in a low
malaria endemic area o f Machakos, malaria accounted for 3% o f infant and 10% o f child
deaths (Omondi-Odhiambo, 1984).
Acting through mediators like low birth weight, anaemia and suppression o f immunity
against other diseases, malaria may therefore be a contributory factor to, rather than a
direct cause o f infant and child deaths (Bradley, 1984, Spencer, 1987a). Furthermore, the
low proportion o f deaths which are attributed to malaria may in fact give a false picture o f
the disease’s relevance to child health and survival (Williams, 1987).
Measles is a medical condition caused by a virus. It is easily recognized and accurately
diagnosed by mothers. Epidemiological evidence shows that measles is not over
diagnosed by lay people (Aaby 1984). In Machakos, Kenya, mother’s diagnosis o f
measles was confirmed by clinicians in 90% o f cases (Leeuwenburg, 1984b) and in the
Gambia in 76% o f cases (Alonso, 1987).
Among the Akamba people, o f Eastern Kenya, measles is common and perceived to be
G o d ’s disease whose origin is unknown, is associated with normal development o f a
healthy child and that all children should be affected by measles at one time or the other
(van Luijk, 1984). In western Kenya, among some Luhya communities healthy children
are even taken close to the infected children so that they can contract measles and if they
get only mild attack (for example, those who have been immunized against measles or
younger infants) children are powdered with fermented flour o f fmger-millet in the belief
that the child will get full blovm attack o f measles once and for all (Luoba, 1996). Among
the Luo community in Western Kenya, measles is known to be very infectious and spread
by wind and therefore a child with measles must not ‘cross the road’ in order to reduce
transmission. Home management o f children with measles is not uncommon in many
traditional societies. Working in Machakos District, Kenya, Leeuwenburg, et al. (1984),
observed that children with measles and managed at home had low mortality compared to