© 2018 IJSRST | Volume 4 | Issue 2 | Print ISSN: 2395-6011 | Online ISSN: 2395-602X Themed Section: Scienceand Technology
Correlation of Different Soil Parameters and Evaluation of Its Effect In A
Ramsar Site East Kolkata Wetland
KhaledaFirdous
*1, Swati Chakraborty
2*
1Research scholar, Department of Biotechnology, Gurunanak Institute of Pharmaceutical Science and
Technology. 157/ F, Nilgunj Road, Panihati, Kolkata,West Bengal, India
2
Corresponding Author, Assistant Professor, Gurunanak Institute of Pharmaceutical Science and
Technology. 157/ F, Nilgunj Road, Panihati, Kolkata,West Bengal, India
ABSTRACT
The East Kolkata Wetland is the world's largest natural recycling centre for soluble and solid wastes and spread over 12500 hectors. It is also known as the largest sewage fed aquaculture land in the world and provides 264 sewage-fed fisheries, agriculture and solid waste farms and about 150 metric tons of vegetable everyday from its garbage farms. This study mainly focuses on analysis of different soils of EKW area based on different parameters and evaluates relation between soil properties and macro-nutrients. After analysing the parameters it can be easily said that the soils of this land provides nutrients for the growth of this huge crop production. Also from the Pearson’s Correlation analysis it can be concluded that there are some significant positive correlation relationship between the parameters like Organic carbon and Water Holding Capacity, Nitrogen and Phosphorus. A significant negative correlation between Temperature and Water Holding Capacity, Organic Carbon, Nitrogen and Phosphorus has been observed and significant positive relationship between Water Holding Capacity and Nitrogen also exist.
Keywords:Pearson’s Correlation, Soil Parameter, East Kolkata Wetland, Physical Parameter
I.
INTRODUCTION
The East Calcutta Wetlands, lying at the eastern part of the city (22°27’ N 88°27’ E), are a complex of natural and human-made wetland. It includes salt marshes and salt meadows, as well as sewage farms and settling ponds (Sanyal et al., 2015).The ground soil of this area provides a huge quantity of crop production regularly. Soil is a naturally occurring porous medium which supports the growth of plants by providing adequate amount of air, heat, water and nutrients. Soil also acts as a reservoir of nutrients required by crops (Patel et al., 2014). Thus for the sake of human health and effective maintenance a continuous monitoring of quality parameters is essential. However it is very difficult to monitor all
the parameters on a regular basis even if adequate laboratory facilities are provided. Therefore as an alternative approach a statistical correlation matrix has been developed to analyze mathematical relationship between the parameters. By doing the analysis we can determine and availability of macro or micro nutrients necessary for the soil fertility as it is one of the biggest reason for crop growth.
II.
METHODS AND MATERIAL
A. Study Area:
from the sites of different water bodies i.echilparajhil, mathpukurkhal, metropoloitankhal, 5 no jhil and 7no jhil.
B. Preparation of Soil samples for Analysis :
Each of the collected soil samples were homogeneously mixed and left in the air for 2 hours in paper dishes to attain equilibrium. The soil samples were then dried in the oven at 25°C for 2 hours depending upon the wetness. After drying the soil, clods were crushed gently and grounded with the help of a mortar and were passed through 2.0 mm and 0.5 mm stainless steel sieve to remove other impurities like stones, concretions, wood, plant material etc. from the samples. After finishing all the above steps the samples were used for further analysis. (Jackson et al., 1967; Singh et al., 1999).
C. Soil Parameter Tests:
Soil analysis is conducted for one of several possible reasons. In agricultural field mostly the tests are done to estimate the plant-available concentrations of nutrients content, the plant composition, and other characteristics like acidity or pH level. A soil test can also determine fertility, or the expected growth potential of the soil and presence of metals (Black C.A. 1965)
In this work soil parameter tests were divided into two categories: Physical tests and Chemical tests. Physical tests include determination of temperature and Determination of Saturation Moisture Percentage or Water Holding Capacity (Kadam et al., 2005) whereas chemical tests include determination of pH (Davis et al., 1970), measurement of Electrical Conductivity (Singh et al. 1999), determination of Organic Carbon (Page et al. 1982), Nitrogen (Nelson et al., 1972) and Phosphorus (Dewis et al., 1970 & Olsen et al., 1982).
D. Statistical Analysis:
Pearson’s Correlation analysis (Bhandari et al., 2008) was done using IBM SPSS statistics 22.
III. RESULTS AND DISCUSSION
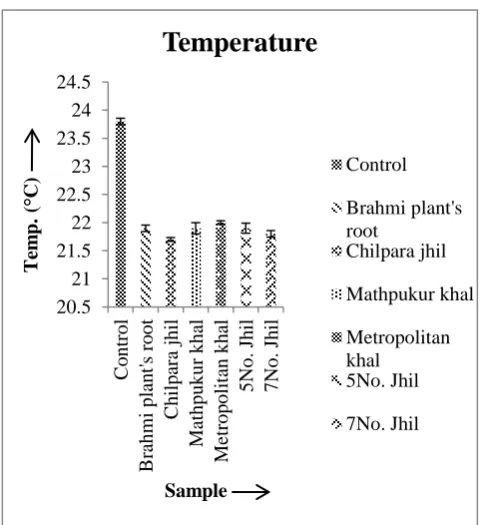
A. Temperature: Soil temperature is nothing but the measurement of the warmth in the soil or in other words the measurement of how hot or cold the soil is. Temperature is considered to be a very important physical analysis as it also controls many biological and chemical processes within the soil. The most ideal temperature of soils ranges from 18-24°C because if the temperature gets too high, it kills things that live in the soil, like plant roots and other organisms. Likewise, chemical reactions that aren’t mediated by soil organisms tend to go faster as the temperature increases.
Figure 1: Determination of temperature with standard error
The above graph shows that the temperature of all the samples of the wetlands and the control one is not more than 24°C (Fig:1). So the soil samples are very much ideal for the growth of any kind of plant species
20.5 21 21.5 22 22.5 23 23.5 24 24.5
C
o
n
tr
o
l
B
rah
m
i p
lan
t's r
o
o
t
C
h
il
p
ar
a
jh
il
Ma
th
p
u
k
u
r
k
h
al
Me
tr
o
p
o
lit
an
k
h
al
5
No
.
Jh
il
7
No
.
Jh
il
T
em
p.
(°
C)
Sample
Temperature
Control
Brahmi plant's root
Chilpara jhil
Mathpukur khal
Metropolitan khal
5No. Jhil
and fully justifies with the huge amount of agricultural field and crop production over there.
B. Determination of Saturation Moisture Percentage/ Water Holding Capacity: This test gives an idea about the capacity of soil to hold water for the use by crops. Decomposed organic matter increases the water holding capacity and also exchangeable sodium and type of clay mineral also have a significant effect on water holding capacity.
Figure 2: Determination of saturation moisture content with standard error
According to the above result there is a noticeable difference between the control soil and samples. Water holding capacity of sample soils are higher than that of control soil (Fig:2) and this is one of a reason why crop production rate is high in this wetland. As this area also have high amount of organic matter and metals present in the soil compared to control soil it increases the percentage of saturated moister.
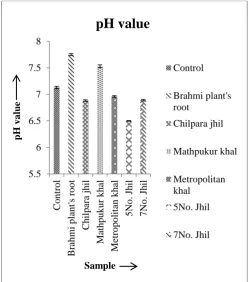
C. pH: It has a very important role in determination of the availability of nutrients to plants, plant growth and is also useful for soil classification on the basis of acidity or alkalinity. Generally
extremely acidic soils (pH 4.0-5.0) can have high concentrations of soluble aluminum, iron and manganese which may be toxic to the growth of some plants. The best pH range for most plants is 6 to7 which gives the most ready availability of plant nutrients. Also, some plants grow well only in slightly acid to moderately alkaline (pH 7.4-7.8) soils.
Figure 3: Determination of pH with standard error
Although the wetland is known as one of the largest dumping grounds and contents variety of wastes and heavy metals the pH value is neither very acidic nor very alkaline. The range of pH for the samples in between 6.5 to 8 i.e neutral to moderately alkaline and suitable for plant growth (Fig:3).
D. Measurement of Electrical Conductivity: In soil electrical conductivity gives a measure of soluble salt content of the soil. Pure water is very poor conductor of electric current, whereas water containing the dissolved salts in soil conducts current approximately in proportion to the amount of soluble salts present. Based on this fact, the measurement of electrical conductivity gives a 0 10 20 30 40 50 60 C o n tr o l B rah m i p lan t's r o o t C h il p ar a jh il Ma th p u k u r k h al Me tr o p o lit an k h al 5 No . J h il 7 No . Jh il w a ter ho ldi ng ( %) Sample
Water holdind capacity
satisfactory indication of the total concentration of ionized constituents.
Figure 4: Determination of Electrical conductivity with standard error
The EC values are affected by many environmental factors like climate, local biota, geology as well as human impact and thus these values change depending on the location and condition of the land. It is therefore very much difficult to say the ideal EC levels. However according to general guideline for a good quality soil EC level will be somewhere between 200 µS/cm and 1200 µS/cm. Though the control soil matches this guideline but each of the soil samples of East Kolkata Wetland having higher amount of wastes and heavy metals fails to match the level by showing EC level starting from more than 1000µs to 2000µs (Fig:4).
E. Determination of Organic Carbon: Organic carbon enters the soil through the decomposition of plant and animal residues, root exudates, living and dead microorganisms etc. also it is one of the most important constituent of soil due to it’s effect on plant growth as both a source of energy and nutrient. It also makes the soil resistant to erosion but porous enough to allow air, water and plant roots to move through soil
Figure 5: Determination of organic carbon with standard error
The root soil of Brahmi, Metropolitan and chilparajhil area has the highest percentage of Organic Carbon content (Fig:5).
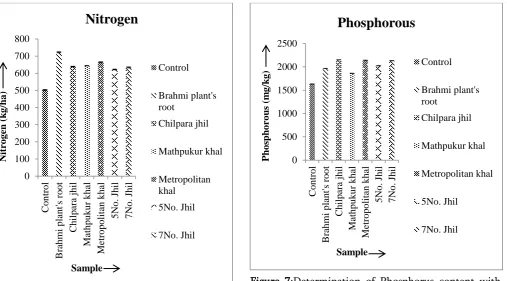
F. Determination of Nitrogen: Nitrogen is present in the soil in organic form and the availability is associated with the activity of micro-organisms. The nitrification rate of a soil is measure of the rate of release of available nitrogen from the organic matter in the soil.
0 500 1000 1500 2000 2500
E
lect
ro
co
nd
uct
iv
it
y
(
µs)
Sample
Electrical Conductivity
Control
Brahmi plant's root
Chilpara jhil
Mathpukur khal
Metropolitan khal
5No. Jhil
7No. Jhil
0 1 2 3 4 5 6 7
O
rg
a
nic
ca
rbo
n (
%)
Sample
Organic carbon
Control
Brahmi plant's root
Chilpara jhil
Mathpukur khal
Metropolitan khal
5No. Jhil
Figure 6:
Determination of Nitrogen content with standard errorThe soil samples are very rich in Nitrogen content than of the control one. Also among the samples Brahmi root soil consist of the highest amount (Fg:6).
G. Determination of Phosphorous: Phosphorous is also one of the most critical essential element influencing plant growth & production. Phosphorous has an important effect on Photosynthesis, Nitrogen fixation, Crop maturation, Root development, Protein synthesis etc. Thus, it is essential to calculate the available phosphorous present in the soil.
Figure 7:Determination of Phosphorus content with standard error
All the soil samples have a good percentage of phosphorus indicating plant growth and nutrition (Fig:7).
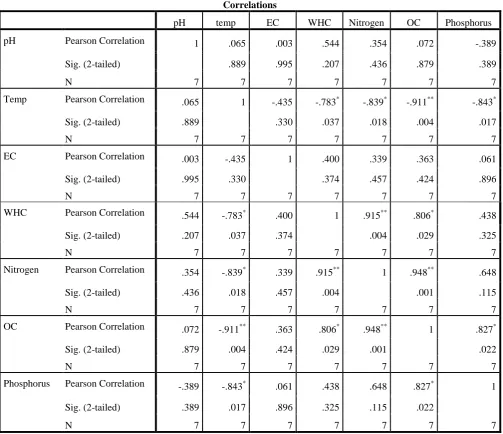
H. Statistical Analysis
The IBM SPSS statistics 22 software was used to get the following correlation matrix of the soil samples. Here pH, Temperature, EC, WHC, Organic Carbon, Nitrogen and Phosphorus was used as variables (Table:1). The following table describes the correlation values between the parameters.
.783,P=0.037, R(5)= -.911, P = .004, R(5)= -.839, P=.018 and R(5)= -.843, P=.017 respectively was observed.
A significant positive relationship between WHC and Nitrogen R (5) = .915, P = .004 was also observed.
Table I: The Pearson’s correlation values between different parameters
Correlations
pH temp EC WHC Nitrogen OC Phosphorus
pH Pearson Correlation 1 .065 .003 .544 .354 .072 -.389
Sig. (2-tailed) .889 .995 .207 .436 .879 .389
N 7 7 7 7 7 7 7
Temp Pearson Correlation .065 1 -.435 -.783*
-.839* -.911** -.843*
Sig. (2-tailed) .889 .330 .037 .018 .004 .017
N 7 7 7 7 7 7 7
EC Pearson Correlation .003 -.435 1 .400 .339 .363 .061
Sig. (2-tailed) .995 .330 .374 .457 .424 .896
N 7 7 7 7 7 7 7
WHC Pearson Correlation .544 -.783* .400 1 .915** .806* .438
Sig. (2-tailed) .207 .037 .374 .004 .029 .325
N 7 7 7 7 7 7 7
Nitrogen Pearson Correlation .354 -.839* .339 .915** 1 .948** .648
Sig. (2-tailed) .436 .018 .457 .004 .001 .115
N 7 7 7 7 7 7 7
OC Pearson Correlation .072 -.911**
.363 .806* .948** 1 .827*
Sig. (2-tailed) .879 .004 .424 .029 .001 .022
N 7 7 7 7 7 7 7
Phosphorus Pearson Correlation -.389 -.843* .061 .438 .648 .827* 1
Sig. (2-tailed) .389 .017 .896 .325 .115 .022
N 7 7 7 7 7 7 7
*. Correlation is significant at the 0.05 level (2-tailed).
**. Correlation is significant at the 0.01 level (2-tailed).
IV. CONCLUSION
All the physical and chemical parameters of the soil samples collected from East Kolkata Wetland have given a satisfactory result indicating a good plant growth and nutrition. However due to the presence of wastes and heavy metals the Electrical Conductivity
relationship between Temperature and Water Holding Capacity, Organic Carbon, Nitrogen and Phosphorus was found and there is also a significant positive ssrelationship between Water Holding Capacity and Nitrogen. After analyzing all the parameters it can be concluded that the soil of East Kolkata Wetland is mainly influenced by the Temperature and Water Holding Capacity and all the other factors are having a significant dependence on them influencing the soil quality and plant growth.
V.
REFERENCES
[1]. Bhandari, N. S., & Nayal, k. (2008). Correlation Study on Physico-Chemical Parameters and Quality Assessment of Kosi River Water, Uttarakhand. E- Journal of Chemistry. 5(2), 342-346.
[2]. Black, C. A. (1965). Methods of Soil Analysis, Part-2. American Society of Agronomy, INC. Soil Society of America, Madison, Wisconsin, USA.
[3]. Davis, J., & Freitas, F.(1970). In Physical & Chemical Methods of Soil & Water Analysis. FAO of United Nations, Rome, Soil Bulletin, 10, 65-67.
[4]. Dewis, J., & Freitas, F. (1970). Ammonium fluoride – Hydrochloric acid and Extraction. [5]. Jackson, M. L.(1967). Handling Soil Samples in
the Laboratory, in soil “Chemical Analysis”. Prentice Hall of India Pvt. Ltd., New Delhi, 2, 30-37.
[6]. Kadam, J. R., Shinde, P. B. s(2005). Practical Manual on Soil Physics – A method manual. Department of Agricultural Chemistry and Soil Science, P.G.I., Rahuri, 24.
[7]. Nelson, D. W., & Bremner, J. M. (1972). Preservation of soil samples for inorganic nitrogen analysis. Agron. J., 64 ,196 – 199. [8]. Olsen, S. R., & Sommers, L. E. (1982).
Phosphorous in method of soil analysis, Part-2,
Chemical and microbiological properties. Agronomy monograph. 9 (2).
[9]. Page, A.L., Miller, R.H., & Keeny, D.R. (1982). Organic Carbon in Methods of Soil Analysis, Chemical & Microbiological properties. American Society of Agronomy, Inc, Soil Science Society of America, Inc, Madison, Wilconsin, USA, 9(2), 570-571.
[10]. Patel, P. L., Patel, N. P., Patel, P. H., & Gharekhan, A. (2014). Correlation study of soil parameters of Kutch district agriculture land. International Journal of Scientific and Research Publication, 4(5), 1-5.
[11]. Sanyal, P., Chakraborty, S. K., & Ghosh, P. B. (2015). Phytoremediation of Sewage-Fed Wetlands of East-Kolkata, India - A Case Study. International Research Journal of Environment Sciences, 4(1), 80-89.