International Journal of Emerging Technology and Advanced Engineering
Website: www.ijetae.com (ISSN 2250-2459, ISO 9001:2008 Certified Journal, Volume 4, Issue 8, August 2014)732
Study on Experiments of Artificial Neural Network Using
Spatial Data
Nursida Arif
1, Projo Danoedoro
2 1,2Faculty of Geography, Gadjah Mada University (UGM), Kaliurang, Sekip Utara, Bulaksumur, Yogyakarta
Abstract - This study applied the Artificial Neural Network (ANN) to satellite image classification. This paper focuses on the responses of neural networks using the backpropagation network, and effect of changing ANN parameters on the accuracy of image classification as spatial data by experiments. Changing network parameters including every hidden layer, learning rate, momentum and the number of iteration of classification.
Keywords – backpropagation, hidden layer, satellite image
I. INTRODUCTION
Artificial Neural Network is one of the artificial intelligence models that are designed similar to biological neurons in humans who have the ability to tolerate mistakes and do whatever training patterns are included, learn and recognize something, even if there are irregularities (Fausset, 1994). ANN has high potential to solve difficult problems simulated using logic, expert systems analysis techniques, and software technology. For example, ANN can analyze large amounts of data to determine the pattern and characteristics in situations that are not recognized by existing rules. Neural networks are also able to provide a good prediction compared with the traditional method, although trained data has noise (Melchiore et al., 2008; Liu, 2012).
The most important thing is that ANN allow a different view of problems which cannot be solved by (exact) statistical methods due to their theoritical limitations (Petrus and Kranjinc, 1996).
The ANN system generally has three layers: input layer, hidden layer, output layer. One of algorithms that is widely used in the study of ANN is the
backpropagation algorithm for pattern recognition has the advantage of properly training and good response to similar patterns (testing data) in which the ANN output current is not equal to the expected output of the output will be propagated backward, if the output gives the wrong result, it will be corrected in order galatnya ANN can be reduced and further responses will be close to the correct value. Using backpropagation algorithm for classification of remote sensing image can eliminate fuzziness and uncertainty to some extent
Artificial neural network has been widely applied to the fields of image processing and obtained satisfactory results (Yuan et al., 2009)
In this paper, proposed the backpropagation algorithm to classification data which combining spectral data and non spectral. The classification results showed that it was an effective way.
II. DATA SOURCE
The data Imagery used in this study from Advanced Land Observing Satellite (ALOS), is a satellite owned by Japan. The image acquisition time is June, 2009. The image has a spatial resolution of 10 meters.
III. METHODOLOGY A. Selection of The Sample
The selection of the training area was not only done on the basis of spectral characteristics alone but the analysis of each parameter that affects the criticality of a land with a combination of spectral and non spectral data. Based on the analysis of each parameter several combinations were obtained for each class: potentially critical, rater critical, critical, and not critical.
Table I
Training Area Classes with a Total of 1070 Pixels
Class Definition of the class Total pixels
Critical Low-density vegetation, shallow/very shallow soils and steep slopes
250
Rather critical Low and medium vegetation density shallow soils and steep slopes
267
Potentially critical
Average vegetation, average soil depth and somewhat steep slopes
432
Not critical Average vegetation, flat slope, deep soil
121
International Journal of Emerging Technology and Advanced Engineering
Website: www.ijetae.com (ISSN 2250-2459, ISO 9001:2008 Certified Journal, Volume 4, Issue 8, August 2014) [image:2.595.56.275.143.458.2]733
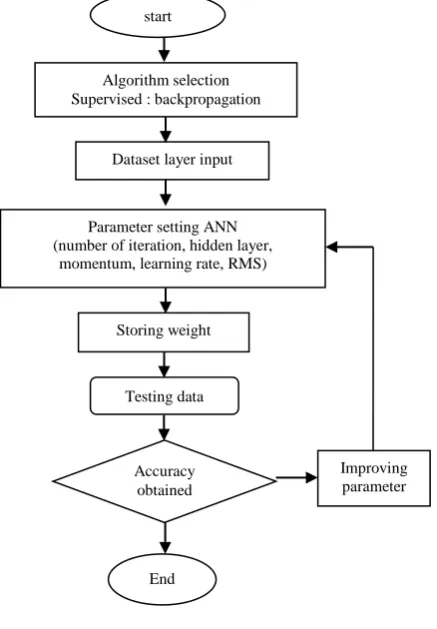
Figure 1. Flow diagram of study
B. Artificial Neural Network
The non-parametric supervised classification algorithm of Artificial Neural Networks was used. As a type of ANN, backpropagation has a function to multiply the input values with the total addition of weights to get output values by the transfer function (Pradhan et al., 2010).
Backpropagation is relatively simple implementation and generally works well. Network parameters to be determined are:
1. Iteration is the number of repetitions performed during the data training in the classification of critical lands. The number of iterations greatly affects the time spent in training and network testing
2. Learning rate, in this system, the learning constant that was used is 0.001 to 0.05. Learning Constant can be changed in order to obtain the most optimum constant value for the training process. Basically before the training is done, it is difficult to determine the magnitude of the most optimal training pace. The higher the average learning value, the faster the learning process, but this will increase the miscalculation value between the learning outcomes to inputs, such errors can be reduced by adjusting the momentum of learning (training momentum) with a value of less than 1. 3. Activation method used was the sigmoid activation
function, since this function can compress the unlimited signal into the limited signal in the threshold region ranged from 0 to 1; in addition to that, the resulting output value is not negative value. 4. Momentum value, in the interval value of zero to one. Entering the momentum value greater than zero will give the opportunity for setting the pace of training (training rate) which is higher without the occurrence of oscillations
5. RMS value, iteration will stop if the RMS value < tolerance limit value set on the network or the number of epoch that has reached a specified threshold.
6. Hidden layer is the layer that receives the response in the form of weights from input layer to be forwarded to the output layer. The number of hidden layers is determined through experimentation; at the beginning of the training hidden layer one and two will be tested
IV. ANALYSIS RESULTS
In our experiments we tested standard ANN-BP composed of seven input layers, one and two hidden layers and four output layers. Some parameters have a relationship based on experiments carried out 20 simulations, so the addition or reduction in value of one parameter often affects the value of the other parameters. The right combination will yield high accuracy with a stable network (Table II). The result of the correlates very well with the available ground truth data (Table III)
Improving parameter Parameter setting ANN
(number of iteration, hidden layer, momentum, learning rate, RMS)
Dataset layer input Algorithm selection Supervised : backpropagation
Testing data
Accuracy obtained Storing weight
International Journal of Emerging Technology and Advanced Engineering
Website: www.ijetae.com (ISSN 2250-2459, ISO 9001:2008 Certified Journal, Volume 4, Issue 8, August 2014) [image:3.595.181.413.145.406.2]734
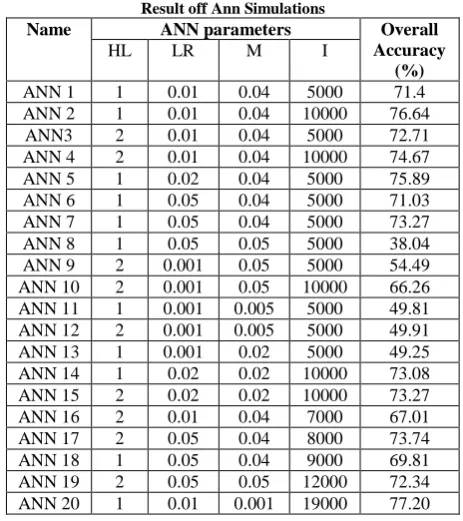
Table II Result off Ann Simulations
Name ANN parameters Overall Accuracy
(%)
HL LR M I
ANN 1 1 0.01 0.04 5000 71.4
ANN 2 1 0.01 0.04 10000 76.64
ANN3 2 0.01 0.04 5000 72.71
ANN 4 2 0.01 0.04 10000 74.67
ANN 5 1 0.02 0.04 5000 75.89
ANN 6 1 0.05 0.04 5000 71.03
ANN 7 1 0.05 0.04 5000 73.27
ANN 8 1 0.05 0.05 5000 38.04
ANN 9 2 0.001 0.05 5000 54.49
ANN 10 2 0.001 0.05 10000 66.26 ANN 11 1 0.001 0.005 5000 49.81 ANN 12 2 0.001 0.005 5000 49.91
ANN 13 1 0.001 0.02 5000 49.25
ANN 14 1 0.02 0.02 10000 73.08
ANN 15 2 0.02 0.02 10000 73.27
ANN 16 2 0.01 0.04 7000 67.01
ANN 17 2 0.05 0.04 8000 73.74
ANN 18 1 0.05 0.04 9000 69.81
ANN 19 2 0.05 0.05 12000 72.34
ANN 20 1 0.01 0.001 19000 77.20
Where; A (activation function); LR (learning rate); HL (hidden layer); M (Momentum);RMS (RMS exit criteria); I (literacy), Training RMS dan Testing RMS
Table III
Error Matrix of BP Network
Supervised training on artificial intelligence methods, the data will be easily recognizable with a smaller error when first trained to be a system or network can recognize the desired target outputs. Error is greater when the system is forced to recognize that the data has not been through the training in this case the network will generalize the data being tested.
The results proved that the ANN can capture complex relationship where the data is a combination of data identified spectral and non-spectral (Pradhan, 2007; Pradhan, 2010). In this study the accuracy of the simulation reaches the lowest 38% and highest 77.20%. Several previous studies using the backpropagation algorithm can achieve better accuracy up to 80% (Mas, JF, 2013; Sudheer et al., 2010).
Im
ag
e
clas
sifica
ti
o
n
Class
Ground truth
User
acuracy Total Critical Rather critical Potentially
critical Not Critical
Critical 147 20 26 0 76 193
Rather critical 36 203 36 15 70 290
Potentially critical 67 22 370 0 80.6 459
Not critical 0 22 0 106 82.8 128
Total 250 267 432 121 1070
Producer accuracy 58.8 76 85.6 87.6
[image:3.595.65.531.456.612.2]International Journal of Emerging Technology and Advanced Engineering
Website: www.ijetae.com (ISSN 2250-2459, ISO 9001:2008 Certified Journal, Volume 4, Issue 8, August 2014) [image:4.595.318.544.136.297.2]735
Figure 2.Result of classification using BP-ANN
Basically, each ANN input parameters affect the accuracy of the results. The first parameter, the hidden layer; increasing the number of hidden layer does not guarantee adding accuracy value. In this simulation, ANN 2 has achieved 76.64% accuracy with 1 hidden layer, but at 8 ANN with 1 hidden layer only reaches 38.04% accuracy. The second parameter, learning rate; in this study, the values of learning rate tested in the simulation consist of four (4) values --0.001 0.01 0.02 and 0.05 with a variation of value made for the purpose of looking at the value of learning rate how the network will tend to be stable and produce optimum accuracy. Lower accuracy occurs in the simulation with the value of learning rate of 0.001. Small learning rate value produced low accuracy as well, but that is not case if the learning rate with a higher value, does not guarantee high accuracy.
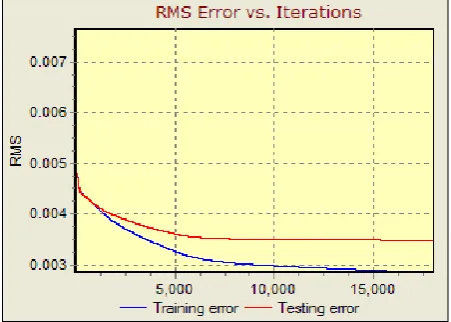
[image:4.595.64.273.137.309.2]The third parameter, the momentum; it correlation values 0.005 have no more than 50% overall accuracy. This means that the momentum value that is too small is less used as a reference for network simulation, in this case the critical land classification. The fourth parameter, the number of iteration; assessing the accuracy with the addition of iterations is based on the idea that the more data studied then the system will take longer to repeat the learning. The same logic is used in the human nervous system; with much data that people need more repetition to remember the data studied compared to when the data studied is less. some simulations have achieved above 70% accuracy with a larger iteration, and low accuracy occurs at iteration 5000. However, increasing the number of iterations is also strongly influenced by other parameters. As the number of iterations and the RMS error, the smaller the iteration or the less repetition is done then the higher RMS error on the training and testing. Conversely, the more the number of iterations is done, then the smaller the RMS error (Fig.2)
Figure 3. relationship between RMS error and iteration of simulation ANN 20
Many iterations can help the network be optimized so that the ANN does not experience lost of generalization. The generality of the ANN is the ability to give the correct answer or identify data that is not trained (Purnomo et. al., 2006).
The fifth parameter, RMS Training affects the accuracy of the results. The greater the RMS training value, the smaller the resulting accuracy, whereas the smaller the RMS training value, the greater the resulting accuracy (Samudra, 2007; Arif, 2011). The poor results in the classification are often caused by errors in the data rather than on the ground truth classification ANN (Caparini et. al., 2001).
V. CONCLUSION
ANN system that can combine spectral and non spectral data is improved the accuracy of results. The overall accuracy is influenced by the collaboration of the overall parameters. ANN performance was affected by the network parameters (hidden layer, momentum, learning rate, iteration, RMS).
Acknowledgments
Authors would like to thank PUSPICS at Gadjahmada University for providing the ALOS data, and to thank Nur Mohammad Farda,M.Cs for improving the Article.
REFERENCES
[1 ] Arif,N., 2011. Kajian Jaringan Syaraf Tiruan dalam Klasifikasi Lahan Kritis Berbasis Citra Alos, Tesis, Fakulas Geografi Universits Gadjah Mada,Yogyakarta
International Journal of Emerging Technology and Advanced Engineering
Website: www.ijetae.com (ISSN 2250-2459, ISO 9001:2008 Certified Journal, Volume 4, Issue 8, August 2014)736
[3 ] Fausett, L., 1994. Fundamentals Of Neural Networks Architectures, Algorithms, and Applications. Prentice-Hall, New Jersey.
[4 ] Mas,J.F., 2003. Mapping Landuse/Cover in Tropical Coastal Area Using Satellite Sensor Data, GIS and Artificial Neural Network. Estuarine, Coastal and Shelf Science, Vol.59, Issue 2, 219-230 [5 ] Liu,Q.,Wu,G., Chen,J., Zhou,G. 2010. Interpretation Artificial
Neural Network in Remote Sensing Image Classification. [6 ] Melchiore,C., Matteuci,M., Azzoni,A., Zanchi,A. 2008. Artificial
Neural Networks and Cluster Analysis in Landslide Susceptibility Zonation. Journal Safety Science
[7 ] Pradhan,B.,& Lee,S. 2007. Utilization of Optical Remote Sensing Data and GIS Tools for Regional Landslide Hazard Analysis Using an Artificial Neural Network Model.Earth Science Frontiers,14 (6),143 – 152
[8 ] Pradhan B., Lee,S., Buchroithner,M.F. 2007. A GIS-Based Back-propagation Neural Network Model and Its Cross-Application and Validation for Landslide Susceptibility Analyses.Computers, Enviroment and Urban Systems 34:216 – 239
[9 ] Pradhan B., Lee,S. 2010. Regional Landslide Susceptibility Analysis Using Back-propagation Neural Network Model at Cameron Highland, Malaysia. Landslide (7):13 – 30.
[10 ]Petrus,I., Krajinc,A., 1996. AiNet: A Neural Network Application for 32bit Windows Environment User manual, version 1.22 [11 ]Purnomo,M.H., dan Kurniawan, A., 2006. Supervised Neural
Networks dan Aplikasinya, Graha Ilmu, Yogyakarta
[12 ]Samudra,2007.Kajian Kemampuan Metode Jaringan Syaraf Tiruan untuk Klasifikasi Penutup Lahan dengan Menggunakan Citra ASTER,Tesis Fakultas Geografi,Universitas Gadjah Mada,Yogyakarta
[13 ]Sudheer,K.P.,Gowda P.,Chaubey I., and Howell T.,2010. Artificial Neural Network Approach for mapping Contrasting Tillage Practices.