Nat. Hazards Earth Syst. Sci., 11, 789–796, 2011 www.nat-hazards-earth-syst-sci.net/11/789/2011/ doi:10.5194/nhess-11-789-2011
© Author(s) 2011. CC Attribution 3.0 License.
Natural Hazards
and Earth
System Sciences
Gravity wave amplification and phase crest re-organization
over a shoal
N. Jarry1,2, V. Rey1, F. Gouaud1, and D. Lajoie2
1LSEET, Universit´e du Sud Toulon-Var, B.P 20132 F8395, la Garde, Cedex, France 2ACRI-in, 06904 Sophia-Antipolis Cedex, France
Received: 15 September 2010 – Accepted: 24 October 2010 – Published: 14 March 2011
Abstract. In this experimental work, both wave ampli-fication and phase evolution, due to a submerged mound, are studied. In addition to the classical surface wave measurements, the experimental study takes advantage of photographs that underline crest re-organization above and down-wave the shoal. In particular, together with wave amplification up to more than twice the incident wave, a wave steepening is observed in certain conditions in both the wave direction and in the cross-section. Due to a phase crest separation downstream of the shoal, steepening in the cross-shore direction is enhanced (up to 30% above the steepening along the main direction of propagation). Physical aspects are discussed through the analysis of the diffraction effects on the wave properties.
1 Introduction
An estimate of the wave characteristics near the shore has been one of the major issues in coastal engineering. For the purpose of the maritime navigation, the local increase of wave steepness may become dramatic when huge waves are generated. For wave propagating over varying sea-bed topography, wave propagation numerical models, that are spectral (Booij et al., 1999; Benoit et al., 1996), phase resolving (Berkhoff, 1972; Radder, 1979; Kirby, 1986) or based on Boussinesq equations (Li and Zhan, 2001) have been developed. For their validation, comparisons to experimental studies are often made. A number of experiments on different shoal configurations with various shapes were realised (Arthur, 1946; Berkhoff et al., 1982; Vincent and Briggs, 1989) in order to determine the wave transformation behind the shoal. Numerous numerical
Correspondence to: V. Rey
models were tested on the Vincent and Briggs’ experiment conducted in CERC’s basin (e.g., Suh and Dalrymple, 1993; Holthuijsen et al., 2003). The shoal consisted of an elliptic mound, patterned after Berkhoff et al. (1982), with a major radius of 3.96 m, minor radius of 3.05 m, and a maximum height of 30.48 cm at the centre, on which monochromatic and spectral incident waves were tested. They showed, in particular, wave amplification up to more than twice that of the incident wave at the downstream part of a submerged elliptical mound for regular waves. As a consequence, wave steepness is strongly increased since the wave length is shorter above the mound. If wave amplification and direction of propagation are well-illustrated in these studies, there is no information on the wave phase evolution, especially in the cross-shore direction. This can be of major interest since wave diffraction may lead to steep slopes along the crests. The purpose of this work is to study both wave amplification and phase evolution due to a submerged mound. In addition to the classical surface wave measurements, the experimental study takes advantage of photographs that underline crest re-organization above the shoal. After a presentation of the experimental set-up, results are presented and discussed.
2 Experimental set-up
The experiment was performed at the wave basin of Toulon University, France. The basin has a useful length of 10 m, an effective width of 2.6 m and a maximum water depth of about 1 m. At one end, a wave generator allowed to generate regular and unidirectional waves. At the other end, a parabolic duckboard played an absorber function. The underwater three-dimensional mound is a 1.50 m long by 1 m wide quasi-elliptic shoal, with a maximum height of 30 cm as shown in Fig. 1. It consisted of a half-sphere, widened with a 50 cm rectilinear part on its centre. The extension of the shoal in the wave propagation direction (x-axis) had been numerically tested by using the model REF/DIF1 (Kirby
790 N. Jarry et al.: Gravity wave amplification and phase crest re-organization over a shoal
girder. In Fig. 2, the
location of the shoal and of the gauges are presented from a plan
view. Gauges 2 to 4 were separated from a distance of 15cm whereas gauges 4 to 7 were
spaced by 20cm, in order to improve the accuracy of the measure just above the shoal.
Fig. 1: Experimental set-up.
Acquisition was done through the mobile girder every 10cm, from 0.30m upstream the
shoal (x=3.20m) to 1.40m downstream (x=6.40m). The sampling frequency was 32 Hz,
the duration of the data acquisition was 60 seconds. A digital camera was placed on a
footbridge at 8m from the wave generator. Photographs were shot at 1m and 2m above
the water level in the total dark.
Fig. 1. Experimental set-up.
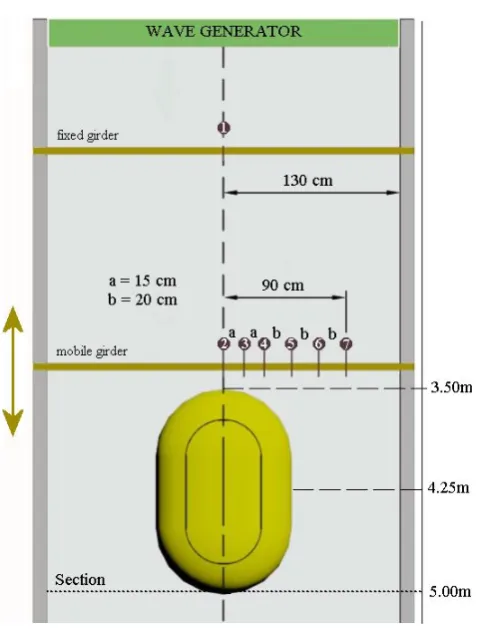
et al., 2002) during a dimensioning phase to increase the wave amplification, and to offer a longer part on which the waves were refracted. The centre of the shoal was located at x = 4.25 m from the wave generator, length wise, It is centred in the middle of the basin (y = 2 m), width wise.
For the wave measurements, a resistive wave gauge was placed in front of the wave generator as reference, and 6 others were fixed linearly crosswise on a mobile girder. In Fig. 2, the location of the shoal and of the gauges are presented from a plan view. Gauges 2–4 were separated from a distance of 15 cm whereas gauges 4–7 were spaced by 20 cm, in order to improve the accuracy of the measure just above the shoal.
Acquisition was done through the mobile girder every 10 cm, from 0.30 m upstream the shoal (x = 3.20 m) to 1.40 m downstream (x = 6.40 m). The sampling frequency was 32 Hz, the duration of the data acquisition was 60 s. A digital camera was placed on a footbridge at 8 m from the wave generator. Photographs were shot at 1 m and 2 m above the water level in the total dark.
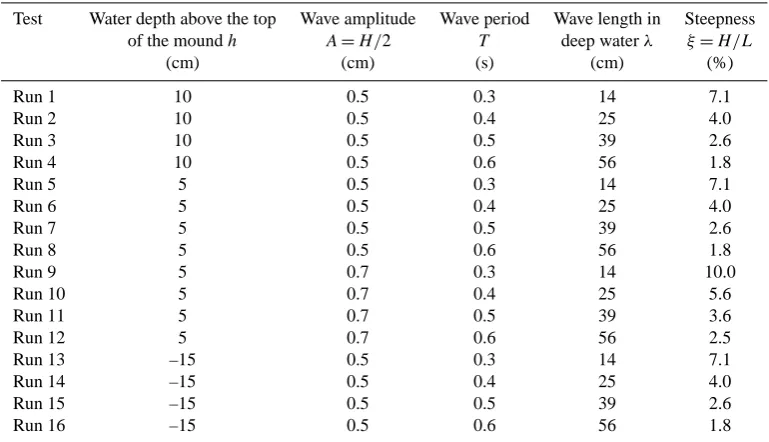
The only light came from the flash of the camera that lit the basin in an oblique way. This allowed crests to be illuminated and easily distinguishable on the photographs. In the experiment, incident waves are monochromatic and unidirectional. A summary of all the experimental conditions is provided in Table 1. In the present study focused on wave steepening due to refraction-diffraction over the shoal, runs 6–8 are analysed (water depth h=0.05 m above the top of the shoal). Runs at this water level for higher wave heights (runs 9–12) did not show any significant changes in the free surface behaviours, except a slight breaking for the highest periods that disturbed observations of the crests location. Detailed results for the other cases are presented
Fig. 2: Schematic plan view of the shoal and location of the wave gauges.
The only light came from the flash of the camera that lighted the basin in oblique way.
This allowed crests to be illuminated and easily distinguishable on the photographs. In
the experiment, incident waves are monochromatic and unidirectional. A summary of
all the experimental conditions is provided in Tab. 1. In the present study focused on
wave steepening due to refraction-diffraction over the shoal, runs 6 to 8 are analysed
(water depth h=0.05m above the top of the shoal). Runs at this water level for higher
wave heights (run 9 to 12) did not show any significant changes in the free surface
behaviours, except a slight breaking for the highest periods that disturbed observations
of the crests location. Detailed results for the other cases are presented in Jarry (2009).
They underline the diffraction phenomenon for the submerged cases and the freely wave
crests crossing when the shoal is emerged.
Fig. 2. Schematic plan view of the shoal and location of the wave gauges.
in Jarry (2009). They underline the diffraction phenomenon for the submerged cases and the freely wave crests crossing when the shoal is emerged.
N. Jarry et al.: Gravity wave amplification and phase crest re-organization over a shoal 791
Table 1. Experimental wave characteristics.
Test Water depth above the top Wave amplitude Wave period Wave length in Steepness of the moundh A=H /2 T deep waterλ ξ=H /L
(cm) (cm) (s) (cm) (%)
Run 1 10 0.5 0.3 14 7.1
Run 2 10 0.5 0.4 25 4.0
Run 3 10 0.5 0.5 39 2.6
Run 4 10 0.5 0.6 56 1.8
Run 5 5 0.5 0.3 14 7.1
Run 6 5 0.5 0.4 25 4.0
Run 7 5 0.5 0.5 39 2.6
Run 8 5 0.5 0.6 56 1.8
Run 9 5 0.7 0.3 14 10.0
Run 10 5 0.7 0.4 25 5.6
Run 11 5 0.7 0.5 39 3.6
Run 12 5 0.7 0.6 56 2.5
Run 13 –15 0.5 0.3 14 7.1
Run 14 –15 0.5 0.4 25 4.0
Run 15 –15 0.5 0.5 39 2.6
Run 16 –15 0.5 0.6 56 1.8
3 Experimental results
The experimental results, hereafter presented, correspond to runs 6 to 8. They correspond to the moderate incident wave steepnessξ=H /L and to a water depthh=0.05 m above the top of the shoal (see Table 1).
3.1 Wave evolution in the direction of propagation
The amplification factor along x-axis in the centre of the wave basin (Y = 2 m) is presented in Fig. 3, respectively, for
T=0.4 s, 0.5 s and 0.6 s. The same trend is observed, with an increase of the amplitude up to X = 4.5–4.7 m, near the end of the top part of the shoal (see Table 2) and a decrease downstream.
For T =0.6 s, an increase of a factor 2.5 of the wave amplitude is observed. The relative wave slope RWS can be calculated as follows:
RWS= H
H0
L0
L (1)
WhereH0andL0are, respectively, the incident wave height
and wave length, H is the maximum wave height and L
the local distance between two successive maxima. RWS for runs 6–8 are reported in Table 2. We can observe (see Sect. 3.2) that the local distance between two successive maxima downstream the shoal is slightly higher than for the incident wave. It can be explained by the wave diffraction phenomenon at the origin at the wave acceleration in the central part of the shoal (see Sect. 4.1).
Fig. 3: Amplification factor along x-axis in the centre of the basin
Run Period amplification Maximum Distance from the wavemaker
x(m)
Relative wave slope
6 T=0.4 1.40 4.80 1.07 7 T=0.5 1.75 4.70 1.67 8 T=0.6 2.50 4.70 2.22
Table 2: Maximum of the amplification factor and wave slope along the x-axis
For T=0.6s, an increase of a factor 2.5 of the wave amplitude is observed. The
relative wave slope RWS can be calculated as follows:
0 0
H L RWS
H L
(1)
Where H0 and L0 are respectively the incident wave height and wave length, H is the
maximum wave height and L the local distance between two successive maxima. RWS
for runs 6 to 8 are reported in Tab. 2. We can observe (see section 3.2) that the local Fig. 3. Amplification factor along x-axis in the centre of the basin.
Table 2. Maximum amplification factor and wave slope along the x-axis.
Run Period Maximum Distance from Relative amplification the wavemaker wave
x(m) slope
6 T=0.4 1.40 4.80 1.07 7 T=0.5 1.75 4.70 1.67 8 T=0.6 2.50 4.70 2.22
792 N. Jarry et al.: Gravity wave amplification and phase crest re-organization over a shoal
distance between two successive maxima downstream the shoal is slightly higher than
for the incident wave. It can be explained by the wave diffraction phenomenon at the
origin at the wave acceleration in the central part of the shoal (see section 4.1).
3.2 Wave amplitude evolution in a cross-section
The amplification factor along y- axis down-wave the shoal (X=5m) is presented in Fig.
4 for T=0.4, 0.5 and 0.6s.
Fig. 4: Amplification factor in the cross-section x=5m downstream the shoal
We can observe an oscillating behavior of the amplification with decreasing values of
the maxima from the centre to the sides of the wave basin. Assuming an almost constant
phase in the cross section, the maximum slope is given by H/ Lc where H is the
difference between the maximum (at Y= Ymax=2) and the first minimum (at Y=Ymin)
and Lc= Ymin - Ymax. The RSW can be expressed as follow:
0
0
0.5
C H L RWS
H L
(2)
Results are given in Tab. 3.
Fig. 4. Amplification factor in the cross-section x = 5 m downstream of the shoal.
Table 3. Wave slopes along the y-axis.
Run Period Relative wave slope
6 T=0.4 0.25 7 T=0.5 0.73 8 T=0.6 1.21
3.2 Wave amplitude evolution in a cross-section
The amplification factor along y-axis down-wave the shoal (X = 5 m) is presented in Fig. 4 forT=0.4, 0.5 and 0.6s.
We can observe an oscillating behaviour of the amplifica-tion with decreasing values of the maxima from the centre to the sides of the wave basin. Assuming an almost constant phase in the cross-section, the maximum slope is given by
1H /Lcwhere1H is the difference between the maximum
(at Y = Ymax= 2) and the first minimum (at Y = Ymin) and
Lc= Ymin–Ymax. The RSW can be expressed as follow:
RWS=0.51H
H0
L0
Lc
(2) Results are given in Table 3.
We can see that the wave slope remains quite mild compared to the wave slope in the direction of propagation. 3.3 Wave crests evolution
Photographs of the free surface for runs 6 to 8 are presented in Figs. 5–7.
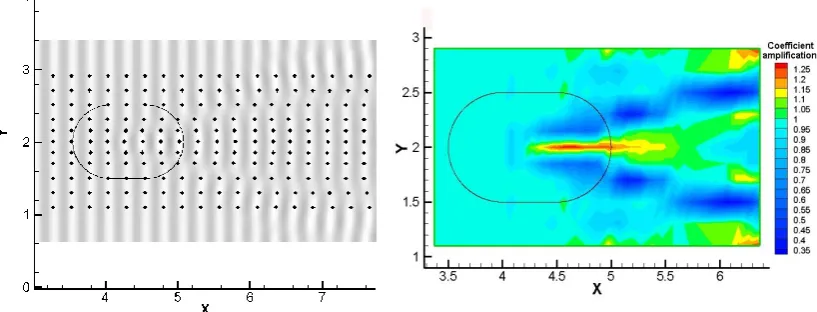
As a general trend, we can observe a refraction-diffraction process due to the shoal. Downstream of the shoal, a tridimensional pattern is observed due to segmentation onto 3 parts of the wave crest: a central crest with a quasi-linear increase of its width and two symmetrical crests of an opposite phase on both sides. The quantitative results are calculated thanks to the synchronized wave gauges 2–7 and
Run Period Relative
wave slope
6 T=0.4 0.25
7 T=0.5 0.73
8 T=0.6 1.21
Table 3: Wave slopes along the y-axis
We can observe that the wave slope remains quite mild compared to the wave slope in
the direction of propagation.
3.3 Wave crests evolution
Photographs of the free surface for runs 6 to 8 are presented in Figs. 5 to 7.
Fig. 5: Photograph of the free surface for run 6, T=0.4s
Fig. 5. Photograph of the free surface for run 6,T=0.4 s
Fig. 6: Photograph of the free surface for run 7, T=0.5s
Fig. 7: Photograph of the free surface for run 8, T=0.6s
Generation of
Harmonic
waves
Opposite
phases
0.9m
0.65m
Fig. 6. Photograph of the free surface for run 7,T=0.5 s. Fig. 6: Photograph of the free surface for run 7, T=0.5s
Fig. 7: Photograph of the free surface for run 8, T=0.6s
Generation of Harmonic waves Opposite
phases
0.9m
0.65m
N. Jarry et al.: Gravity wave amplification and phase crest re-organization over a shoal 793 As a general trend, we can observe a refraction-diffraction process due to the shoal.
Downstream the shoal, a tridimensional pattern is observed due to segmentation onto 3 parts of the wave crest: A central crest with a quasi-linear increase of its width and two symmetrical crests of opposite phase on both sides. The quantitative results are
calculated thanks to the synchronized wave gauges 2 to 7 and the use of the gauge 1 as a reference for successive locations of the girder along the basin. Wave phases along the basin (diamonds, crest extrapolations are in grey) and amplitudes above and after the shoal are presented in Figs. 8 to 10 for runs 6 to 8.
Fig. 8: Wave phase (left) and amplitude (right) measurements, T=0.4s
Fig. 9: Wave phase (left) and amplitude (right) measurements, T=0.5s Fig. 8. Wave phase (left) and amplitude (right) measurements,T=0.4 s.
As a general trend, we can observe a refraction-diffraction process due to the shoal. Downstream the shoal, a tridimensional pattern is observed due to segmentation onto 3 parts of the wave crest: A central crest with a quasi-linear increase of its width and two symmetrical crests of opposite phase on both sides. The quantitative results are
calculated thanks to the synchronized wave gauges 2 to 7 and the use of the gauge 1 as a reference for successive locations of the girder along the basin. Wave phases along the basin (diamonds, crest extrapolations are in grey) and amplitudes above and after the shoal are presented in Figs. 8 to 10 for runs 6 to 8.
Fig. 8: Wave phase (left) and amplitude (right) measurements, T=0.4s
Fig. 9: Wave phase (left) and amplitude (right) measurements, T=0.5s Fig. 9. Wave phase (left) and amplitude (right) measurements,T=0.5 s.
the use of the gauge 1 as a reference for successive locations of the girder along the basin. Wave phases along the basin (diamonds, crest extrapolations are in grey) and amplitudes above and after the shoal are presented in Figs. 8–10 for runs 6–8.
In Figs. 5–7, the boundary between the crest at the centre and on both sides is depicted by two dotted lines moving apart with a certain angle. This opening angle is logically due to a diffraction effect since refraction does not occur after the shoal passage, because of a flat bottom. The phase lag between the crest at the centre of the basin and the crest on both sides is about one half-period, as observed in Figs. 8–10. Within this transitional zone, the signal from the wave gauges was completely flat and then did not allow the determination of the location of the crests. Let us note that for the run 8 (T =0.6 s), the basin was quickly subject to transverse oscillations that disturbed wave propagation.
However, for the three cases, both photographs and wave fields show that despite the phase lag at the crests in the cross direction, a behaviour of the crests nearly rectilinear
is observed down-wave of the shoal. ForT =0.4 s (Figs. 5 and 8), the central crest is rectilinear with an almost constant amplitude in the cross direction after down-wave from the shoal after a transition zone diffusion of the energy along the crests (see the three first wavelengths in Fig. 10). We can also observe a diminishing of the phase lag (from X = 5.8 m), which may also be due to sidewall effects. Similar trends are observed forT =0.5 s andT=0.6 s with a more pronounced curvature of the crests.
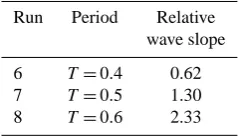
Right downstream (X = 5 m), central and side lines are in opposite phases. The maximum slope is then given
by 1H /Lc where 1H is the sum of the maximum (at
Y = Ymax= 2) and the first minimum (at Y = Ymin) and
Lc= Ymin−Ymax. The RSW are given by expression (2),
results are presented in Table 4.
We can observe that the wave slope is of the same order as observed in the direction of propagation. ForT =0.6 s, the slope is 30% steeper than observed in the direction of propagation.
794 N. Jarry et al.: Gravity wave amplification and phase crest re-organization over a shoal
Fig. 10: Wave phase (left) and amplitude (right) measurements, T=0.6s
In figures 5 to 7, the boundary between the crest at the centre and on both sides
is depicted by two dotted lines moving apart with a certain angle. This opening angle is
logically due to diffraction effect since refraction does not occur after the shoal passage,
because of a flat bottom. The phase lag between the crest at the centre of the basin and
the crest on both sides is of about one half-period, as observed in Figs. 8 to 10. Within
this transitional zone, the signal from the wave gauges was completely flat and then did
not allow the determination of the location of the crests. Let us note that for the run 8
(T=0.6s), the basin was quickly subject to transverse oscillations that disturbed wave
propagation.
However, for the three cases, both photographs and wave fields show that despite the
phase lag at the crests in the cross direction, a behaviour of the crests nearly rectilinear
is observed down-wave of the shoal. For T=0.4s (Figs. 5 and 8), the central crest is
rectilinear with an almost constant amplitude in the cross direction after down-wave the
shoal after a transition zone diffusion of the energy along the crests (see the three first
wavelengths in Fig. 10). We can also observe a diminishing of the phase lag (from
X=5.8m), which may also be due to sidewall effects. Similar trends are observed for
T=0.5s and T=0.6s with a more pronounced curvature of the crests.
Right downstream (X=5m), central and side lines are in opposite phases. The maximum
slope is then given by
H/ L
cwhere
H is the sum of the maximum (at Y= Y
max=2) and
Fig. 10. Wave phase (left) and amplitude (right) measurements,T=0.6 s.Table 4. Wave slopes along the y-axis.
Run Period Relative wave slope
6 T=0.4 0.62 7 T=0.5 1.30 8 T=0.6 2.33
4 Discussion and conclusion
In the experiments presented above, we observed that not only the wave slope may be steep downstream of the shoal in the main wave direction, but also in the cross-section. In the following, the role of the diffraction in the wave crest evolution is presented and then discussed for the present experiment conditions.
4.1 Role of the diffraction on the wave properties
The potential associated to a progressive surface wave is given by:
φ (x,y,z,t )= <e
−
ig
2ω
ch(k (z+h))
ch(kh) H e
−iωt
(3) where H (x,y,ω) the complex representation of the crest-to-trough height of the surface elevation, ω the pulsation,
h(x,y)the water depth,gthe gravity acceleration andkthe wave number given by the dispersion relation:
ktanh(kh)=ω
2
g (4)
Hcan be written
H= ˆH eiS (5)
where H (ˆ x,y,ω) is the height envelope and S (x,y,ω) its phase. In the linear theory of surface gravity waves
propagating over a mild sloping bottom, the equation of propagation is given by the mild-slope equation (Berkhoff, 1972):
divC Cg
−−→
gradH+k2C CgH=0 (6)
whereC=ω/ kis the phase celerity andCg=∂ω/∂kis the
group velocity.
Taking the mild-slope equation, following the height envelope and phase, one obtains after the separation of real and imaginary parts:
−−→
gradS2=k2+
divC Cg
−−→ gradHˆ C CgHˆ
(7)
and
divC CgHˆ2
−−→
gradS=0 (8)
In the pure refraction case, where the amplitude variation is considered as negligible, Eq. (7) leads to the eikonal equation: k=−grad−→S. When diffraction effect becomes preponderant, the second term of the right-hand side of Eq. (7) can not be neglected since k cannot be directly assimilated to the wave number of a progressive wave. Writing
k0=−grad−→S (9)
and introducing this relation in Eqs. (7) and (8), one obtains the following diffraction parameter (Holtuijsen and al., 2003):
δH=
divC Cg
−−→ gradHˆ k2C C
gHˆ
(10)
N. Jarry et al.: Gravity wave amplification and phase crest re-organization over a shoal 795 wave number, the wave phase and group velocities are
modified as follows:
k0=k√1+δH C0=C√1+δH Cg0=Cg
√ 1+δH
(11)
wherek0, C0 andCg0 are, respectively, the modified wave number, phase and group velocities in the presence of diffraction.
4.2 Application to the present case
In the present case, the wave focuses at the top of the shoal, at the centre of the wave basin. Wave height amplification due to this focalization drives to diffraction effect that tends to distribute this focused energy on each side of the crest. In the present experiments, together with energy distribution due to the diffraction, a separation of phases is observed. Equation (11) show how diffraction plays a preponderant role in modifying waves characteristics compared to the refraction only. In order to quantify the real influence of the diffraction on the crest re-organization, we have to study the diffraction parameter behaviour along the wave propagation.
On the top of the shoal, crosswise wave height variations strongly increase. They are even more important crosswise than lengthwise for run 8. Hence, we can assume that, at the cross-section located at X = 5 m from the wave generator, the diffraction parameter varies on the same order than the second derivative of the H curve on that section:
δH≈1yH (12)
In Fig. 11a, the wave height H in the section X = 5 m is superimposed to the diffraction parameter δH curve. The
zone where the diffraction parameter is positive is presented in blue, the zone where it is negative in red. From Eq. (11), we notice that when the diffraction parameter is negative (in the red zone), the wave number decreases, which means that at this point of the crest, the wave length increases as well as the wave celerity. On the contrary, when the diffraction parameter is positive (in the blue zone), the wave length and the phase celerity decrease. This observation would tend to prove that diffraction increases the wave length where the amplification is the highest and decreases it on each side, in the purpose of straightening the crests to prevent wave crossing. In Fig. 11b, we can see that the crest is incurved backward and tends to cross and form a caustic, whereas, the crest straightens and becomes completely rectilinear because of the diffraction effect. Nevertheless, due to the fact that the line crest breaks suddenly above the shoal, line crests with opposite phases appear.
diffraction parameter is negative (in the red zone), the wave number decreases, which
means that at this point of the crest, the wave length increases as well as the wave
celerity. At the contrary, when the diffraction parameter is positive (in the blue zone),
the wave length and the phase celerity decrease. This observation would tend to prove
that diffraction increases the wave length where the amplification is the highest and
decreases it on each side, in the purpose of straightening the crests up to prevent wave
crossing. In Fig.13.B, we can see that whereas the crest is incurved backward and tends
to cross and form a caustic, the crest straightens and becomes completely rectilinear
because of diffraction effect. Nevertheless, due to the fact that the line crest brakes
suddenly above the shoal, line crests with opposite phases appear.
A B
Fig. 13:
A
. Evolution of the diffraction parameter
Hwith the wave height graph for the
section located at 5m from the wave generator
B.
Influence of the diffraction parameter
H
on the crests organisation
This discontinuity of phase along the crests lasts downstream the shoal. This can
be explained by the delay of the wave above the shoal of order of half a wavelength of
the incident wave.
In the Vincent and Briggs study, the phase delay due to the shoal is of order of
one wavelength, as mentioned by Jarry (2009). As a result, after a line crest break
downstream the shoal, reorganization of the wave leads to a regular line crest with no
more phase delay.
Fig. 11. (A) Evolution of the diffraction parameterδH with the
wave height graph for the section located at 5 m from the wave generator, (B) Influence of the diffraction parameterδH on the
crests organisation.
This discontinuity of phase along the crests lasts downstream of the shoal. This can be explained by the delay of the wave above the shoal of the order of half a wavelength of the incident wave.
In the Vincent and Briggs study, the phase delay due to the shoal is of the order of one wavelength, as mentioned by Jarry (2009). As a result, after a line crest break downstream the shoal, reorganization of the wave leads to a regular line crest with no more phase delay.
4.3 Conclusions
Results from the experiment performed in the wave basin for monochromatic water waves pointed out the shoal effect on wave steepening, both in the wave direction and in the cross-section. In particular, the presence of phase discontinuity along the crests enhances such a steepening. Besides this phenomenon, possibly at the origin of local extreme waves, wave propagation characteristics in the presence of the shoal have been carefully measured and may be of interest for the testing of numerical models. Investigations concerning the physical explanation of frequency depending on the opening angle of separation of the phases are in progress.
Edited by: E. Pelinovsky
Reviewed by: H. B. Branger and V. Maximov
796 N. Jarry et al.: Gravity wave amplification and phase crest re-organization over a shoal References
Arthur, R. S.: Refraction of water waves by islands and shoals with circular bottom contours, EOS T. Am. Geophys. Un., 27(2), p. 168, 1946.
Benoit, M., Marcos, F., and Becq, F.: Development of a third-generation shallow-water wave model with unstructured spatial meshing, Proc. 25th Int. Conf. Coastal Eng. ASCE, New York, 465–478, 1996.
Berkhoff, J. C. W.: Computation of combined refraction-diffraction, Proc. 13th Coastal Eng. Conf., ASCE, New York, 471–490, 1972.
Berkhoff, J. C. W., Booy, N., and Radder, A. C.: Verification of numerical wave propagation models for simple harmonic linear water waves, Coast. Eng., 6(3), 255–279, 1982.
Booij, N., Ris, R. C., and Holthuijsen, L. H.: A third generation wave model for coastal regions, part I, model description and validation, J. Geophys. Res., 104, 7649–7666, 1999.
Holthuijsen, L. H., Herman, A., and Booij, N.: Phase-decoupled refraction-diffraction for spectral wave models, Coast. Eng., 49, 291–305, 2003.
Jarry, N.: Etudes exp´erimentales et num´eriques de la propagation des vagues au-dessus de bathym´etries complexes en milieu cˆotier, Ph.D. thesis, Universit´e du Sud Toulon-Var, 2009 (in French).
Kirby, J. T.: Higher order approximations in the parabolic equation method for water waves, J. Geophys. Res., 91, 933–952, 1986. Kirby, J. T., Dalrymple, R. A., and Shi, F.: Combined
refraction/diffraction model REF/DIF1, version 2.6. Documen-tation and User’s Manual, Research Report No. CARC-02-02, Centre for Applied Coastal Research, Department of Civil and Environmental Engineering. University of Delaware, Newark, 2002.
Li, Y. S. and Zhan, J. M.: Boussinesq-type model with boundary-fitted coordinate system, J. Waterw. Div.-ASCE, New York, 127(3), 152–160, 2001.
Radder, A. C.: On the parabolic equation method for water-wave propagation, J. Fluid Mech., 95, 159–176, 1979.
Suh, K. D. and Dalrymple, R. A.: Application of angular spectrum model to simulation of irregular wave propagation, J. Waterw. Div.-ASCE, 119, 505–520, 1993.