University of Pennsylvania
ScholarlyCommons
Publicly Accessible Penn Dissertations
1-1-2016
Liquid Crystal Anchoring Control and its
Applications in Responsive Materials
Yu Xia
University of Pennsylvania, [email protected]
Follow this and additional works at:http://repository.upenn.edu/edissertations
Part of theChemistry Commons,Mechanics of Materials Commons, and thePhysics Commons
This paper is posted at ScholarlyCommons.http://repository.upenn.edu/edissertations/2110 For more information, please [email protected].
Recommended Citation
Xia, Yu, "Liquid Crystal Anchoring Control and its Applications in Responsive Materials" (2016).Publicly Accessible Penn Dissertations.
2110.
Liquid Crystal Anchoring Control and its Applications in Responsive
Materials
Abstract
Liquid crystals (LCs), owing to their anisotropy in molecular ordering, are of interests not only in the display industry, but also in the soft matter community, e.g., to direct colloidal assembly and phase separation of surfactants, and to actuate two-dimensional (2D) sheets into three-dimension (3D). The functionality and performance of LC materials extensively rely on the molecular ordering and alignment of LCs, which are dictated by LC anchoring at various boundaries. Therefore, this thesis focuses on the study of LC anchoring from both small molecule LCs and liquid crystal monomers (LCMs), which in turn guides my design of surface topography and surface chemistry to control formation of uniform LC defect structures over cm2 samples under complex boundary conditions. The ability to precisely embed defect structures in a LC material also allows me to exploit the responsiveness of LCs to create actuators and scaffolds to (dis)assemble nano- and micro-objects. Specifically, by exploiting the bulk disclinations formed in the nematic phase of 4-octyl-4’-cyanobiphenyl (8CB) surrounding the micropillar arrays, we demonstrate (dis)assembly of gold nano-rods (AuNRs) for dynamic tuning of surface plasmon resonance (SPR). Due to the highly temperature-sensitive elastic anisotropy of 8CB, the bulk disclinations and consequently the AuNR assemblies and SPR properties can be altered reversibly by heating and cooling the LC system. Then we design and synthesize a new type of nematic LCMs with a very large nematic window. Therefore, they can be faithfully aligned at various boundary conditions, analogous to that of small molecule LCs. After crosslinking LCMs into liquid crystal polymers (LCPs), we are able to study the LC assembly, director field, and topological defects using scanning electronic microscopy (SEM) at the 100 nm resolution. We then turn our attention to direct LCM alignment through controlling of surface chemistry and topography. We demonstrate the essential role of surface chemistry in the fabrication of liquid crystal elastomer (LCE) micropillar arrays during soft lithography. A monodomain LCM alignment is achieved in a poly(2-hydroxyethyl methacrylate) coated polydimethylsiloxane (PDMS) mold. After crosslinking, the resultant LCE micropillars display a large radial strain (~30%) when heated across the nematic-isotropic phase transition temperature (TNI). The
understanding of surface alignment in LCMs is then transferred to LCEs with embedded topological defects. On micron-sized one-dimensional channels with planar surface chemistry, LCMs can be faithfully oriented along the local channel direction. After crosslinking, the 2D LCE sheets show pre-programmed shape
transformation to complex 3D structures through bending and stretching of local directors when heated above TNI. Last, we control LC alignment and defect formation on a flat surface simply by using chemical patterns. Planar anchored SU8 is photopatterned on homoetropically anchored
dimethyloctadecyl[3-(trimethoxysilyl)propyl] ammonium chloride (DMOAP) coated glass. By exploiting the pattern geometry, thus, boundary conditions, in combination with anisotropy of LC elasticity, we show that LC orientation can be precisely controlled over a large area and various types of topological defects are generated. Such defect structures can be further used to trap micro- and nanoparticles.
Degree Type Dissertation
Degree Name
Graduate Group
Materials Science & Engineering
First Advisor Shu Yang
Keywords
liquid crystal, liquid crystal polymer, photo-patterning, surface chemistry, surface topology
Subject Categories
LIQUID CRYSTAL ANCHORING CONTROL AND ITS APPLICATIONS IN
RESPONSIVE MATERIALS
Yu Xia
A DISSERTATION
in
Material Science and Engineering
Presented to the Faculties of the University of Pennsylvania
in
Partial Fulfillment of the Requirements for the
Degree of Doctor of Philosophy
2016
Supervisor of Dissertation
_______________________
Shu Yang, Professor, Materials Science and Engineering
Graduate Group Chairperson
_______________________
Shu Yang, Professor, Materials Science and Engineering
Dissertation Committee
Russell J. Composto, Materials Science and Engineering
Randall D. Kamien, Physics and Astronomy
ii
ACKNOWLEDGMENT
A PhD dissertation is a long and tough journey, and I could not come this far
without the support and help from the people surrounding me. I would like to sincerely
express my appreciation to all of my professors, colleagues, friends, collaborators and
family, without who I could not have any accomplishment.
Foremost, I would like to especially thank for the association and supervision
from my advisor, Professor Shu Yang. She has devoted much of her time and effort in the
past few years to supervise me in science, and my writing and presentation skills. I’m
sincerely grateful for the knowledge she shared with me, and the technical skills and
scientific thinking she advised me during my dissertation. I also appreciate her patience
and continuous encouragement when I was experiencing difficulties and failures in my
researches. I truly believe the invaluable advice I received will continue to benefit me in
the future of my career.
I also want to express my gratitude and appreciation to my thesis committee,
Professor Russell Composto of the Department of Materials Science and Engineering,
Professor Randall Kamien of the Department of Physics and Astronomy, and Professor
Kathleen Stebe of the Department of Chemical and Biomolecular Engineering, for their
supports and valuable suggestions for my researches in the past years.
I would like to appreciate the assistants and creative inputs from all of my
collaborators, including Professor Nader Engheta, Professor Jan van der Spiegel, Dr.
Milin Zhang, and Hongjie Zhu in the Department of Electrical and Systems Engineering,
Professor Jenny Sabin and Andrew Lucia in the Department of Architecture, Art, and
iii
Department of Materials Science and Engineering, Professor Randall Kamien, Dr. Daniel
Beller, Dr. Daniel Sussman, Dr. Maxim Lavrentovich, Dr. Toen Castle, Dr. Hillel
Aharoni, Zoey Davidson, Wei-Shao Wei and Dr. Ye Xu in the Department of Physics
and Astronomy, Professor Kathleen Stebe, Lisa Tran, Iris Liu, Yimin Luo and Nate Bade
in the Department of Chemical and Biomolecular Engineering, Professor Kaori
Ihida-Stansbury and Mithil Chokshi in the Department of Pathology and Laboratory Medicine,
and Professor Rudolf Zentel and Dr. Eva-Kristina Fleischmann at the Johannes
Gutenberg-Universität Mainz.
I would like to thank all the Yang group members, past and present, for their
warm and kind help through my dissertation, including Dr. Francesca Serra, Dr.
Mohamed Amine Gharbi, Dr. Chi-mon Chen, Dr. Elaine Lee, Dr. Yigil Cho, Dr.
Younghyun Cho, Dr. Dengteng Ge, Prof. Xiaomin Yang, Gerardo Cedillo, Minsik Jun,
Dr. Apiradee Honglawan, Euiyeon Jung, Hye-Na Kim, Dr. Su Yeon Lee, Dr. Jie Li,
Zhiwei Liao, Huseyin Kaya, Dr. Hyesung Cho, Dr. Yudi Rahmawan, Luke Shi, Chenbo
Wang, Gaoxiang Wu, Dr. Lebo Xu, Professor Lili Yang, Professor Youfa Zhang, and
Yongwei Zheng. I would like to especially thank Dr. Francesca Serra and Dr. Mohamed
Amine Gharbi for sharing their knowledge in liquid crystal physics.
I would like to express my appreciation to Dr. Gerald Lopez, Dr. Jamie Ford, Dr.
Matthew Brukman, Steve Szewczyk, Kyle Keenan, Hiromichi Yamamoto, and Eric
Johnston for training me on various nanofabrication and characterization instruments and
helpful discussions of these techniques. I would also like to thank Patricia Overend, Irene
Clements, Vicky Lee, Raymond Hsiao, and Enrique Vargas for making my life easier in
iv
Finally, I want to dedicate my thesis to my parents Yixin Xia and Zhizhen Lin,
my parents-in-law Jian Wang and Qiong Zheng, my wife Wenshan Wang, and my lovely
daughter Emily Xia, for their unconditional love and support. I especially want to express
sincere gratitude and love to my wife Wenshan, who gave up her promising career in
China, crossed the continent, and started a new life with me. I’m truly grateful for her
sacrifice and assistance, without which this dissertation could not have been possible.
v
ABSTRACT
LIQUID CRYSTAL ANCHORING CONTROL AND ITS APPLICATIONS IN
RESPONSIVE MATERIALS
Yu Xia
Shu Yang
Liquid crystals (LCs), owing to their anisotropy in molecular ordering, are of
interests not only in the display industry, but also in the soft matter community, e.g., to
direct colloidal assembly and phase separation of surfactants, and to actuate
two-dimensional (2D) sheets into three-dimension (3D). The functionality and performance of
LC materials extensively rely on the molecular ordering and alignment of LCs, which are
dictated by LC anchoring at various boundaries. Therefore, this thesis focuses on the
study of LC anchoring from both small molecule LCs and liquid crystal monomers
(LCMs), which in turn guides my design of surface topography and surface chemistry to
control formation of uniform LC defect structures over cm2 samples under complex
boundary conditions. The ability to precisely embed defect structures in a LC material
also allows me to exploit the responsiveness of LCs to create actuators and scaffolds to
(dis)assemble nano- and micro-objects. Specifically, by exploiting the bulk disclinations
formed in the nematic phase of 4-octyl-4’-cyanobiphenyl (8CB) surrounding the
micropillar arrays, we demonstrate (dis)assembly of gold nano-rods (AuNRs) for
dynamic tuning of surface plasmon resonance (SPR). Due to the highly
temperature-sensitive elastic anisotropy of 8CB, the bulk disclinations and consequently the AuNR
assemblies and SPR properties can be altered reversibly by heating and cooling the LC
vi
nematic window. Therefore, they can be faithfully aligned at various boundary
conditions, analogous to that of small molecule LCs. After crosslinking LCMs into liquid
crystal polymers (LCPs), we are able to study the LC assembly, director field, and
topological defects using scanning electronic microscopy (SEM) at the 100 nm
resolution. We then turn our attention to direct LCM alignment through controlling of
surface chemistry and topography. We demonstrate the essential role of surface chemistry
in the fabrication of liquid crystal elastomer (LCE) micropillar arrays during soft
lithography. A monodomain LCM alignment is achieved in a poly(2-hydroxyethyl
methacrylate) coated polydimethylsiloxane (PDMS) mold. After crosslinking, the
resultant LCE micropillars display a large radial strain (~30%) when heated across the
nematic-isotropic phase transition temperature (TNI). The understanding of surface
alignment in LCMs is then transferred to LCEs with embedded topological defects. On
micron-sized one-dimensional channels with planar surface chemistry, LCMs can be
faithfully oriented along the local channel direction. After crosslinking, the 2D LCE
sheets show pre-programmed shape transformation to complex 3D structures through
bending and stretching of local directors when heated above TNI. Last, we control LC
alignment and defect formation on a flat surface simply by using chemical patterns.
Planar anchored SU8 is photopatterned on homoetropically anchored
dimethyloctadecyl[3-(trimethoxysilyl)propyl] ammonium chloride (DMOAP) coated
glass. By exploiting the pattern geometry, thus, boundary conditions, in combination with
anisotropy of LC elasticity, we show that LC orientation can be precisely controlled over
a large area and various types of topological defects are generated. Such defect structures
vii
TABLE OF CONTENTS
ABSTRACT ... v
LIST OF TABLES ... xi
LIST OF FIGURES ... xii
CHAPTER 1: Introduction of Liquid Crystals and Liquid Crystal Polymers .. 1
1.1 Liquid Crystals ... 1
1.1.1 History of Liquid Crystals ... 1
1.1.2 Types of Liquid Crystals and Liquid Crystal Phases ... 2
1.2 Physical properties of liquid crystals ... 4
1.2.1 Anisotropy ... 4
1.2.2 Elastic distortion and elastic energy ... 4
1.2.3 Topological defects and core energy ... 6
1.2.4 Surface anchoring and surface anchoring energy ... 7
1.3 Anchoring control in nematic liquid crystals ... 10
1.3.1 Surface chemistry ... 10
1.3.2 Topology and topography ... 13
1.4 Anchoring control for nematic liquid crystal monomers/polymers ... 16
1.4.1 Rubbing ... 16
1.4.2 Mechanical stretching or shearing ... 17
1.4.3 Electric and magnetic fields ... 18
1.4.4 Photoalignment ... 19
1.5 Liquid crystal polymers ... 20
1.5.1 Types of liquid crystal polymer networks ... 20
1.5.2 Stimuli responsiveness of liquid crystal polymers ... 24
1.6 Thesis outline ... 28
1.7 References ... 32
CHAPTER 2: Fine Golden Rings: Tunable Surface Plasmon Resonance From Assembled Nanorods in Topological Defects of Liquid Crystals ... 38
2.1 Introduction ... 38
2.2 Experimental methods ... 40
2.2.1 Surface functionalization of gold nanorods with polystyrene ... 40
2.2.2 Micropillar fabrication ... 41
viii
2.2.4 Assembly of PS-AuNRs in LCs ... 42
2.2.5 Characterization ... 42
2.3 Optical properties of gold nanorods ... 42
2.4 Control of liquid crystal surface anchoring ... 43
2.5 Optical response of AuNRs ... 47
2.6 Conclusions ... 54
2.7 Contributions ... 55
2.8 References ... 56
CHAPTER 3: Direct Mapping of Local Director Field of Nematic Liquid Crystals at the Nanoscale ... 58
3.1 Introduction ... 58
3.2 Experimental methods ... 59
3.2.1 Materials ... 59
3.2.2 Synthesis of Liquid Crystal Monomers ... 60
3.2.3 Preparation of liquid crystal monomer solutions ... 63
3.2.4 Fabrication of patterned substrates ... 63
3.2.5 Preparation of substrates with desired LC anchoring ... 63
3.2.6 Liquid crystal cell preparation ... 65
3.2.7 UV Crosslinking ... 65
3.2.8 Characterization ... 66
3.2.9 Measurement of refractive index and birefringence ... 66
3.3 Design of stable nematic liquid crystal ... 67
3.4 Liquid crystal anchoring study ... 75
3.5 Direct mapping of liquid crystal local direct field ... 78
3.6 Estimation of the elastic constants of liquid crystal monomers ... 81
3.7 Direct mapping of liquid crystal defect structures ... 85
3.8 Conclusions ... 89
3.9 Contributions ... 90
3.10 References ... 90
CHAPTER 4: Better Actuation Through Chemistry: Using Surface Coatings to Create Uniform Director Fields in Nematic Liquid Crystal Elastomers ... 94
ix
4.2. Experiment methods ... 97
4.2.1 Materials ... 97
4.2.2 Preparation of PDMS molds ... 97
4.2.3 Preparation of PDMS molds with different surface chemistry ... 97
4.2.4 Preparation of DMOAP coated glass substrates ... 97
4.2.5 Preparation of 5CB in the PDMS mold ... 98
4.2.6 Fabrication of LCM4 pillars ... 98
4.2.7 Polarized optical microscopy ... 99
4.2.8 Water contact angle measurement ... 99
4.2.9 Landau-de Gennes numerical modeling ... 99
4.3 Landau-de Gennes numerical modeling ... 99
4.4 Control of liquid crystal surface anchoring ... 102
4.5 Actuation of cross-linked LCEs ... 107
4.6 Conclusions ... 110
4.7 Contributions ... 111
4.8 References ... 111
CHAPTER 5: Pre-programmed Folding of a 2D Nematic Liquid Crystal Elastomer Sheet into 3D by Directing Liquid Crystal Alignment in 1D Micro- channels ... 114
5.1 Introduction ... 114
5.2 Experimental methods ... 118
5.2.1 Materials ... 118
5.2.2 Characterization ... 118
5.2.3 Fabrication of 1D channel masters ... 118
5.2.4 Replica molding of epoxy alignment patterns ... 119
5.2.5 Preparation of DMOAP coated glass substrates. ... 119
5.2.6 Preparation of liquid crystal cells ... 119
5.2.7 Preparation of NLCE sheets ... 120
5.2.8 Characterization of the NLCE sheets ... 120
5.3 Fabrication of patterned 1D channels ... 120
5.4 LC anchoring study ... 124
5.5 Folding of NLCE 2D Sheets ... 125
5.6 Conclusions ... 129
5.7 Contributions ... 131
x
CHAPTER 6: Alignment of Nematic Liquid Crystals on Chemically
Patterned Surfaces: Precise Design of Topological Defects ... 135
6.1 Introduction ... 135
6.2 Experimental methods ... 139
6.2.1 Materials. ... 139
6.2.2 Characterization. ... 139
6.2.3 Micro-contact printing of SAMs. ... 140
6.2.4 Photo-patterning of SU8 layer. ... 140
6.2.5 DMOAP treatment ... 140
6.2.6 Water contact angle measurement ... 141
6.2.7 Preparation of liquid crystal cells ... 141
6.2.8 Assembly of colloids with liquid crystals ... 141
6.3 Preparation of chemically patterned surfaces ... 142
6.4 LC anchoring study on chemical patterns ... 145
6.5 Trapping microparticles within LC topological defects ... 153
6.6 Conclusions ... 154
6.7 Contributions ... 155
6.8 References ... 156
CHAPTER 7: Summary and Outlook ... 159
7.1 Summary ... 159
7.1.1 Control of molecular alignment and defect structures of small molecule liquid crystals for direct self-assembly of responsive materials ... 159
7.1.2 Control of molecular alignment and defect structures of liquid crystal monomers for nano- scale imaging and actuation ... 160
7.2 Outlook ... 162
7.3 References ... 167
xi
LIST OF TABLES
Table (1-1) Dependence of LC orientation on surface tensions ... 10
xii
LIST OF FIGURES
Figure 1.1 Schematic representation of different LC phases. (a) Isotropic. (b) Nematic. (c) Smectic.(d) Cholesteric. The arrows indicate the local LC director. ... 3
Figure 1.2 Chemical structures of two commonly used LCs. (a) 5CB. (b) 8CB. ... 3
Figure 1.3 Schematic illustration of elastic distortions in a nematic LC. (a) Splay. (b) Twist. (c) Bend. Reproduced by permission from literature7. ... 5
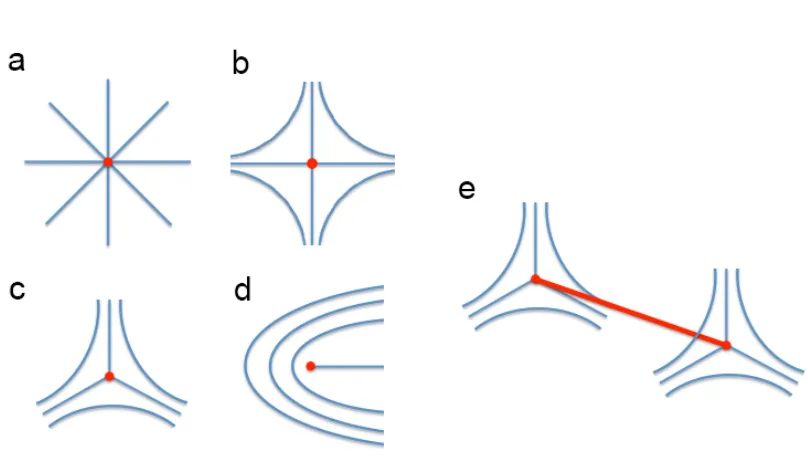
Figure 1.4 Schematic of topological defects in a nematic LC. (a-d) Point defects: (a) +1, (b) -1, (c) –½, (d) +½. (e) –½ line defect. The blue lines represent LC director and the red dots and lines represent LC defects. ... 7
Figure 1.5 Schematic illustration of LC anchoring on a surface. (a) Homeotropic. (b) Planar. (c) Tilted. (d) Representation of LC anchoring on a surface determined by an azimuthal angle φand a zenithal angle θ. ... 9
Figure 1.6 Schematic illustration of LCs on a chemically patterned surface. The blue region indicates homeotropic anchoring for LC, and the green area is random planar anchoring. ... 13
Figure 1.7 Schematic of different types of liquid crystal polymers. (a) Main-chain LCP. (b) Side-chain LCP. (c) Mixed type. The purple rods represent LC mesogens. ... 21
Figure 1.8 Illustration of different responsive LCPs. (a) Thermo-sensitive LCP. A rectangular shaped nematic LCP changes dimensions from x x y to x’ x y’, when heating above nematic-isotropic phase transition temperature. (b) Light-sensitive LCP. Left panel shows the isomerization reaction of azobenzene, and right panel demonstrates the shape transformation of a thin LCP membrane under light irradiation. (c) Electro-sensitive LCP. The schematic demonstrates the shape transformation of a LCP film when switching the electric field. ... 23
Figure 2.1 (a) Schematic detailing the functionalization of AuNRs with polystyrene brushes. (b-c) Extinction spectra of (b) AuNRs in water and (b) PS-AuNRs in chloroform. (d) SEM image of PS-AuNRs. ... 43
xiii
Figure 2.3 POM images of 8CB over homeotropic anchoring epoxy pillar arrays at various temperatures. Pillar dimensions are diameter = 10 µm, spacing = 10 µm, and aspect ratio (height/diameter) = 1.3. The temperature is indicated in the top right corner of each image. Scale bar applies to all figures. ... 46
Figure 2.4 Illustration of LC cell. (a) Schematic of the substrate functionalization; (b) Chemical structure and phase transition temperature of 8CB. ... 47
Figure 2.5 POM images of functionalized gold nanorods in 8CB over homeotropic anchoring epoxy pillar arrays at (a) 35°C (nematic) and (b) 30°C (smectic). White arrow indicates the assembly of gold nanorods. Pillar dimensions are diameter = 10 µm, spacing = 10 µm, and aspect ratio (height/diameter) = 1.3. Scale bar applies to all figures. (c) Extinction spectra of gold nanorods in 8CB over homeotropic anchoring epoxy pillars. The extinction is offset for clarity. Red, blue, and black colors indicate isotropic, nematic, and smectic phase, respectively. (d) Schematic of the gold nanorods assembled side-by-side (top) and end-to-end within the LC defect core. ... 48
Figure 2.6 The defect radius of 8CB in the nematic phase and TLSPR wavelength of the PS-AuNRs over epoxy pillars as a function of temperature. ... 51
Figure 2.7 POM images of functionalized gold nanorods in 8CB over planar anchoring epoxy pillar arrays at (a) 35°C (nematic) and (b) 30°C (smectic). Pillar dimensions are diameter = 10 µm, spacing = 10 µm, and aspect ratio (height/diameter) = 1.3. Scale bar applies to all figures. (c) Extinction spectra of gold nanorods in 8CB over planar anchoring epoxy pillars. The extinction is offset for clarity. Red, blue, and black colors indicate isotropic, nematic, and smectic phase, respectively. (d) The transverse (T) and longitudinal (L) localized surface plasmonic resonance peak (LSPR) position as a function of temperature for both homeotropic and planar cells. ... 52
Figure 2.8 (a) Extinction spectra of PS-AuNRs in 8CB sandwiched between two glass slides with homeotropic anchoring. The extinction is offset for clarity. Red, blue, and black colors indicate isotropic, nematic, and smectic phase, respectively. (b-e) POM images of PS-AuNRs in 8CB in a homeotropic flat cell; the sample is transitioning from the nematic to the smectic phase from b to e. ... 54
Figure 3.1 POM images of LCM_AZO [4-ethoxy-4’-(6-acryloyloxyhexyloxy) azobenzene] and RM257 on various patterned epoxy substrates coated with different surface chemistry. (A) LCM_AZO in PVA coated square array of pores. (B) LCM_AZO between PVA coated square array of pillars. (C) LCM_AZO in DMOAP coated square array of pores. (D) LCM_AZO between DMOAP coated square array of pillars. (E) RM257 in PVA coated square array of pores. (F) RM257 between PVA coated square array of pillars. (G) RM257 in DMOAP coated square array of pores. (H) RM257 between DMOAP coated square array of pillars. Pores in A, C, E, and G: diameter: 10
xiv
oC for LCM_AZO and 130 oC for RM257) to nematic phase (94 oC for LCM_AZO and
125 oC for RM257). Scale bar applied to all figures: 20 µm. ... 68
Figure 3.2 Schematic illustrations of (A) the chemical structures of various liquid crystal monomers, LCM_X1, LCM_X2 and LCM_X3 and (B) random intermolecular dipole-dipole interactions between nitro and carbonyl groups. Different colors represent different functional groups: red for nitro; blue for carbonyl. ... 70
Figure 3.3 Schematic illustrations of the synthesis of the nematic liquid crystal monomers. ... 71
Figure 3.4 1H-NMR spectrum of the liquid crystal monomers (A) LCM_X1; (B) LCM_X2; (C) LCM_X3. ... 73
Figure 3.5 DSC curves of the LCMs. (A) LCM_X1. A nematic phase from 6.5 ºC to 132 ºC (heating) and 136 ºC to 15 ºC (cooling), respectively, was observed. (B) LCM_X2. A nematic phase was only observed upon cooling from 101 ºC to 57 ºC*. (C) LCM_X3. A nematic phase was shown from -9 ºC to 72 ºC (heating) and 77 ºC to -4 ºC (cooling), respectively. ... 74
Figure 3.6 POM and BF images of 5CB and LCM_X1. (A-C): POM and BF images of 5CB (top panels) and LCM_X1 (bottom panels) in (A) porous membranes (diameter: 10
µm, pitch: 15 µm, depth: 20 µm), (B) pillar arrays (diameter: 10 µm, pitch: 20 µm, height: 19 µm), and (C) square channels (width: 10 µm, pitch: 40 µm, depth: 20 µm) with homeotropic anchoring imposed at all surfaces. Insets in A: BF image of LCs in pores where the dark dots at the center showing possible defects; Insets in B: BF image with black circles showing possible bulk line defects circumscribing the pillars; Insets in C: BF image of a single ridge where the gray color indicates a distorted director field but no defect; (D-E) POM images of the schlieren texture of LCM_X1 before (D) and after (E) UV curing. The nearly identical nematic schlieren textures indicate that the LC director field is well-maintained during polymerization. Scale bars, 20 µm applicable to all panels. ... 76
Figure 3.7 POM images of various LCMs on patterned substrates with homeotropic anchoring at the boundaries. (A) LCM_X2 in the square array of pores. (B) LCM_X2 between the square array of pillars. (C) LCM_X3 in the square array of pores. Scale bars: 40µm. Insets: POM images with higher magnification. Scale bars: 10µm. Pores in A&C: diameter: 10 µm, pitch: 15 µm, depth: 20 µm. Pillar arrays in (B): diameter: 10 µm, pitch: 20 µm, height: 19 µm. Samples were fast cooled (~20 oC/min) from isotropic phase (LCM_X2, 110 oC; LCM_X3, 85 oC) to nematic phase (LCM_X2, 90 oC; LCM_X3, 70 oC). ... 77
Figure 3.8 UV-Vis spectra of LCM_X1 before and after UV curing. ... 79
xv
LC can be observed from the orientation of the fracture structures in all three structures; The red dotted lines in A-C represent local director field of LCM mirrored in the other half of images. Scale bars: A: 5 µm; B and C: 2 µm. ... 80
Figure 3.10 Director angle as a function of the radial coordinate r. The points are calculated from the escape configuration shown in the inset (scale bar, 5 µm). The line is calculated from Eq. (3-1). ... 82
Figure 3.11 SEM image of a hybrid wedge cell (left panel), with highlighted angles at the planar and homeotropic surface, and the corresponding measurements of the planar anchoring extrapolation length (right panel) taken from the cell at different cell thicknesses (indicated next to each data point, in microns). Scale bar in SEM image, 10
µm. ... 84
Figure 3.12 SEM images of silica colloids suspended in LCP where either a point defect (A) or a line defect (B) was formed to screen the charge of the colloid. Insets: POM images of point (A) and line (B) defects circumscribing silica colloids. The director field of the LC is represented by the red dotted line and the red crosses show the position of defects. Scale bars: 2 µm ... 86
Figure 3.13 Metastable configurations. (A) POM image of silica colloids suspended in LCM resulting in coexistence of homeotropic and planar-like regions, where the metastable planar regions (blue color) are stabilized by silica colloids. (B, C, E) SEM images characterizing the local director field at different positions in (A) as indicated by the red dotted squares. (B) SEM image taken at the boundary between homeotropic and planar regions of LC, where a bright line in the middle of the image is shown, indicating the presence of a disclination line defect. (C) SEM image of a silica colloid sitting at the boundary. The bright line in the image shows a line defect in the bulk of LC that merged with the Saturn ring defect encircling the colloid. The silica colloid was trapped in the middle of the LC cell, and slightly sank downwards. (D) SEM image of fiber-like structure that shows a bulk disclination line pinned to the bottom surface, as indicated by the bending white line. (E) SEM image of local LC director field inside an escaped region. Horizontally aligned fiber-like fractures indicating planar alignment of LC director field were found in the middle of the image, where the bending fiber-like fractures from top and bottom boundaries merged. Scale bars: A: 20 µm; B-E: 3 µm. ... 88
Figure 3.14 Escaping behavior of LCs in a planar-like region. SEM images of LCP inside a planar region in a homeotropic LC cell. (A) The fracture structure shows stabilization of disclination lines with silica colloids sitting at the two ends of the planar region, and the escaping behavior of LC director from right to left. (B-C) A close look at the director field surrounding the colloid. Scale bars: 5 µm ... 89
xvi
Figure 4.2 (a) Schematic illustrations of the preparation of the PDMS molds with different surface chemistry and the fabrication of LCE pillar array. Pillar dimensions: diameter, 10 µm, pitch (center-to-center distance), 20 µm and height, 40µm. (b) Chemical structures of LC systems used in the experiments. ... 103
Figure 4.3 Average water contact angles on PHEMA coated PDMS exposed to different UV dosages. ... 104
Figure 4.4 POM images of 5CB (a) and LCM4 (b) in a PHEMA porous mold with pore diameter 10 µm, pitch 15 µm, and depth 20 µm. Vertical alignments of LC molecules were observed in both LC systems. Scale bar: 20 µm. ... 105
Figure 4.5 (a) Schematic of the LC disclination line in a mold with homeotropic anchoring. The red dotted line indicates the escape of the LC director, while the red shaded region indicates the width of the escaping configuration, where the director field is uniformly vertical. (b-c) POM images of (b) 5CB and (c) LCM4 under homeotropic anchoring in the PDMS mold. Inset in (b): LC escaping domain indicated by the red circle under cross polarizers when observing the sample from the top under POM. (d) Schematic of the disclination line of 5CB in a PDMS mold treated with planar anchoring chemistry. (e-f) POM images of (e) 5CB and (f) LCM4 in a planar-anchored PDMS mold. ... 106
Figure 4.6 POM image showing polydomain alignment of LCM4 in a non-treated PDMS porous mold. Scale bar: 20 µm ... 106
Figure 4.7 (a-b) Cross-sectional views of POM images of LCM4 pillars after UV curing viewed at (a) 45º and (b) 0º polarization angles. (c-d) Cross-sectional views of BF images of LCM4 pillars at 50oC (c) and 110oC (d). (e) Top-view BF image of LCM4 pillars through a heating and cooling cycle. Blue and Red arrows in (c-e) indicate the position of pillars for measurement of diameter at 50 oC and 110 oC, respectively. Length of arrow: blue-8.6 µm, red-11.1 µm. Scale bar: 20 µm. ... 109
Figure 4.8 Landau-de Gennes numerical modeling of 5CB in a PDMS mold with planar anchoring strength of (a) 7.74x10⁻⁵ J/m2, (b) 7.74x10⁻⁴ J/m2, (c) 7.74x10⁻³ J/m2, and (d) 3.87x10⁻² J/m2. ... 110
Figure 5.1 Design of the 1D channels for LCM alignment. (a) Illustration of LCMs oriented in patterned 1D channels, where LC molecule follows the local orientation of the channel; (b) Representation of a LC molecule within the 1D channel in a Cartesian coordinate. Channel direction is along y-axis; (c) Schematic of the 1D channel fabrication process. A pattern master is first fabricated by photolithography, and then replicated twice to PDMS and epoxy resin (D.E.R. 354), respectively, by soft lithography. (d) Chemical structures of RM82 and epoxy resin (D.E.R. 354). ... 117
xvii
µm. (c) Channels with 2 µm channel width with a “-1” defect. Image is tilted at 45°. (d) Channels with 2 µm feature width with a “+½” defect. Scale bars: 5 µm. ... 122
Figure 5.3 POM images of LC alignment on patterned 1D channels. Left panels: schematics of LCs aligning in different patterns with topological defects marked. Right panels: POM images of (a-b) 5CB and (c-d) RM82 on the corresponding patterned surfaces. Scale bars: (a,c), 200 µm, (b,d), 25 µm. ... 125
Figure 5.4 Actuation of the NLCE film with “+1” and “-1” defect array. (a) Schematic of LC orientation in the LC cell. LC director is twisted by 90° from bottom to top. (b-c) POM images of the NLCE film with parallel (b) and cross (c) polarizers indicated by the arrows in the up right corner. (d-e) Optical images of the LCE films at (d) room temperature and (e) 200 °C. Scale bars: (b-c) 100 µm, (e) 1 mm. ... 127
Figure 5.5 Actuation of NLCE sheet with “+½” and “-½” defect array. (a) Schematic of LC orientation in the LC cell. LC director is parallel from bottom to top. (b-c) Optical images of the NLCE films at (b) room temperature and (c) 200 °C. ... 129
Figure 6.1 Schematic illustration of the design of the chemically patterned surface for controlled LC anchoring. (a) NLC at the boundaries of homeotropic and planar anchoring domains represented by different colors: blue – homeotropic, green – planar, purple rods – LC mesogens. The black arrow represents the LC director (n). A twist configuration of LC alignment at the boundary of homeotropic and planar regions is illustrated. (b) Illustration of the patterned surface with isolated circles. (c) NLC director field on the circular pattern shown in (b). Purple rods represent local LC director and the red dot indicates the “+1” point defect. (d) Illustration of the sample preparation process. Different colors represent different materials: Blue – glass, green – SU8. ... 143
Figure 6.2 POM images of 5CB on chemical patterns prepared from micro-contact printing of SAMs with different DMOAP concentration: (a) 1vol%; (b) 3vol%; (c) 8vol%. Scale bar: 60 µm. ... 144
Figure 6.3 Reaction kinetics of DMOAP with SU8 and glass based on the change of water contract angles over time. (a) Water contact angles of glass and SU8 after different DMOAP treatment time. Insets: optical microscopy (OM) images of water droplets on the sample surface. Green dotted line indicates the optimized DMOAP treatment time (2 min). (b) OM images of water droplets on SU8 (top panel) and glass (bottom panel) after 2 min DMOAP treatment. ... 145
xviii
Figure 6.5 5CB on various chemical patterns. Top panels: designs and SEM images of the patterns.Bottom panels: POM images of 5CB on chemical patterns with shape of (a) square, (b) triplet of circles and (c) quadruplet of circles. Scale bars: top panels – 2 µm, bottom panels – 10 µm. ... 149
Figure 6.6 5CB on arrays of squared checkerboard and connecting rings. (a-b) POM images of 5CB on the squared checkerboard with 0° (a) and 45° (b) cross-polarizer angles, respectively. (c-d) POM images of 5CB on the square array of connecting rings with 45° (c) and 0° (d) cross-polarizer angles, respectively. Insets in (a) & (c) show the schematic of the arrays. Insets in (b) & (d) show the BF images of 5CB with no apparent defects in (b) but tilted defects in (d) appeared as black dots. (e) Schematic illustration of the LC director field surrounding a homeotropic domain. The black lines represent LC director field, and the ret dot shows the “-½” defect. The red and blue curves at the boundary of the chemical pattern illustrate two different LC anchoring configurations: the splay distortion and twist distortion shown in the schematics below. Scale bars: (a-b) 10 µm; (c-d) 40 µm. ... 152
Figure 6.7 (a) BF and (b) POM images of the assembly of silica colloids (diameter of 1 µm) within the topological defects created by 5CB on the square array of circular patterns. The red arrows indicate the trapped colloids by the topological defects of NLC. Scale bar: 20 µm. ... 154
1
CHAPTER 1: Introduction of Liquid Crystals and Liquid Crystal Polymers
1.1 Liquid Crystals
1.1.1 History of Liquid Crystals
Liquid crystal displays (LCDs) are ubiquitous in our daily life. However, few
know that liquid crystal (LC) phases were first discovered back in 1888, much earlier
than the recognition of most nano-materials nowadays and the development of
electronics. In the late 1800’s, Friedrich Reinitzer first observed a liquid crystalline phase
in cholesteryl benzoate that showed two melting points and a cloudy fluid phase while
heated on a hot stage towards clearing temperature1. Later in 1888, Otto Lehmann, a
Germen physicist, concluded that the cloudy fluid phase discovered by Friedrich
Reinitzer was indeed a new phase of matter, and designed it as liquid crystal2.
Nonetheless, research of LCs in the first decades after discovery was slow, in part
because the new material was not well understood and characterized. Little interest was
paid to the new LC material until the 1960’s when the stable cyanobiphenyl LCs were
discovered and the first optical LCDs were demonstrated3. The application of LCs in
LCDs soon led to research in both the fundamental physics of LCs and the chemical
synthesis of new types of LCs. Because of their anisotropy in geometric, thermal, optical,
electrical, and magnetic properties, LCs have not only become the basis of a $100 billion
industry each year, but also intrigued great interests by physicists, chemists, and material
scientists to create ever complex structures, to direct assembly of colloidal particles,
quantum dots, and metallic nanorods,4-9 to create smart materials such as artificial
2
1.1.2 Types of Liquid Crystals and Liquid Crystal Phases
LCs can be considered anisotropic fluids made of rod-like mesogens aligned with
long-range orientational orders. In general, LCs can be categorized as thermotropic and
lyotropic LCs. The phase transition of lyotropic LCs is induced by the change of both
concentration and temperature of LCs in a solvent (typically water), whereas that of
thermotropic LCs is only dependent on temperature. Most contemporary LCDs use
thermotropic LCs3. Figure 1.1 shows several typical LC phases depending on the
ordering of the common orientational direction, called the director n. In the isotropic
phase, LC molecules are randomly orientated without positional order or orientational
order. In the nematic phase, LC molecules exhibit one dimensional ordering but no
positional order, that is LC molecules can translate in any direction without additional
free energy penalty as long as the long axis of LC molecules are roughly aligned parallel
to the local director n. A commonly used nematic LC, 4-cyano-4'-pentylbiphenyl (5CB),
is shown in Figure 1.2. Smectic and cholesteric phases have higher packing symmetries
(see Figure 1.1c-d). LCs in a smectic phase have positional order with a well-defined
layer structure. A classical smectic LC is 4-cyano-4'-octylbiphenyl (8CB). The cholesteric
phase, also referred as the twisted nematic phase, has a continuous twisting of molecules
perpendicular to n between layers. Chirality can be obtained by adding a small amount of
3
Figure 1.1 Schematic representation of different LC phases. (a) Isotropic. (b) Nematic. (c) Smectic.(d) Cholesteric. The arrows indicate the local LC director.
The degree of ordering of LC molecules is usually represented by a dimensionless
factor, the so-called order parameter as
𝑆 =#$ 3𝑐𝑜𝑠$𝜃 − 1 (1-1)
where S is the order parameter, and θ is the angle between the orientation of LC
molecule and the local director n. From Eq. (1-1), one can see for arbitrary orientated
molecules in isotropic phase, S=0, and for perfect alignment in crystals, S=1. In LC
phases, 0 < S < 1, with typical S in between 0.5-0.7 for low symmetry nematic LC phase,
and 0.7-0.9 for high symmetry smectic phases.
4
1.2 Physical properties of liquid crystals
1.2.1 Anisotropy
Anisotropy is the most important and intrinsic properties of LCs. The chemical
structures of LC molecules result in anisotropic intermolecular interactions, leading to LC
phases of different ordering. For instance, the rod-like biphenyl group in 5CB (Figure
1.2) contributes to the shape anisotropy of the molecule. The biphenyl groups are
energetically favored to align in parallel to maximize the translational entropy as a
compensation of the loss of rotational entropy17. The short hydrocarbon tails in the 5CB
disorder the packed biphenyl groups between molecules, thus, lowering the symmetry of
the LC phase and preventing crystallization. The polar cyano group and biphenyl group
in 5CB provide the anisotropic polarizability measured from the ordinary direction versus
the extraordinary direction. Control of LC alignment or their anisotropy plays important
roles in many LC applications. For example, anisotropic dielectric susceptibility of LCs
makes them oriented under an electric field, a phenomenon that underlies the $100 billion
per year LCD industry3. Other anisotropic properties of LCs include birefringence,
anisotropic magnetic susceptibility, anisotropic mechanical properties, viscosity, diffusion
coefficients, and thermal expansion coefficients, leading to applications such as sensors,
actuators, and optical devices18.
1.2.2 Elastic distortion and elastic energy
Naturally, when LC molecules assemble together, they align parallel to maximize
the translational entropy. However, under many circumstances, it requires distortions in
LC alignment to accommodate boundary conditions at interfaces, where LCs interact
5
bend as shown in Figure 1.3. The elastic energy associated with the elastic distortions is
described as Frank-Oseen elastic energy density19
𝑓 =#${𝐾# ∇ ∙ 𝒏 $+ 𝐾
$ 𝒏 ∙ ∇×𝒏 $+ 𝐾4[ 𝒏 ∙ ∇ 𝒏]$} (1-2)
where K1, K2, and K3 are the splay, twist, and bend elastic constants, respectively. The
free energy of local deformation of the director field is proportional to the Frank elastic
constants and to the quadratic order of the appropriate spatial gradient of n. Therefore,
the free energy density of the director field can be described in a more fundamental way
𝑓 =#$𝐾8(∂𝒏;/ ∂𝒔>)$ (1-3)
where i=1, 2, 3 for three elastic constants, respectively, and j and k are integers ranging
from 1 to 3 for expression of the director n in three dimensions.
6
1.2.3 Topological defects and core energy
Topological defects occur when alignment of LC molecules come to a singularity,
as shown in Figure 1.4. Within the topological defects, LC orientation is undefined and
the phase is isotropic. The free energy associated with the topological defects is called
core energy, which is introduced by Landau-de Gennes theory21. The mathematical
expression of core energy in nematic LCs from q tensor Landau theory is
𝐹ABCD = 𝑑𝑉 {[#$𝐴𝑡𝑟(𝑄$) +#4𝐵𝑡𝑟(𝑄4) +#M𝐶(𝑡𝑟(𝑄$))$]} (1-4)
where Fcore is the core energy of defect, A, B and C are constants, and Q is a symmetric
and traceless tensor representing LC molecule orientation. Core energy in the nematic
phase is the free energy that stabilizes the nematic phase against the isotropic phase. So
the physical meaning of core energy indicates the stability of nematic phase; with larger
core energy, the nematic LC phase is more stable.
In a typical LC phase, such as the nematic phase of 5CB, the defect core is ~ 10
nm, comparable with the dimension of many nanomaterials, making it interesting, for
example, to assemble nanoparticles and amphiphiles in the defect core6-9, 22. There are
two major categories of topological defects in the form of points and lines (or
disclinations) shown in Figure 1.4. Depending on the different organizations of LC
molecules surrounding the defect, defects can be divided into different types and
characterized by a pseudo-topological charge number, the winding number. The winding
7
travels counterclockwise around the defect
𝑊 = $QP (1-5)
where θ is the angle that the local director turns around the defect. There are four
classical topological defects in LCs, including +1, -1, +½ and –½ defects shown in Figure
1.4.
Figure 1.4 Schematic of topological defects in a nematic LC. (a-d) Point defects: (a) +1, (b) -1, (c) –½, (d) +½. (e) –½ line defect. The blue lines represent LC director and the red dots and lines represent LC defects.
1.2.4 Surface anchoring and surface anchoring energy
When LCs align on a surface, there is always a specific direction near the surface
that the LC director n follows, which propagates into the bulk to a certain distance,
8
types of alignment for the LC director on a surface: 1) homeotropic anchoring where LC
director is perpendicular to the surface, 2) planar anchoring where LC director is parallel
to the surface, and 3) tilted anchoring where LC director is titled with a zenithal angle θ
between 0º and 90º. The surface that contacts with the LC is usually considered flat at the
microscopic scale, and the orientation of LC on the surface is defined by the azimuthal
angle φ and zenithal angle θ (Figure 1.5). In the case of homeotropic anchoring, θ =
90º. For planar anchoring, there are homogenous alignment and heterogeneous (random
or degenerated) alignment. Homogenous alignment is achieved when LC molecules
orient uniformly in the plane of the surface with a fixed angle φ. Heterogeneous
alignment occurs when LC orientation is not uniformly defined and angle φhas different
values at different points on the surface. In a tilted anchoring, angle θ is constant and
angle φis arbitrary. The minimum free energy orientation direction of LC on a surface is
usually called the “easy axis” of LC alignment. The surface anchoring energy that
deviates from the minimum free energy state is expressed by 23
𝑓R =#
$[𝑊PS𝑠𝑖𝑛$ 𝜃 − 𝜃V + 𝑊WS𝑠𝑖𝑛$ 𝜑 − 𝜑V ] (1-6)
where fs is the surface anchoring energy, θ0and φ0are the zenithal angle and azimuthal
angle of the “easy axis”, respectively, and Wθ0 and Wφ0 are zenithal and azimuthal
anchoring coefficients, respectively, that represent the free energy required for the
9
normally considered strong when fs is on the order of 10-3-10-4 J/m2, and weak for fs~ 10
-5-10-6 J/m2. The alignment of LC molecules in a material is an energetic consequence of
the competition between surface anchoring energy and elastic distortion energy.
Extrapolation length λ is an important parameter to characterize the competition
between surface anchoring energy and elastic energy for a LC confined on a surface,
𝜆 = [Z (1-7)
where K is the average elastic constant of LC, and W is the surface anchoring coefficient.
The physical meaning of extrapolation length is the distance from the surface where LC
director maintains orientation along the “easy axis” 23. In the case of strong anchoring, λ
is typically in the range of 1-10 nm, indicating that LC director coincides with the “easy
axis” close to the anchoring surface.
10
1.3 Anchoring control in nematic liquid crystals
As illustrated above, the molecular orientation and assembly of LC molecules
plays a key role to control its function. For small molecule LCs (e.g. 5CB), the anchoring
can be successfully regulated through various boundary conditions, including surface
chemistry, topology, and topography. In this thesis, anchoring control of nematic LCs will
be discussed in detail.
1.3.1 Surface chemistry
As discussed in Section 1.2.4, when LCs are brought in contact with a surface, the
orientation of LC director near the surface can be aligned homeotropically, planarly or
tilted, driven by the tendency to minimize the energy at the interface. The different
orientational angle is dependent on the surface chemistry or the surface tension of the
substrate, and the anisotropy of the surface tension of the LC24. Simplified surface
anchoring rules are summarized in Table (1-1).
Table (1-1) Dependence of LC orientation on surface tensions
Surface tension LC orientation
1 Δγ > 0, γs < γ⊥;
Δγ < 0, γs > γ⊥;
Homeotropic
2 Δγ > 0, γs > γ‖;
Δγ < 0, γs < γ‖;
Planar
3 γs ∈ [Δγ] Tilted
* γ‖ and γ⊥ are surface tensions of LC parallel and perpendicular to the director, respectively. Δγ = γ‖ -γ⊥ is the anisotropy of the surface tension of LC. And γs is
11
Since different LCs have different surface tensions (γ‖ and γ⊥) and surface
tension anisotropy, LC anchoring on substrates of the same surface tension varies. In the
case of 5CB, it aligns homeotropically on surfaces with low surface tensions, such as
poly(dimethylsiloxane) (PDMS) and dimethyloctadecyl[3-(trimethoxysilyl)propyl]
ammonium chloride (DMOAP) coated surfaces. Planar anchoring of 5CB is usually
obtained on high surface tension substrates, for instance, silica and surfaces coated by
poly(vinyl alcohol) (PVA). Nevertheless, the impact of surface chemistry on the
anchoring of LCs at interfaces is much more complicated than the simplified rules
summarized in Table (1-1). Anisotropic molecular interactions between the LC molecules
and the molecules at the substrate surface is the main driving force to aligning LCs, and
surface tension is simply an apparent parameter to control experimentally. Van de Waals
force, electrostatic interaction, hydrogen bonding, and π-π interaction at the interface
can all contribute to the orientation of LC alignment on a substrate23. So far, due to the
complexity of LC system and the difficulty to precisely measure molecular interactions at
the microscopic scale, only a few LC systems have clearly elucidated mechanisms on the
role of surface chemistry to LC alignment23.
Nevertheless, surface tension and textures are the most commonly used
parameters to direct LC anchoring, and a few methods have been developed to control the
“easy axis” of LCs at interfaces for fine-tuning both θ and φ. For example, rubbing a
velvet cloth on a polymer surface (e.g. polyimide) produces 1D microgrooves to align
LCs with constant φ.10, 11, 25 The polymer chains at the surface can be dragged and
12
mesogens and the aromatic groups in polyimide further enhance anisotropic molecular
interactions between LCs and the substrate. Scratching the surface using an atomic force
microscopy (AFM) tip26, mimicking the rubbing process, can also locally align LCs in
microscale with arbitrary directions.
Photoalignment is another powerful technique to orient LC at interfaces16, 27, 28. A
thin photoalignment layer (typically consisting of azobenzene groups) is coated on the
substrate, followed by exposure to the polarized UV light. Thus, the photosensitive
groups in the photoalignment layer are reoriented either parallel or perpendicularly to the
polarization direction of the UV light. When LCs of interests are cast on the
photoalignment layer, their orientation follows the local orientation of the photoalignment
layer.
Patterning surface chemistry with alternating homeotropic and planar anchoring
regions is another effective method to align LCs29-31 (see Figure 1.6). It allows for more
complex director field patterns. The patterns can be created by top-down methods,
including photo-patterning29, micro-contact printing of self-assembled monolayers
(SAMs)30, 31, and nanoimprint lithography32, 33. The director of LCs on the patterned
surface follows the local surface chemistry and is also controlled by the boundary
conditions created at the border between homeotropic and planar anchoring regions. This
technique largely relies on spatially inhomogeneous surfaces in combination with LC
elastic anisotropy to control the alignment of LCs. At the local region, patterned surfaces
can be either isotropic, which provides an arbitraryφ for LC alignment29, 31, or
13
with patterned surface chemistry can still be aligned uniformly, due to the confinement at
the boundaries and elastic anisotropy of LCs29, 31. As a result of elastic anisotropy in most
nematic LCs, they prefer twist configurations at the boundary between the homeotropic
and planar regions. Within each micro-scale domains, LC molecules are uniformly
aligned. Since fabrication of micropatterns is readily accessible nowadays, chemical
patterning has been considered a promising technique to be applied in practical
applications, e.g., wide-viewing angle LCDs and hybrid diffractive-refractive devices29,
31.
Figure 1.6 Schematic illustration of LCs on a chemically patterned surface. The blue region indicates homeotropic anchoring for LC, and the green area is random planar anchoring.
1.3.2 Topology and topography
Topology of an object is the intrinsic property of the object that is independent of
its size or geometry. It can be preserved under continuous deformation of the object. Two
objects can be considered as topologically equivalent when there is a way to transform
from one to another without cutting or changing the number of holes and handles. For
example, a coffee mug and a donut are topologically equivalent. Colloids in nematic LCs
have been demonstrated to generate three-dimensional (3D) director fields of LCs,
14
34-36. Spherical colloids with homeotropic anchoring boundary condition are the most
widely studied systems in nematic LC to introduce either “hedgehog” point defects or
“Saturn ring” line defects surrounding the colloids. The resulting dipole and quadruple
interactions are in turn used to assemble colloids.4, 5 Other types of topological colloids of
different genus have also been designed and investigated in nematic LCs to test the
Gauss–Bonnet and Poincaré–Hopf index theorems37-39. Theoretically predicted
topological charges carried by the topological defects that are induced by colloids have
been experimentally confirmed as a function of the genus of the topological colloids35, 36.
As opposed to topology, topography of an object comprises surface shape and
features related to size and geometry. It is certainly true that LC anchoring in the near
field on a flat surface has been well understood and LC director field and topological
defects induced by colloid topology have been extensively exploited in recent years. A
comprehensive description of the LC anchoring behaviors on topographical surfaces
remains a complicated matter, especially when the pattern size decreases to nanoscale.40
Although rubbing to control LC alignment has been well adopted since 1960s, the
fundamental mechanism remained unclear for decades25. Berreman41 first established a
theoretical model on LC anchoring on a topographical grooved surface and presented the
resultant elastic distortion energy in 1972. Berreman’s work has since become the
benchmark study of LC alignment guided by the underlying geometrical patterns. For a
long time in experiments, micro- and nano-grooves have been found to show geometrical
constraints on the alignment of nematic LCs10, 11, 25, 40. LCs confined within the planar
anchored grooves align parallel with the groove direction to minimize elastic distortion,
15
relate the observed LC anchoring to the microscopic topography of the interface and to
understand the energetic origin responsible for the orientation of LC alignment. The
surface anchoring energy density for a nematic LC on sinusoidal grooves is sensitive to
both the size and geometry of the groove as 41
𝜌]^_ =Q`bZac ` (1-8)
where ρmax is the maximum free energy density for LCs aligned perpendicular to the
groove direction, K is the average elastic constant of the LC, and A and λ are the
amplitude and wavelength of the groove, respectively. Similarly, Eq. (1-8) can be used to
estimate the free energy density of LCs on one-dimensional (1D) channels fabricated by
top-down techniques.
Different from planar anchoring on a topographical surface, on a surface
topography with homeotropic boundaries, LCs are guided by a “π-like interaction”,
and an anchoring flip of nematic LCs from homeotropic to planar anchoring on 1D
nano-channels has been reported42-44. The anchoring flip40 of LCs is induced by the
competition between surface topography and chemistry in the alignment regions. When
surface corrugation is small, surface chemistry effect is dominant, leading to homeotropic
anchoring of LCs on the 1D channel. At a large surface corrugation, surface topography
becomes dominant, leading to planar anchoring.
Nematic LCs in micro-pillar arrays with homeotropic anchoring have also been
16
encircling the pillars are observed with their size and shape dictated by the micropillars.
Notably, the formation of bulk disclination rings in the homeotropic pillar array is slightly
energetically unfavorable in numerical simulation when compared to the states without
bulk defects. Though the multistability in the micropillar system has not been clearly
documented, those bulk defects have been demonstrated to remotely assemble
microparticles at the LC-air interface through the balance of elastic energy and capillary
energy4.
1.4 Anchoring control for nematic liquid crystal monomers/polymers
Nematic liquid crystal polymers (LCPs) polymerized from liquid crystal
monomers (LCMs) bearing acrylate/methacrylate, alkene, or epoxy45 are of interests for
high-strength fibers, LC optical devices, actuators and sensors10, 45, 46. The functionality
of LCPs is closely related to their internal structures, thus the alignment of LC mesogens.
LCMs often have weaker anchoring strength on surface in comparison with small
molecule LCs. Here, we briefly discuss common techniques to align LCMs, many of
which are different from that to align small molecule LCs.
1.4.1 Rubbing
Rubbing on a polymer surface, typically polyimide, is a classical approach to
align nematic LCMs into monodomains 10, 11. Similar to the concept of aligning small
molecule LCs on the rubbed polymer surface, the molecular orientation of LCMs follows
the rubbing direction. However, this method is much more limited to align nematic LCMs
17
distance smaller than 50µm.
1.4.2 Mechanical stretching or shearing
Mechanical stretching or shearing is commonly used to align LCMs
macroscopically47-50. Mechanical stretching is typically accomplished in two steps. First,
LCMs are slightly polymerized into LC oligomers or weakly crosslinked LCPs so that the
sample is mechanically stable or highly viscous. Next, the bulk sample is mechanically
stretched, typically uniaxially, to align the polymer chains against conformational
entropy, followed by crosslinking to lock the alignment. Alternatively, LC fibers are
drawn from a polymer melt51, 52, or through a more sophisticated electrospinning
process53, 54, followed by immediate crosslinking. It should be noted, however, that LCPs
fabricated by these methods often contain high residual internal stress since LCMs are
partially polymerized in the first step. Consequently, the polymer chains in these LCPs
cannot be interpreted as Gaussian chains, and the macroscopic shape of the crosslinked
LCPs cannot be maintained over a long period of time. To solve the internal stress
problem, a novel approach has been developed by taking advantage of exchangeable
covalent bonds55. In that particular system, the internal stress generated from the change
of the conformational entropy of the polymer chains can be gradually reduced during the
second step stretching, through the reformation of the crosslinking network with a new
polymer chain conformation.
Mechanical shearing of LCMs using confined channels is another way to align
LCMs since the early 1980s56, 57. In the method of micro-molding in capillaries melted
LCMs are drawn to 1D microchannels (5-20 µm) by capillarity58, generating mechanical
18
Shortly after, LCMs are photocrosslinked under UV light. Likewise, LCMs can be
aligned in a micro-fluidic device59. By controlling the flow rate and channel size, a wide
range of LCP particles with variable size and shape can be created, while LCPs made
from a 1D channel are simply fibers. The major advantage of mechanical shearing
methods, compared to mechanical stretching, is that the final LCPs have negligible
internal stress, since pre-polymerization is no longer required, and LCMs can be directly
crosslinked into LCPs.
1.4.3 Electric and magnetic fields
While mechanical stretching and shearing provide anisotropic environments for
LCM alignment, they do not directly orient individual LC molecules. Electric and
magnetic fields, however, can be sued to explicitly align LC mesogens in the direction of
the applied field by taking advantage of the electric and magnetic anisotropy of LC
molecules.
Electric fields are primarily used for LCMs with strong dipole moments, such as
ferroelectric LCs60-62. Typically, LCMs with crosslinking groups are sandwiched between
two indium tin oxide (ITO) glasses, separated by a spacer with a typical thickness of tens
of micrometers. An alternating electric field is then applied to the ITO electrodes to align
LCs until formation of a monodomain. Subsequently, they are UV crosslinked to lock the
LC alignment while maintaining the electric filed.
Strong magnetic field generated by an electromagnet or a rare-earth permanent
magnet, however, is more commonly used to align nematic LCMs, especially in a
microstructured mold63-65 due to their strong diamagnetism. The effect of a magnetic field
19
LC director can orient and reorient along the field direction, given by
𝜉e = Zc
∆ge` (1-9)
where K3 is the bend elastic constant of LC, Δ χ is the anisotropy of magnetic
susceptibility, and H is the magnetic field strength. For a commonly used small molecule
nematic LC such as 5CB, K3 is on the order of 10-11 N and Δχ is typically on the order
10-7.21 So with H~106A/m (~1 Tesla), 5CB with any boundary conditions can be
reoriented on a length scale ξH ~10 nm. Therefore, a strong magnetic field could be
quite effective in aligning 5CB molecules into monodomains within a mold used in soft
lithography. However, a much larger magnetic field is required to fully orient LCMs
within a confinement, which could be due to larger K3 of LCMs or smaller Δχ. Though
the fundamental origin of this phenomenon has not been well-understood, LCPs with
partial monodomain LC orientation have been successfully fabricated by aligning LCMs
in the magnetic fields63-65.
1.4.4 Photoalignment
Though the photoalignment technique was developed in the early 1980s and it has
since been successfully adopted by the LCD industry, its application to LCMs was
realized only recently66-68. The manipulation of LCM alignment using photoalignment
materials is non-trivial, and requires specific LCM systems to satisfy the sensitivity of
material chemistry to the surface alignment layer. Hence, only a few LCM systems have