DOI: 10.14738/abr.58.3598.
Moura, H. J., & Carmona, C. U. M. (2017. Data Loss Risk: A Multivariate Statistical Methodology Proposal. Archives of Business Research, 5(8), 170-178.
Data Loss Risk: A Multivariate Statistical Methodology Proposal
Heber José de Moura
Universidade de Fortaleza, Brazil
Charles Ulises de Montreil Carmona
Universidade de Fortaleza, Brazil
ABSTRACT
Given that an adequate prioritization of data losses (DL) events is crucial for risk management in institutions of any nature, the present paper proposes a methodology aimed at hierarchizing the events associated with this type of risk. This proposal incorporates three specifications : parametric independence, objectivity and applicability. To illustrate , a framework was applied to records of DatalossDB, a US risk database. An hierarchy model based on Conjoint Analysis (CA) was developed by associating DL with industry sector, incident source and incident type variables. The flexibility of CA derives from its ability to use metric or non-metric variables, as well as from the lack of rigid rules regarding the relation between the combination of attributes and the preferences. The procedure determined the importance of the attributes involved and allowed the prioritization of risk events, which will certainly be useful in guiding the actions towards minimizing the problem.
INTRODUCTION
The modeling and assessment of operational risk (OR) has been given significant scholarly attention. Currently, there is a wide range of qualitative and quantitative methods and instruments aimed at the mitigation of OR, and the development of academic papers on the management and mitigation of OR has been on the rise – probably because of the relevance of the financial industry in the global context. For instance, the contributions of researchers such as Cruz (2004), Chernobai, Rachev & Fabozzi (2007), Bühlmann, Shevchenko & Wüthrich (2007), Yasuda (2003) and several others should be cited. However, there is still an issue of concern to institutions and researchers: how to objectively prioritize the processes to be modeled, since they generally constitute a reasonable volume in the company and have different patterns of behavior?
Such an issue becomes even more relevant when we consider that the financial resources directed towards the mitigation of OR are generally limited and large. This aspect makes it even more complex to address this type of risk, which, according to Jobst (2007), cannot be considered a “mere segment of other risks”, but one that tends to have its “own life”.
Reducing corporate risks generally requires the execution of a series of wide-reaching activities aimed at changing processes which are subject to uncertainty. These activities involve internal and external aspects of companies. Thus, given the diversity and complexity of such monitoring, it is necessary to know in detail the source and development of operational risk events (McClave, 1990) and to establish priorities to address them, particularly because of the considerable impact they have on corporate efficiency.
Copyright © Society for Science and Education, United Kingdom 171
responsible for mitigating or even eliminating threats related to the operational processes of the institution.
The method described herein proposes the incorporation of three specifications:
Parametric Independence – As OR encompasses events in the most diverse types originating from several different areas, it is assumed that in most cases it is impossible to model the events through the usual parametric statistical distributions. Therefore, the present proposal is based on the application of nonparametric methods, which allow a greater practical comprehensiveness.
Objectivity- It is necessary to have a formal system for the treatment of OR events. This will prevent the events from being exclusively based on preconceptions about the subject. Nevertheless, the model should allow the integration of data supported by quantitative and subjective metrics, as in the studies by Giudici (2004), Okunev (2005) and Borges & Moura (2010).
Applicability - The methodology should be suitable for different types of sectors, such as industry, governments, medical services, education, and others. In fact, the applicability of the proposal will be proven later on based on the use of a database of real events occurring in different types of sectors.
To illustrate the construction of a framework, a US open database called DataLossDB (OSF, 2014), which has been extensively used by educational, governmental and commercial entities (Gabbay, 2010), was used. This is a free access data structure originated from a research project sponsored by US private entities to document data loss incidents that are reported voluntarily by institutions around the world. The source gathers information about events involving the loss, theft or disclosure of individual and corporate information.
Finally, the need to prioritize risk events is justified by the large investments made by institutions to reduce and control OR. This is particularly true for the public sector and for larger organizations which deal with significant amounts of information and are hence subject to a wide range of threats. The hierarchical methodology proposed in the present study is applicable to practically any sectors. Therefore, it is expected that it will contribute to the planning of activities aimed at mitigating operational risk in general.
METHOD
The framework developed was applied to records of Data Loss (DL) events reported to DatalossDB. Each record refers to a company and contains the following variables: Industry sector , Date of the incident , Incident source , Country and Incident Description , Quantity of information items affected by the incident, Financial , Type of information items affected and Breach type .
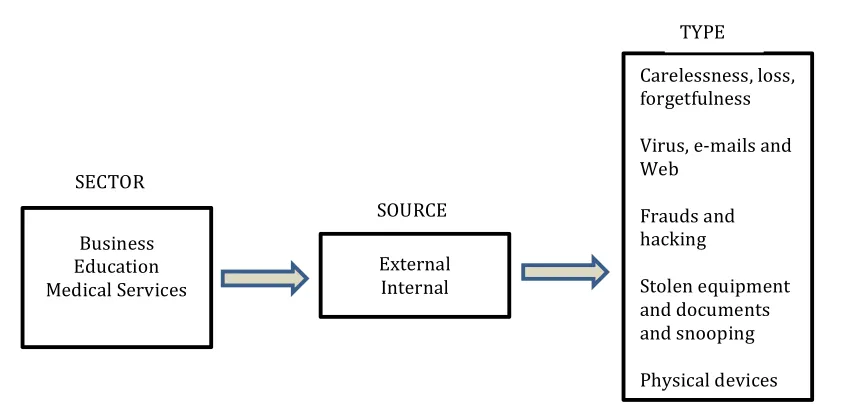
Figure 1. Characterization of DATA LOSS events
An example of an event is the loss of data due to “Frauds and hacking from outside the business sector”. So, we can deduce that the grand total of events for this application is 30 (3 x 2 x 5), which corresponds to a combination of the attributes displayed in the figure.
The instrument adopted for the prioritization of events was the Conjoint Analysis (CA), a multivariate dependence technique used to investigate the hierarchy of preferences among alternatives with several attributes (Fávero, 2009). The method is indicated to analyze conjoint effects that two or more qualitative attributes have on the respondent’s preference (the dependent variable in the model). One of the advantages of using the CA in the present study is that it allows to understand and monitor the process through which the decision-maker makes his preferences (Hair, 2005).
CA assumes that respondents’ preferences are a result of the aggregation of the values of each attribute and can be measured by utilities, which represent the priorities of each combination of attributes (Ribas & Vieira, 2011). In addition to allowing the hierarchization of events, the technique estimates the relative importance of each attribute and can be applied to each respondent or to the entire sample.
The Conjoint Analysis is suitable for understanding respondents’ reactions to various combinations of values associated with each attribute by ranking their preferences , corresponding to dependent variables. The flexibility of the technique derives from its ability to use metric or non-metric dependent variable, as well as from the lack of rigid rules regarding the relation between the combination of attributes and the preferences (Hair, 2005). The CA stands out when compared to other multivariate methods because it allows, first of all, the construction of a set of alternatives combining selected levels of each attribute. Then, the respondent makes his/her choices through the ordinal or interval hierarchization of the alternatives without having to indicate the level of importance of a specific attribute. In fact, the influence of each alternative is generated internally by the CA based on the statistical treatment of all responses , a procedure analogous to discriminant analysis and multiple regression models.
According to the terminology used in CA, the term Factor describes a specific variable, such as
Industry Sector, Incident Source, or Incident Type. The values of each of them are called Levels. In Figure 1, the factors were displayed above the rectangles and the levels inside them.
Business Education Medical Services
External Internal
Carelessness, loss, forgetfulness
Virus, e-mails and Web
Frauds and hacking
Stolen equipment and documents and snooping
Physical devices SECTOR
SOURCE
Copyright © Society for Science and Education, United Kingdom 173
After the characterization of the event and the determination of the sample, this framework requires an experiment in which a risk management specialist should be requested to classify the thirty incidents based on the 6 different criteria listed below. In this phase, the respondent should assign scores from 1 to 100. Higher scores indicate high-risk incidents which require greater attention and priority for their mitigation. The criteria suggested are:
Frequency – the number of times each event took place within a period. It is based on the quantity and not on the magnitude of losses;
Mean– the mean financial loss caused by a particular event. It is based on the arithmetic mean of losses;
Median – the central financial loss disregarding the extreme values. The median is the central value of a data set. It represents the value that divides the distribution into two equal halves.
Severity – the amount of losses. It is the product of the mean loss and the number of times the event took place.
Cost – the estimated expenditure to reduce the mean loss (or the severity) to the lowest level acceptable by the company;
Effectiveness – the maximum reduction of the mean loss (or severity) achieved by using the maximum number of resources acceptable by the institution.
Since CA allows to generate composite criteria from a few basic ones, it is possible to generate other criteria from the initial six. In the present case, the following criteria are suggested.
o Criteria o Observation
{Frequency , median , cost
, effectiveness} o It considers the events and the central losses in addition to the economic rationality of the investment
{Frequency , severity}
o Generally adopted by banks, it assumes the independence between frequency and amount of loss
{Frequency , mean}
o It considers the number of events and the mean loss {Cost , effectivenes}
o It has an economic connotation as it seeks to apply resources more effectively {Frequency , severity , cost
, effectiveness} o It takes into account the events and the magnitude of the loss in addition to the economic rationality of the investment
Figure 2. Composite criteria for classification generated from the basic criteria.
In this case, the model allows to generate 11 groups with 30 events each, where the first 6 correspond to the basic criteria (hierarchized by the respondent) and the remaining 5 are generated directly in the CA by combining the previous ones.
The model can be applied by using the Conjoint Analysis procedure in SPSS, obtaining the following results:
Correlation and significance – the measurement of the degree of adjustment of the model based on the correlation between the results generated by it and a validation sample represented by virtual inputs called holdouts. This sample, likewise the one used in discriminant procedures, is not used in the construction of the utility-generating function; it is only used to compare observed values with the estimated equivalents, thus indicating the precision of the adjustment.
RESULTS AND DISCUSSION
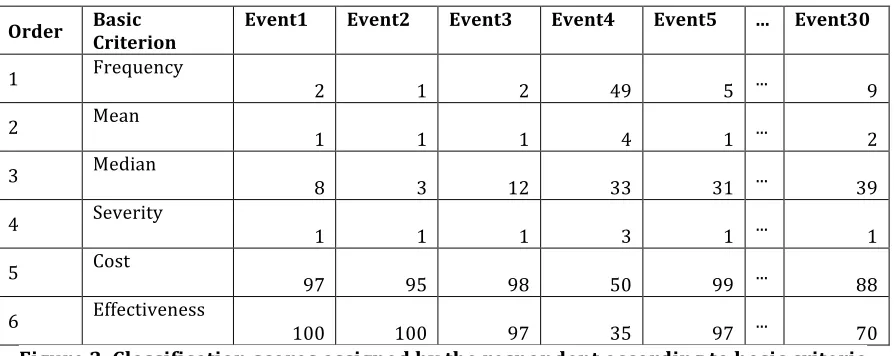
After knowing the set of events, a public sector risk manager was requested to rank the thirty events in order of importance for risk mitigation purposes. The result is summarized in the figure below:
o Order o Basic Criterion o Event1 o Event2 o Event3 o Event4 o Event5 o ... o Event30
o 1 o Frequency 2 1 2 49 o5 ... 9
o 2 o Mean 1 1 1 4 o1 ... 2
o 3 o Median 8 3 12 33 31 o ... 39
o 4 o Severity 1 1 1 3 o1 ... 1
o 5 o Cost 97 95 98 50 99 o ... 88
o 6 o Effectiveness 100 100 97 35 97 o ... 70 Figure 3. Classification scores assigned by the respondent according to basic criteria
The description of the events, shown in the first line of the figure 3, followed the order generated automatically by the CA procedure in SPSS 19.0, where “holdouts” were generated to check on the validity of estimated utilities. In the first line (Frequency), for example, the respondent assigned low importance to the first 3 events and a higher score (49) to event number 4. Regarding the cost and effectiveness of the investments, the respondent assigned major importance to the first 2 events and minor importance to number 4.
Copyright © Society for Science and Education, United Kingdom 175
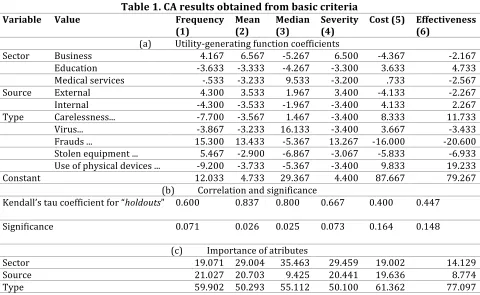
Table 1. CA results obtained from basic criteria
Variable Value Frequency
(1) Mean (2) Median (3) Severity (4) Cost (5) Effectiveness (6)
(a) Utility-generating function coefficients
Sector Business 4.167 6.567 -5.267 6.500 -4.367 -2.167 Education -3.633 -3.333 -4.267 -3.300 3.633 4.733 Medical services -.533 -3.233 9.533 -3.200 .733 -2.567 Source External 4.300 3.533 1.967 3.400 -4.133 -2.267 Internal -4.300 -3.533 -1.967 -3.400 4.133 2.267 Type Carelessness... -7.700 -3.567 1.467 -3.400 8.333 11.733 Virus... -3.867 -3.233 16.133 -3.400 3.667 -3.433 Frauds ... 15.300 13.433 -5.367 13.267 -16.000 -20.600 Stolen equipment ... 5.467 -2.900 -6.867 -3.067 -5.833 -6.933 Use of physical devices ... -9.200 -3.733 -5.367 -3.400 9.833 19.233 Constant 12.033 4.733 29.367 4.400 87.667 79.267
(b) Correlation and significance
Kendall’s tau coefficient for “holdouts” 0.600 0.837 0.800 0.667 0.400 0.447
Significance 0.071 0.026 0.025 0.073 0.164 0.148
(c) Importance of atributes
Sector 19.071 29.004 35.463 29.459 19.002 14.129 Source 21.027 20.703 9.425 20.441 19.636 8.774 Type 59.902 50.293 55.112 50.100 61.362 77.097
The resulting utilities are based on the values that make up the event. Considering, for example, the “Frequency” criterion, the utility of the “Business-Outside-Fraud…” event is calculated as 4.167 + 4.300 + 15.300 + 12.033, resulting in 35.8, which corresponds to the priority assigned by the decision maker to that particular event. The utilities of the other events are calculated the same way. It is possible to know the importance that the attribute (level) has for the user: the higher the score, the greater the importance of the attribute. Still about the “Frequency” criterion, it is observed that the incident type “Fraud…” was the most important, with a score of 15.3. It is also possible to know the importance of each factor associated with DL events. Part (c) shows that the Incident type (with weight 59.9) was the indicator that best served to guide the user’s choices.
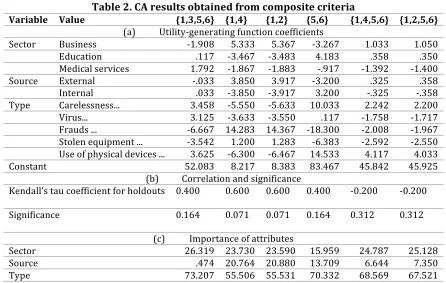
Table 2. CA results obtained from composite criteria
Variable Value {1,3,5,6} {1,4} {1,2} {5,6} {1,4,5,6} {1,2,5,6}
(a) Utility-generating function coefficients
Sector Business -1.908 5.333 5.367 -3.267 1.033 1.050 Education .117 -3.467 -3.483 4.183 .358 .350 Medical services 1.792 -1.867 -1.883 -.917 -1.392 -1.400 Source External -.033 3.850 3.917 -3.200 .325 .358 Internal .033 -3.850 -3.917 3.200 -.325 -.358 Type Carelessness... 3.458 -5.550 -5.633 10.033 2.242 2.200 Virus... 3.125 -3.633 -3.550 .117 -1.758 -1.717 Frauds ... -6.667 14.283 14.367 -18.300 -2.008 -1.967 Stolen equipment ... -3.542 1.200 1.283 -6.383 -2.592 -2.550 Use of physical devices ... 3.625 -6.300 -6.467 14.533 4.117 4.033 Constant 52.083 8.217 8.383 83.467 45.842 45.925
(b) Correlation and significance
Kendall’s tau coefficient for holdouts 0.400 0.600 0.600 0.400 -0.200 -0.200
Significance 0.164 0.071 0.071 0.164 0.312 0.312
(c) Importance of attributes
Sector 26.319 23.730 23.590 15.959 24.787 25.128 Source .474 20.764 20.880 13.709 6.644 7.350 Type 73.207 55.506 55.531 70.332 68.569 67.521
Considering the number of the basic criteria, the representation {1,3,5,6}, for example, corresponds to the criterion composed simultaneously of Frequency, Mean, Cost and
Effectiveness. The other representations follow the same logic.
The results also show the measurement of the degree of adjustment of the model by calculating the correlation between the generated results and the validation sample, which is represented by the “holdouts”. This sample, likewise in discriminant analysis procedures, was not used to build the model, but to indicate the accuracy of the adjustment.
With regard to the basic criteria, it was observed that, apart from “Cost” and “Effectiveness”, all the other criteria presented correlations above 60% and significance below 10%. As for the composite criteria presented in Table 2, the correlations and significance fell short of those associated with the basic criteria.
This may be explained by the fact that composite criteria are generated by a greater number of simultaneous perceptions, which makes it difficult to form a single function that suits the logic resulting from these choices and gives rise to inconsistencies which are difficult to be understood by the model. Naturally, the use of a single basic criterion leads the user to make his/her choices with the least degree of inconsistency.
However, the inconsistencies resulting from the choices are already foreseen by most of the methods that deal with the understanding of this type of information, such as the Analytic Hierarchy Process (AHP) (Goodwin & Wright, 2004), which even calculates an inconsistency indicator for respondents’ choices.
Copyright © Society for Science and Education, United Kingdom 177
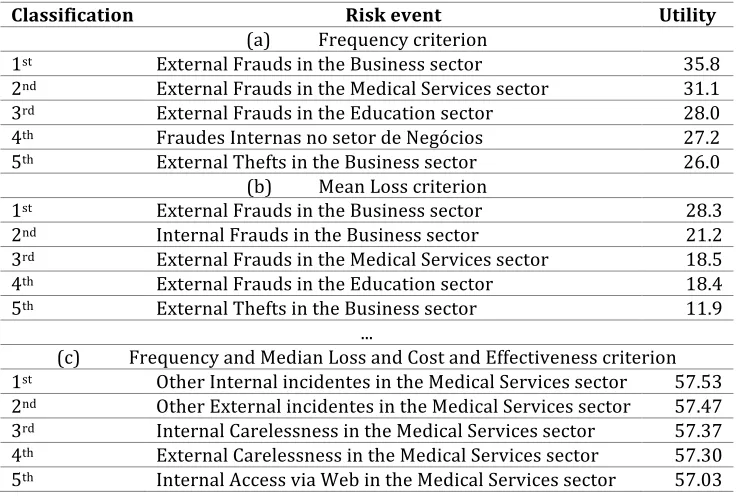
Table 3 . Hierarchization of risk events in the first 5 positions according to all classification criteria
Classification Risk event Utility
(a) Frequency criterion
1st External Frauds in the Business sector 35.8 2nd External Frauds in the Medical Services sector 31.1 3rd External Frauds in the Education sector 28.0 4th Fraudes Internas no setor de Negócios 27.2 5th External Thefts in the Business sector 26.0
(b) Mean Loss criterion
1st External Frauds in the Business sector 28.3 2nd Internal Frauds in the Business sector 21.2 3rd External Frauds in the Medical Services sector 18.5 4th External Frauds in the Education sector 18.4 5th External Thefts in the Business sector 11.9
...
(c) Frequency and Median Loss and Cost and Effectiveness criterion 1st Other Internal incidentes in the Medical Services sector 57.53 2nd Other External incidentes in the Medical Services sector 57.47 3rd Internal Carelessness in the Medical Services sector 57.37 4th External Carelessness in the Medical Services sector 57.30 5th Internal Access via Web in the Medical Services sector 57.03
This last table shows the hierarchization of the events obtained by the application of CA and represents the final result made possible by the proposed methodology, which was the objective of present study.
CONCLUSION
The feasibility of the proposal was confirmed by the use of the DatalossDB database, which allowed the grouping of records on data breaches by different industry sectors, types of information breached, financial losses and other variables taken into account.
In the Conjoint Analysis, the decision-maker was requested to classify, in an ordinal ranking, the previously formatted risk events. After that, the procedure determined the importance of the attributes involved and allowed the prioritization of risk events using multiple criteria, which was the purpose of the study.
Another relevant aspect is the possibility of quantifying the importance that levels and factors related to data breaches have for those in charge of risk management, which will certainly be useful in guiding their actions towards minimizing the problem.
Finally, it is worth noting that although data loss has been used as inspiration for the development of the proposed model, this framework can be adapted to other risk events for which there is interest in prioritizing.
References
Borges, J., F., Moura, H.,J,.(2010) Integração entre abordagens qualitativa e quantitativa para a mitigação do risco operacional: estudo no Banco Central do Brasil. Anais do ENANPAD 2010. Encontro da ANPAD, Rio de Janeiro. Bühlmann, H., Shevchenko, P., V., Wüthrich, M.,V.,(2007) A "Toy" Model for Operational Risk Quantification using Credibility Theory. The Journal of Operational Risk, v. 2, n. 1, p. 3-20.
Chernobai, A.,S., Rachev, S.,T.,Fabozzi, F.,J. (2007) Operational risk : a guide to Basel II capital requirements, models and analysis. New Jersey : John Wiley & Sons.
Cruz, M . (2004) Operational risk modeling and analysis. London : Incisive financial publishing ltd.
decisões. São Paulo, SP: Elsevier
Gabbay, A.,M.(2010) Simulação de Monte Carlo para Mensuração do Risco Operacional: Aplicação do Modelo LDA,
Dissertação de mestrado. Universidade Presbiteriana Mackenzie São Paulo.
Giudici, P. (2004) Integration of Qualitative and Quantitative Operational Risk Data: A bayesian approach. In: Cruz, M (editor). Operational Risk Modelling and Analysis: theory and practice. p. 131-138. London: Risk Books.
Goodwin, P., Wright, G.(2004) Decision Analysis for Management Judgment, 3rd ed, London : John Wiley & Sons Ltd.
Hair Jr, J., Anderson, R., E.,Tatham, R., L., Black, W.,C. (2005) Análise multivariada de dados, 5a edição, Porto Alegre: Artmed.
Jobst, A. ,A. (2007) Consistent Quantitative Operational Risk Measurement and Regulation: challenges of model specification, data collection and loss reporting. IMF Working Paper, November.
McClave, J.,T.,Benson, P.,G. (1990) Statistics for business and economics. Canada: Maxwell Macmillan International Edition.
Okunev, P. (2005). Simple approach to combining internal and external operational loss data in social science research network (Workpaper). Lawrence Berkeley National Laboratory
OSF Open Security Foundation (2014). DataLossDB [data file]. Retrieved from http://datalossdb.org.