Published online January 30, 2015 (http://www.sciencepublishinggroup.com/j/ijnfs) doi: 10.11648/j.ijnfs.20150401.17
ISSN: 2327-2694 (Print); ISSN: 2327-2716 (Online)
Optimization of GSH extraction technology from
germinating soybean using response surface methodology
Guifeng Li
*, Limin Dong, Junli Xu
Department of Food Science and Engineering of Shanxi Normal University, Linfen, China
Email address:
[email protected] (Guifeng Li)
To cite this article:
Guifeng Li, Limin Dong, Junli Xu. Optimization of GSH Extraction Technology from Germinating Soybean Using Response Surface Methodology. International Journal of Nutrition and Food Sciences. Vol. 4, No. 1, 2015, pp. 45-50. doi: 10.11648/j.ijnfs.20150401.17
Abstract:
In order to establish optimal water extraction technology of GSH from soybean, response surface method, based on Box–Behnken design, was used to optimize extraction conditions. Crude GSH including in protein was separated by Sephadex G-50 chromatography method. A second order quadratic mathematical model for GSH in soybean extraction was established. Its validity was verified, and the alternate action of the above three factors and their optimum level ranges were investigated. Results showed that the optimum conditions to achieve the maximum extraction rate were as follows: pH of extraction liquid 7.62, extraction temperature 71.91℃, and extraction time 135.67min. Under such conditions, extraction rate of GSH reaches 1.063%(the relative error 1.1%), which was well matched with the predicted yield.
Keywords:
Soybean, GSH, Extraction Technology, Molecular Weight, RSM1. Introduction
The glutathione is a low-molecular-weight thiol tripeptide constituted by glutamate (Glu), cysteine (Cys), and glycine. The glutathione exists either in a reduced form (i.e. GSH) with a free thiol group or in an oxidized form (i.e. GSSH) with a disulfide between two identical molecules. GSSH has no biological activity [1]. The presence of chemical reactivity and high water solubility of the thiol (-SH) group of GSH confer its biological properties and make it a crucial metabolite to perform multiple functions including growth, development and plant responses modulation under varied environment [2]. These functions include the storage and transport of Cys, leukotriene and prostaglandins biosynthesis, maintenance of protein structure and function, and the regulation of enzyme activity through the reduction of disulfide bonds [3]. Meanwhile,its primary function appears to be in the
maintenance of intracellular redox homeostasis by affording protection against reactive oxygen (ROS) and nitrogen species as well as electrophilic xenobiotics[4]. GSH plays key roles in many cellular metabolic processes, such as protection biological membrane, antioxidant, anti-aging, anti-cancer, anti radiation, detoxification, scavenging free radicals, regulation of replication and transcription gene, regulating cell growth, and maintaining the normal function of cell. So GSH has already aroused broad attention in biology, medicine, health
care, and food science [5].
GSH is widely existed in nature, such as animal liver, blood, yeast, wheat germ and plant tissue. Soybean is one of the major crops in China. Germinating soybeans are rich in GSH. So there is important academic significance and application value, to carry out research on extracting and purifying GSH from germinating soybeans.
2. Materials and Methods
2.1. Materials and Reagents
Soybeans were purchased from a local supermarket. All the reagents were of analytical grade. GSH was purchased from were obtained from Dingguo biological technology Co., Beijing, China. 2-nitro-benzoic-acid (DNTB) was obtained
from Jinsui biological technology Co., Shanghai, China. The water used throughout the experiments was double distilled.
2.2. Sample Preparation and Extraction of GSH
The samples were prepared by immersing 1kg of dry soybeans in 1000mL water for 24h, and then germinating for 5 days. The germinating soybeans were vacuum dried at 65℃for 48 h to yield a stable moisture content of less than 8%.
The dehydrated products were then finely milled by high speed grinder to about 40 mesh, and stored at a desiccator at room temperature (20 ± 5℃) until used
[6]
2.3. Extraction and Determination of GSH
The dried samples (5.000 g) were extracted for GSH by solvent extraction with different pH value (3, 4, 5, 6, 7 and 8) with a ratio of solid–liquid (g/ml) (ranging from 1:5 to 1:40) for a given time(extraction time ranging from 30 to 180 min), while the temperature of the water bath ranged from 30℃ to
90℃and was kept steady by the water-bath (within±1.0℃).
The extracts were added to a defined volume by water (100 ml) and then been filtered. The filtrate was concentrated to 5 ml, and the products were separated by Sephadex G-50 column chromatography to obtain GSH (relative molecular weight 307).
The content of GSH was measured by DTNB method ([7, 8,
9]
). The extraction yield was calculated as the following formula:
The extraction yield (%) = The GSH content of extraction (g)
/The weight of germinating soybeans powder (g) × 100% (1)
2.4. Experimental Design and Statistical Analysis
Previous trials showed that extraction pH, extraction temperature, and extraction time might significantly affect the extraction yield of GSH. Response surface methodology (RSM) was applied to optimise the extraction parameters of GSH[10]. A Box–Behnken design of Design-Expert 7.0 was used to evaluate the relevance of the three independent variables extraction pH (X1), extraction temperature (X2), and
extraction time (X3) on the yield of GSH (Y) [11]. The
independent variables were coded at five levels (-1, 0, and 1), and the complete design consisted of 17 experimental points including four replications of the centre points (all variables were coded as zero).The single factor experimental data became the guiding factors for establishing the range to be used for the factors in the experiments. In detail, extraction pH (6.0, 7.0, and 8.0), extraction temperature (60, 70, and 80℃),
and extraction time (110, 140, and 170min) were investigated. The coded and corresponding factors and levels of the independent variables used in the RSM design are listed in Table 1. Design-Expert software (trial version 7.0, Stat-Ease Inc., Minneapolis, USA) was used for multiple regression analysis (R 2), analysis of variance (ANOVA), and numerical optimisation in the response surface regression (RSREG) procedure.
Table 1. Independent variables and their levels of RSM design.
Independent variables Factor level
-1 0 1
Extraction pH 6.0 7.0 8.0
Extraction temperature (℃) 60 70 80
Extraction time (min) 110 140 170
Experimental data were fitted to a second-order polynomial model and regression coefficients were obtained. The model proposed for the response surface analysis of the Y variable as a function of the independent variables is stated by the following second degree polynomial equation:
3 3 3 3
2 0
=1 =1 =1 = +1
+ +
i i ii i ij i j i i j i
Y=β +
∑
βX∑
β X∑ ∑
β X Xi
(2)
Where Y is the response, β0 is the constant coefficient, βi are
the linear coefficients, βii are the quadratic coefficients, βijare the interaction coefficients, and Xi and Xjare the coded values of the independent variables. Design-Expert software (version 7.0) was utilised to analyse the statistical characteristics of the data and to develop a regression equation between process variables and extraction yield.
According to the experimental data, the fitting model represented by equation (2) was constructed and the statistical significance of the model terms was examined by regression analysis and analysis of variance (ANOVA). The practical yield was obtained under the optimal conditions. According to the analysis of variance, the effect and regression coefficients (R2) of individual linear, quadratic and interaction terms were
determined. The regression coefficients were then used to make statistical calculation to generate dimensional and contour maps from the regression models.
3. Results and Discussion
3.1. Single Factor Analysis Method
Powdered samples of 5.000 ± 0.005 g were used for the solvent extraction of GSH with different solid–liquid ratio. The solid–liquid ratio in this experiment included 1:5, 1:10, 1:15, 1:20, 1:25, 1:30, 1:35 and 1:40. The processes were carried out at 70℃ for 120min. The extracts were diluted to
100 ml by water and then filtered. Total extract yield could be determined according the methods above. The results were shown: There was a significant increase in the extraction yield of GSH with increasing ratios of solid–liquid ratio from 1:5 to 1:20, and then decreased. Therefore, the optimal solid–liquid ratio should be 1:20.
Powdered samples of 5.000 ± 0.005 g were used for the solvent extraction of GSH with different temperature. This experiment was carried out respectively at 30, 40, 50, 60, 70, 80 and 90℃for 120min, and the optimal solid–liquid ratio was
1:20. The extracts were diluted to 100 ml by water and then filtered. Total extract yield could be determined according the methods above. The results were shown that the extraction yields started to increase with increasing temperature, and reached a maximum at 70℃ followed by a small decrease with
further increases in temperature. What’s more, a higher temperature might cause loss of activities and increase the solubility of impurities. Taking into account these factors, the optimal temperature was 70℃.
Powdered samples of 5.000 ± 0.005 g were used for the solvent extraction of GSH with different time. This experiment was carried out respectively for 30, 60, 90, 120, 150 and 180 min at 70℃, and the solid–liquid ratio was 1:20.
extraction time was 120 min.
The pH value can affect GSH activity and isoelectric point. Powdered samples of 5.000 ± 0.005 g were used for the solvent extraction of GSH with different pH value. This experiment was carried out respectively for pH value 3, 4, 5, 6, 7 and 8 at 70℃ for 120min, and the optimal solid–liquid ratio
was 1:20. The extracts were diluted to 100 ml by water and then filtered. Total extract yield could be determined according the methods above. The results were shown that the extract yield significantly increased with the increase of extraction pH value 3 to 7, and reached a maximum at pH value 7, followed by a small decrease with pH value increases. Therefore, the optimal pH value was 7.
3.2. Response Surface Modelling
The study utilized RSM to develop a prediction model for optimizing the extraction conditions of GSH , which
conducted under 17 experimental conditions for the optimum value of extraction pH, extraction temperature and extraction time. The experimental conditions and the corresponding response values from the RSM design were showed in Table 2. The independent and dependent variables were analysed to obtain a regression equation that could predict the response within the given range. The coefficients in the equation were showed in Table 3. The regression equation for extraction of GSH was as follows:
Table 2. Design program and experimental results of RSM.
Test number pH value (X1) Temperature / ℃℃℃℃ (X2) Time / min (X3) Extraction rate of GSH / % (Y)
1 0 0 0 1.063
2 1 -1 0 0.568
3 1 0 1 0.715
4 1 0 -1 0.787
5 0 0 0 0.989
6 0 1 1 0.815
7 0 0 0 1.019
8 -1 -1 0 0.745
9 0 0 0 1.049
10 0 0 0 1.010
11 0 1 -1 0.804
12 -1 1 0 0.672
13 1 1 0 0.732
14 0 -1 -1 0.803
15 -1 0 -1 0.681
16 0 -1 1 0.723
17 -1 0 1 0.752
Table 3. Variance analysis of GSH extraction rate experiment.
0 Sum of squares df Mean square F value P-value
Model 0.35 9 0.039 33.19 0.0001 significant
X1 0.0003 1 0.0003 0.25 0.6292
X2 0.0041 1 0.0041 3.43 0.1063
X3 0.0006 1 0.0006 0.49 0.5052
X1X2 0.0140 1 0.014 12.02 0.0105
X1X3 0.0051 1 0.0051 4.32 0.0763
X2X3 0.0019 1 0.0019 1.65 0.2398
X12 0.17 1 0.17 143.12 0.0001
X22 0.0091 1 0.091 77.16 0.0001
X32 0.0036 1 0.036 30.31 0.0009
Residual 0.0082 7 0.0012
Lack of Fit 0.0034 3 0.0016 1.93 0.2670 not significant
Pure Error 0.0003 4 0.0008
Cor Total 0.36 16
There was a direct reflection from the absolute value of different coefficient in the equation above that the linear terms of temperature, two quadratic terms (pH and temperature) and interaction terms were the major contributing factors to the extraction technology of GSH from soybean. It was evident that the loss of quasi inspection of the regression equation is of no significance (P=0.2670), which indicated that the interference came from uncertainty factors to test results was very small. The fitting test is highly significant (P<0.001). For the model fitted, the coefficient of determination (R2) was
0.9771 for the polynomial model. That is, the regression equation can be used to predict the variation of each parameter influencing the extraction of GSH.
3.3. Response Surface Analysis and Process Optimization
Respectively fixing one of the three factors at zero,the
3-dimensional response surface and contour map were schematized as in Fig.1~3. Thus we can determine the
optimal factor levels through analysing and evaluating the interactive influence of any two factors to the rate of extraction of GSH.
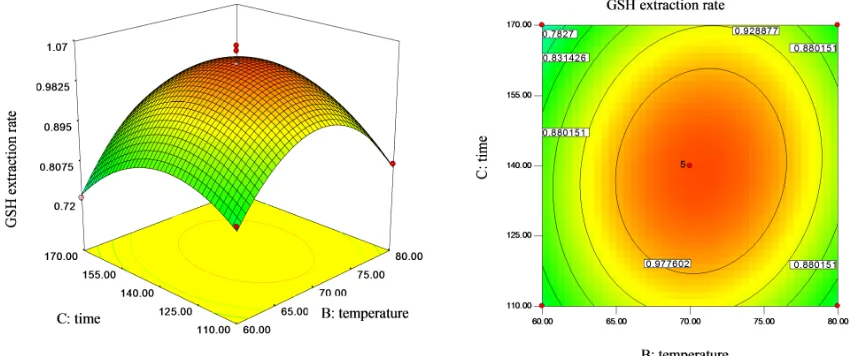
With reference to Fig.1, it is obvious that the extraction
yield of GSH is affected faintly (insignificantly) by the interplay of extraction temperature and extraction pH, among which there is an evident quadratic parabola relationship. When the pH was in a low value, the higher the pH was, the more the required extraction yield became, then it decreased with an increase of the pH value after reaching to the maximum point when the pH was 7.6. The temperature ,whose change point is 71.9℃, exert an influence on the extraction
yield of GSH in the similar way as the pH does.
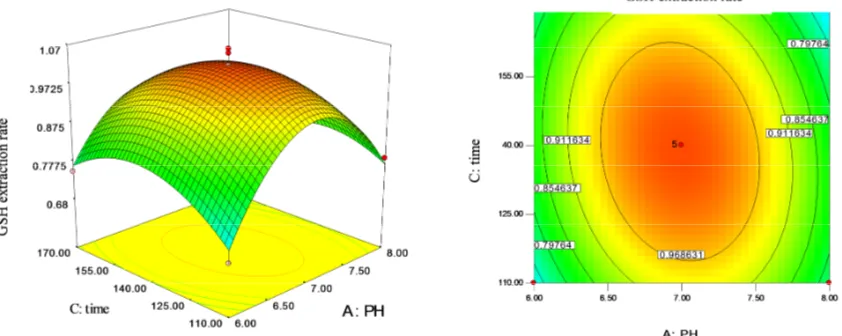
According to Fig. 2, we can see a significant influence on the extraction of GSH from the mutual effect of extraction time and the pH value of the solution. At the experimental level range, time has little effect on extraction yield, while the pH did more. The extraction of GSH first increased and then decreased, which reached the maximum point when pH was 7.6.
According to Fig.3, the mutual effects of extraction temperature and time displayed a remarkable effect on the response. Similarly, the extraction rate of GSH increased gradually along with the temperature rising until up to 71.9 ℃,
at which the extraction yield of GSH was in the maximum. Also, we can conclude that it was temperature rather than extraction time influenced the yield more efficiently.
Fig. 1. Response surfaces and contour lines of extraction temperature and extraction liquid pH of soybean.
Fig. 3. Response surfaces and contour lines of extraction temperature and time of soybean.
3.4. The Determination of Optimum Extraction Conditions and Test Validation
Within the scope of the selected factors which based on the above–mentioned experiments, the regression model and Design-Expert software (version 7.0) were utilised to analyse and determinate the Test parameters. The optimum conditions of extraction pH, extraction temperature, and extraction time were 7.62, 135.67min, and 71.91℃, respectively. On this
condition, the predicted yield(Y) was 1.063%.
In order to verify the predicted conditions, we repeated the experiment 3 times with optimum process conditions obtained from the model. The results showed that the average extraction yield of GSH in soybean was 1.049%, which was
almost identical to predicted value(relative error was 1.1%),
indicating that the developed model could adequately represent the real relationship among the parameters chosen. (The polynomial model was fitting well with the actual situation.) Therefore, it was very effective to adopt RSM experiments to optimize the extraction technology of GSH from germinating soybean.
4. Conclusions
1) Using the response surface optimization design, the quadratic multinomial regression model of extraction of GSH from soybean has been well established:
Y=1.03–0.0061X1+0.022X2–0.0085X3+0.059X1X2–0.036X1X3+0.022X2X3–0.20X12–0.15X22–0.092X32
From the model fitted, the loss of quasi inspection was not significant (P=0.2670), the fitting test was very significant (P<0.001), and the correction coefficient of determination R2 was 0.9771, indicating that the model was good enough to predict the change rule of exaction yield of GSH in relation to each parameter.
2) Through the analysis of the Design Expert Software, the optimum conditions of GSH extraction were obtained as follows: pH 7.62, extraction time 135.67 min, extraction temperature 71.91℃, under which conditions, a maximum
response of 1.063%GSH was predicted.
References
[1] Sarvajeet SG., Naser AA., Mirza H., Ritu G., Dipesh KT., Iqbal A., Eduarda P., Narendra T.. Glutathione and glutathione reductase: A boon in disguise for plant abiotic stress defense operations. Plant Physiology and Biochemistry, 70, 2013, pp. 204-212. DOI 10. 1016/j. ppb. 2013. 05. 032.
[2] Noctor, AG., Mhamdi S., Chaouch Y., Han Y., Neukermans J., Queval G.. Glutathione in plants: an integrated overview, Plant Cell Environ. 35, 2012, pp. 454-484. DOI 10. 1111/j. pce. 2011. 02. 400.
[3] Danyelle M., Townsend, Kenneth DT., Haim T.. The importance of glutathione in human disease [J]. Biomedicine & Pharmacotherapy, 57, 2003, pp. 145-155. DOI 10. 1016/j. bp. 2003. 03. 043.
[4] Queval, A. Mhamdi, S. Chaouch, C H (2011) Glutathione, vol. 9, The Arabidopsis Book/American Society of Plant Biologists. [5] Hossein S., Mohammad MN., Hossein VD., Shakeri M., Towhidi A., Shahneh AZ., Zhandi, M.. Effect of glutathione in soybean lecithin-based semen extender on goat semen quality after freeze-thawing [J]. Small ruminant research, 112, 2012, pp. 123-127. DOI 10. 1016/j. srr. 2012. 12. 015.
[6] Xu YY., Cai SS., Wu HC., Yu j.. Optimization on ultrasonic extraction of phytosterols from soybean by response surface methodology. Food Research and Development, 35, 2014, pp. 36-39. DOI 10. 3969/j. frd. 2014. 09. 09.
[7] Xu LP., Yang CH., Wang X.. Condition optimization of extracting glutathione from Corn germ by response surface methodology. Journal of the Chinese Cereals and Oils Association, 25, 2010, pp. 15-18. DOI 10.1074/j. jccoa. 2010. 05. 0015.
[9] Wei GY., Li Y., Du GG., Chen J.. Effects of dissolved oxygen and pH on candida utilis batch fermentation of glutathione. Chinese Journal of Biotechnology, 19, 2003, pp. 734-739.DOI 10. 3061/j. cjb. 2003. 06. 0734.
[10] Li GF., Zhao GJ., Xiao CL., Liu XH.. Optimization of Enzymolysis Technology of Flammulina velutipes proteins and evaluation of Peptides antibacterial activity. Journal of Chinese
Institute of Food Science and Technology, 12, 2012, pp. 108-114. DOI 10. 7848/j. jcifst. 2012. 10. 0107.