Integration Of Contract For Difference In The
Minimization Of Energy Cost Of A Distribution
Utility
Dindo T. Ani
Batangas State University, Electrical and Computer Engineering Department Alangilan, Batangas City, Philippines, PH-0063 950 394 5795
Abstract: High cost of electricity makes it important for the distribution utilities (DUs) to allocate their energy requirements in the least cost manner. In the current Philippine set-up, energy requirements of DUs are allocated in spot market and bilateral contract. Given the volatility of the WESM (Wholesale Electricity Spot Market) prices and that the bilateral contract price may be either higher or lower than the WESM price; the contract for difference (CFD) provides an alternative for the bilateral contract. This study developed a methodology for scheduling the economic purchase of energy that yield to lower purchase cost of DU. The methodology includes forecasting the nodal load and spot market price, and energy allocation optimization. Results showed that the optimization engine was able to generate an optimal set of energy allocations and that the integration of CFD yield to a reduction of purchase cost of DU which in turn reduced the cost of electricity for consumers.
Keywords: Contract for Difference, Distribution Utility, Energy Allocation, Forecasting, Optimization
1.
Introduction
The price of electricity can be split into major costs in generation, transmission, and distribution. Around 40% to 60% of the electricity cost can be attributed to the generation cost [8]. High generation charge can be attributed, among other factors, to the tight power supply and demand conditions. One of the major annual supply events that dampen the level of supply is during Malampaya maintenance outages. The Malampaya power facility fuels three natural gas-fired power stations (Sta. Rita, San Lorenzo, and Ilijan) with a total generating capacity of 2700 MW to provide 40 – 45% of Luzon power generation requirements [1]. With its annual maintenance shutdown, those three gas-fired facilities are either unavailable or prompted to use more expensive alternative fuels to ensure adequate and stable power supply throughout the shutdown period. Either way, generation costs are sure to significantly increase as evidenced in the past years. Ultimately, this increase in cost will be passed on to the end-consumers. As further evidence, Luzon consumers experienced high cost of electricity on the later part of 2013 and 2014 as reflected on the consumers’ electricity bills. With the expected shutdown of the Malampaya facility in the summer of 2015, along with the tight power supply and demand condition, high price of electricity is expected [6]. Increase in electricity cost is due to increase in generation cost. This generation cost consists of spot market transactions and bilateral contract transactions. The allocation of energy purchase is an important task for the DU in order to effectively achieve the least cost of electricity. Allocating all of the energy requirements to the spot market may result to either a high price of electricity for its consumers or a lost opportunity to achieve lower cost given the volatility of WESM prices. Bilateral contracts are hedging mechanisms that protect the customers from such volatility or uncertainty. The lost opportunity to achieve lower cost in the spot market can be exemplified where the bilateral contract price may possibly be either lower or higher than the spot market price. Such scenarios are also applicable to generation companies as well [1], [2], [4], [7]. In order to provide hedging mechanisms for
were not covered. Only data available in the WESM’s
official website were used in the study. Other data that are confidential were not included.
2.
Methodology
The study on the cost impact of the integration of contract for difference (CFD) in the energy allocation optimization of distribution utility consists of three major parts. The first part is the forecasting of the spot market price or the LWAP (load-weighted average price). The second part is the forecasting of the nodal load demand. Both the forecasting of spot market price and nodal load used multiple linear regression method. These forecasted price and demand will be used as an input to the optimization engine. The third part is the optimization of energy allocation. The Microsoft Excel Solver was used as the optimization engine in the energy allocation problem. The Data Analysis Module of Excel was used as a tool in the multiple linear regression method of forecasting the hourly nodal load demands and the hourly spot market prices (LWAP).
2.1 Forecasting Spot Market Prices (LWAP)
The multiple linear regression method is used in the forecasting of spot market prices for the period August 1 – 31. The market data used for the statistical model were WESM data from January 9 – July 31. The regression model comprised of the spot market price as the dependent variable, while the nodal load, nodal price, real-time ex-post price (RTX), GWAP, rolling average, and hour of the day are the independent variables. The equation shown below illustrates the regression model used.
( ) ( )
( ) ( ) ( )
( ) (1)
where:
β1 = coefficient of the nodal load
β2 = coefficient of the nodal price
β3 = coefficient of the RTX
β4 = coefficient of the GWAP
β5 = coefficient of the Rolling Average
β6 = coefficient of the Hour of the day
2.2 Forecasting Demand (Nodal) Load
The multiple linear regression method is used in the forecasting of nodal load demand for the period August 1 – 31. The market data used for the statistical model were WESM data from January 9 – July 31. The regression model comprised of the nodal load as the dependent variable, while the previous hour nodal load and the week nodal load were the independent variables. The equation shown below illustrates the regression model used.
( ) ( ) ( ) ( ) (2)
where:
β1 = coefficient of the previous hour nodal load
β2 = coefficient of the previous week nodal load
β3 = coefficient of the difference of previous week nodal load
β4 = coefficient of hour of the day
prev_hour = nodal load of the previous hour prev_week = nodal load of the previous week
del_prev_week = the difference of previous week nodal load hour = the hour of the day
2.3 Optimization Model Formulation
The model shown in equation 3 is the optimization model of total energy purchase cost of a distribution utility which considers the spot market transactions, bilateral contract transactions, and contract for difference (CFD) transactions.
The total DU cost is given by
( ) (3)
where:
SM cost = total spot market cost BC cost = total bilateral contract cost CFD cost = total contract for difference cost
For spot market transactions, the DU pays the spot market the amount equal to the spot market quantity times the spot market price given by the equation
∑ ∑ ( ) (4)
where:
SMQi,j = spot market quantity for ith hour of jth day
LWAPi,j = spot market price for ith hour of jth day
For bilateral contract transactions of DU, applies the following mechanism:
a. If the bilateral contract price is less than the spot market price, the DU pays the spot market the amount equal to the spot market price times the bilateral contract quantity given by the equation
If BCP < LWAP,
∑ ∑ ( ) (5)
b. If the bilateral contract price is greater than the spot market price, the DU pays the spot market the amount equal to the spot market price times the bilateral contract quantity. In addition, the DU pays the Generation Company (GENCO) an additional cost equivalent to the difference of these two prices times the quantity agreed in the contract given by the equation
If BCP > LWAP,
∑ ∑ (( ) ( )) (6)
where:
BCQi,j = bilateral contract quantity for ith hour of jth day
BCPi,j = bilateral contract price for ith hour of jth day
a. If the contract for difference price is greater than the spot
market price, the DU pays the spot market the amount equal to the spot market price times the CFD quantity. In addition, the DU pays the GENCO the difference between these two prices times the quantity agreed in the contract given by the equation
If CFDP > LWAP,
∑ ∑ (( ) ( | |)) (7)
b. If the contract for difference price is greater than the spot market price, the DU pays the spot market the amount equal to the spot market price times the CFD quantity. In addition, the GENCO pays the DU the difference between these two prices times the quantity agreed in the contract given by the equation
If CFDP < LWAP,
∑ ∑ (( ) ( | |)) (8)
where:
CFDQi,j = contract for difference quantity for ith hour of jth
day
CFDPi,j = contract for difference price for ith hour of jth day
N = number of hours in one day M = number of days in one month
2.4 Building the Optimization Engine
The procedures for optimal energy allocation are the following:
1. The result of the forecasting procedure for the hourly spot market price (LWAP) and hourly demand nodal load (NL) will be used as the input for the optimization model. Assumptions of other pertinent data such as bilateral contract price and contract for difference price will also be included.
2. The Excel Solver is modeled using the optimization model for optimal allocation of energy transactions as given in equation 3. The Solver parameters are:
a. Objective Cell - The value of DU cost for the optimization model should be minimized.
b. Variable Cells - The values of SMQ, BCQ and CFDQ are the variables in the optimization model depending on the test case scenario.
c. Constrained Cell - The constraints of the optimization vary depending on the test case scenarios.
3.
Results and Discussion
This section discusses the results of the implemented methodology of the study. It comprised of the results on the forecasting of the nodal load (NL) and spot market price (LWAP), as well as the optimization engine results tested with different test case scenarios.
3.1 Spot Market Price (LWAP) Forecasting
The following graph shows the results of LWAP forecasting using the final regression model.
Figure 1: Forecast Hourly LWAP (spot market price)
As illustrated in table 1, there was very little discrepancy between the actual and forecast value of LWAP. The error ranges from as low as 0.01% to as high as 1381.18% and from Php0.19 to Php25,698.16; although with MAPE of 61.91%, given the volatility of the LWAP, the accuracy of the forecast is highly acceptable.
Table 1. Accuracy of LWAP (spot market price) forecasting
3.2 Nodal Load Forecasting
The following graph shows the results of Nodal Load forecasting using the final regression model.
Figure 2: Forecast Hourly Nodal Load
As illustrated in table 2, there is very little discrepancy between the actual and forecast value of nodal load. The error ranges from as low as 0.03% to as high as 250.1% and from 0.012 MW to 33.322 MW; and with MAPE of 13.16%, the accuracy of the forecast is highly acceptable.
Table 2. Accuracy of nodal load forecasting
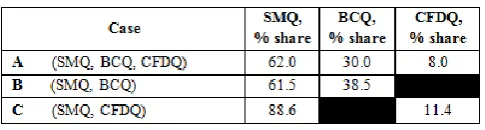
3.3 Optimal Energy Allocation
the existing condition on the distribution utilities wherein the
energy requirement is allocated in the spot market and bilateral contract. Cases A and C showed where CFD was integrated in the energy allocation optimization. Spot market quantity (SMQ) had the biggest share in the energy allocation for all three cases.
Table 3. Optimal energy allocation
3.4 Cost impact of the integration of CFD The three cases used in this study are:
Case A (SMQ, BCQ and CFDQ) - This case considers the distribution utility’s allocation of energy requirements in the spot market, bilateral contract and contract for difference.
Case B (SMQ and BCQ) - This case considers the distribution utility’s allocation of energy requirements in the spot market and bilateral contract.
Case C (SMQ and CFDQ) - This case considers the distribution utility’s allocation of energy requirements in the spot market and contract for difference.
Based on the results as shown in table 4, Case C had the lowest DU cost among the three cases. There was 40.09% reduction in DU cost when BCQ was replaced by CFDQ. Furthermore, there was corresponding 13.31% reduction in DU cost when CFDQ was added to SMQ and BCQ as venue of energy allocation. Both cases, C and A, considered contract for difference (CFD) in the energy allocation of DU. As can be seen, the case which considered the CFD had lower cost than the case without CFD.
Table 4. Energy cost of the three cases
3.4 Over-contracting
In order to determine the effects of over-contracting on the optimization, three case scenarios were used:
Case 1 – This is the base case wherein the DU’s energy allocations are in spot market, bilateral contract and contract for difference without over-contracting on BCQ and CFDQ.
Case 2 – This is the case wherein up to 10% over-contracting is allowed each for BCQ and CFDQ. The negative value for SMQ is allowed to cater for the over-contracting.
Case 3 – This is the case wherein up to 20% over-contracting is allowed each for BCQ and CFDQ. The negative value for SMQ is allowed to cater for the over-contracting.
As shown on table 5, there is 8.77% reduction in DU cost as effect of 10% over-contracting on BCQ and CFDQ. Likewise, there is 10.97% reduction in DU cost as effect of 20% over-contracting on BCQ and CFDQ. In general, the higher the rate of over-contracting, the higher is the DU cost reduction.
Table 5.Effects of over-contracting
3.5 Minimum BCQ variations
In order to determine the effects of the variations on minimum off-take for BCQ on the optimization, three case scenarios were used:
Case 1 – This is the base case wherein the DU’s energy allocations are in spot market, bilateral contract and contract for difference with minimum allocation of 30% for BCQ.
Case 2 – The same as case 1 but with 50% minimum BCQ off-take.
Case 3 – The same as case 1 but with 80% minimum BCQ off-take.
As shown on table 6, there is 20.6% increase in DU cost as effect of increasing the minimum off-take for BCQ from 30% to 50%. Likewise, there is 52.3% increase in DU cost as effect of increasing the minimum off-take for BCQ for 30% to 80%. In general, the higher the rate of minimum off-take for BCQ, the higher is the DU cost.
Table 6. Effects of variations in minimum BCQ
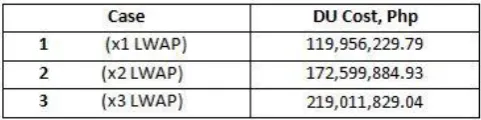
3.6 Spot Market Price (LWAP) Variations
In order to determine the effects of the variations of LWAP on the optimization, three cases were used:
Case 1 – This is the base case wherein the DU’s energy allocations are in spot market, bilateral contract and contract for difference using the LWAP of August 1 – 31
Case 2 – This is the case wherein the LWAP used is twice the LWAP of Case 1.
Case 3 – This is the case wherein the LWAP used is thrice the LWAP of Case 1.
Table 7. Effects of spot market price (LWAP) variations
3.7 CFD Price Variations
In order to determine the effects of the variations of CFD Prices on the optimization, three cases were used:
Case 1 – This is the base case wherein the DU’s energy allocations are in spot market, bilateral contract and contract for difference using the NPC effective rate for August 2015 as the CFDP.
Case 2 – This is the case wherein the CFDP used is half the CFDP of Case 1.
Case 3 – This is the case wherein the CFDP used is twice the CFDP of Case 1.
As shown on table 8, there is 10.1% reduction in DU cost as effect of reducing the CFD price. Likewise, there is 9.1% increase in DU cost as effect of doubling the CFD price. In general, the lower the CFDP, the lower is the DU cost.
Table 8. Effects of CFD prices variations
4.
Conclusion and Recommendations
This study was able to develop a mechanism that would generate an optimal set of allocation on demand requirements of distribution utility in spot market, bilateral contract, and contract for difference in a cost effective manner. The mechanism includes the forecasting of nodal load and spot market prices (LWAP) and the optimization of energy allocation. The results of the forecasting were the input to the optimization engine which made the forecasting as equally important as the optimization itself. The forecasting of nodal load and spot market price used the multiple linear regression method. Proper selection of the independent variables was important to come up with the best regression model to produce less forecast error. The optimization engine developed was able to generate an optimal set of demand energy requirements of distribution utility with the least cost. The integration of CFD in the energy allocation reduced the DU’s purchase cost, as evidenced by the results of different test case scenarios. Results showed that having CFD in the energy allocation was more cost effective than having bilateral contract alone. Another important aspect is that there is greater cost reduction when over-contracting of CFD is allowed. In the case of minimum BCQ variations, the lower the rate of minimum off-take for BCQ, the lower is the DU cost. The price of CFD also has an impact in the cost reduction
mechanism. The lower the CFD price, the greater is the savings on the part of DU. The spot market price (LWAP) variations also have effects on the DU cost. The lower the LWAP values mean, the lower is the DU cost. Overall, this study revealed that CFD is an alternative venue for energy transactions of DUs to replace bilateral contract. With the high cost of electricity, distribution utility has to manage the allocation of energy requirements in the most economical manner. In the current Philippines set-up, the DUs usually resort to bilateral contract in hedging the volatility of spot market price. However, bilateral contract price may end up either higher or lower than the spot market price. In this case, hedging might not be effective. The contract for difference (CFD), as another venue of electricity transaction, can be an alternative to the bilateral contract as shown in the results of the study. Furthermore, the DUs have to consider various aspects of contract negotiation such as over-contracting of CFD, lowering the minimum off-take for BCQ, and lowering the prices of CFD and LWAP. This study focuses only on the demand side, with the assumptions of bilateral contract price and contract for difference price, it is recommended to further study the cost impact of the CFD on the generation side. Furthermore, it is interesting to further study on the effects of CFD in the contract negotiation process between the distribution company and the generation company. Moreover, it is recommended to further study on other factors that may affect the allocation optimization such as taxes, financial derivatives, regulatory aspects and trading of CFDs.
References
[1] Jimenez, M. B. J., Optimal Allocation of Spot Market and Bilateral Contract Transactions through Quantity Declaration Adjustments. IEEE Transactions, 2013
[2] Khatib, S. and F. Galiana, Negotiating Bilateral Contracts in Electricity Markets. IEEE Transactions on Power Systems, Vol. 22, No. 2., 2007
[3] Kirschen, D. and G. Strbac, Fundamentals of Power System Economics. John Wiley & Sons, Ltd. United Kingdom, 2004
[4] Knezevic, G., S. Nikolovski, and P. Maric, Electricity Spot Market Simulation Involving Bilateral Contracts Hedging. 8th International Conference on the European Energy Market (EEM), Zagreb, Croatia, 2011
[5] Kristiansen, T., Pricing of Contract for Difference in the Nordic Market. IEEE Transactions on Power Systems, undated
[6] Lectura, L., Malampaya Shutdown to Hike April-May Rates. Business Mirror, Manila, Philippines, 2015
[7] Palamarchuk, S., Bilateral Contract Correction and Cancellation in the Competitive Electricity Markets. IEEE Bucharest Power Tech Conference, Bucharest, Romania, 2011