making process
Vaclav Talhofer
a, *, Šárka Hošková-Mayerová
ba University of Defence in Brno, Department of Military Geography and Meteorology, Czech Republic, [email protected] b University of Defence in Brno, Department of Mathematics and Physics, Czech Republic, [email protected]
* Corresponding author
Abstract: Multi-criterial analysis is becoming one of the main methods for evaluation of influence of geographic environment on human activity, or human activity on geographic environment, respectively. Analysis results are often used in command and control systems, especially in armed forces and units of rescue systems. For analyses, digital geographic data - whose quality significantly influences the reached results - are used. Visualization of results of analyses in command and control systems are usually thematic layers over raster images of topographic maps. That is why this visualization must correspond to cartographic principles used for the creation of thematic maps. The article presents problems that an analyst encounters within the evaluation of the quality of the used data, performance of the analysis itself as well as preparation of data files for their transfer and publishing in command and control systems.
Keywords: spatial data quality, multi-criterial analysis, thematic maps, command and control system
1. Introduction
Current command and control systems (C2S) used in armed forces or units of rescue systems are mainly based on the technologies of information and communication systems. For the needs of decision making there are implemented also procedures that use digital geographic data (DGD) as the main source for localization of subjects as well as objects of a crisis situation in area where this situation is taking place. However, DGD are used as a source of information for modelling the impacts of current or supposed phenomena on the complete situation, for projecting of future intentions, for their planning, etc. In all cases it is necessary to have the knowledge about the used DGD and about the influence of this quality on the complete decision making process (Talhofer, Hošková-Mayerová, & Hofmann, 2018). Commanders and staff may within the decision making process follow the lead of their own intuition (intuitive processes) for which they do not need detailed analytical data. In cases of bigger actions solved on larger spaces, however, they cannot go without structured decision-making processes that are based on standard operational procedures (processes) and on the principles of their use (Aringhieri, Carello, & Morale, 2016), (D´Amico, Di Martino, & Sessa, 2013). Decision making processes in C2S are above all structured processes. From the point of view of procedures, they often use the methods of multi-criterial analysis (MCA). This is also true for procedures which analyze influences of geographic environment on the conducted activity, or in cases when influences of the conducted activity on the geographic environment are analyzed. (Maliene, 2011), (Malczewski, 1999).
In order to carry out such analyses it is necessary to have corresponding DGD that enable the subjects of decision-making processes (commanders and staff) to evaluate the influence of geographic environment on fulfilling the tasks. In general, it is an evaluation of factors of geographic environment, i.e. evaluation of influence of partial components of this environment on the conducted activity and subsequently evaluation of the complete influence of the environment. For these analyses there are available general tools for work with DGD that are integrated in large program systems, e.g. ArcGIS (Esri, 2013). Partial analyses of the individual factors as well as the complete analysis may be utilized as process models whose output are raster files in which the value of a raster cell is a classified influence of a partial factor or all factors on the given activity. Such raster files are usually called a cost map.
The whole process of MCA is significantly influenced by the quality of data that are used. This is certainly true for DGD as well. Both the analyst who performs MCA as well as the user (commander, staff) must get the information about the extent of quality of the used data and how the quality influences the resulting cost map. If the questions about the quality of the input data are not taken into account in the solution of a crisis situation, the result of their analyses may be used uncritically (even incorrectly) and the decision made based on such analysis may have negative consequences for the solution of the above mentioned crisis situation.
identification of units in area, etc. In case of creation of cost maps, it is necessary to apply also cartographic principles for thematic maps (even though in this case for virtual environment).
2. Multi-criterial analysis in decision making process
Multi-criterial analysis is a general tool which takes into consideration various points of view of the given problem (Fiala, Jablonsky, & Manas, 1997). These points of view are looked at using factors that have an influence on the complete state of the product or activity. The factors may be both measurable (dimensions, weight, speed, etc.) as well as immeasurable or difficult to classify which are difficult to value, e.g. state of the environment, customer’s satisfaction, etc. In order to make it possible to work with both measurable as well as immeasurable factors, these factors are expressed with the help of criteria.
Criteria may be quantitative which are usually expressed in natural scales, or qualitative for which a suitable scale is introduced, e.g. classification scale or scales such as: very high-high-average-low-very low, and at the same time the direction of better evaluation is defined, i.e. whether maximal or minimal value is better, i.e. decreasing or increasing values.
Conventional techniques of multi-criterial decision making are considered to be non-spatial in such a sense that they assume spatial homogeneity within the studied area. This assumption is unreal for many cases because the evaluation criteria change in space.
Spatial multi-criterial decision making analysis then represents a significant deviation from a conventional multi-criterial decision making analysis due to the absence of a spatial component. Spatial multi-criterial decision making analysis requires data corresponding to the evaluation criteria as well as geographic location of alternatives. Data are processed with the help of GIS tools and also with the help of multi-criterial decision making. Spatial multi-criterial decision making analysis may be considered to be a process that combines and modifies geographical data into a resulting decision which is visualized usually in the form of raster files in which the value of each pixel corresponds to the resulting value of multi-criterial analysis. These values are often called as cost and the complete raster file is then called a cost map.
The methods of multi-criterial analysis are used in the preparation of support materials for decision making, in preparation and controlling of operations of units that move in a real terrain, e.g. rescue units of the Integrated Rescue System. Results of such analyses are then placed into C2S. If C2S is based on information and communication technologies (ICT), then also the results of MCA are transferred into C2S in an electronic form within on-line or also off-line connection.
The resulting cost map can be projected separately on a display in a given C2S, but usually it is consider as a thematic layer displayed on a raster image of a
topographic map and then the cartographic rules for thematic mapping must be accepted (Buttenfield & McMaster, 1991), (Kovarik & Marsa, 2014).
2.1 Application of multi-criterial analysis for solution of a concrete geographic problem
So that it was possible to evaluate the influence of quality of DGD on the result of a multi-criterial analysis, the authors chose perhaps a very simple example which, however, comes from a real situation. This model example will be used to show one of the possible ways of evaluating quality of DGD and work with this quality. The task of the model example will be a search for a suitable location for deployment of a support center for units in action during a crisis situation of a large extent. For many activities when solving crisis situations in terrain it is necessary to have a base for units in action at disposal that supports them. Geographical problem is to suggest suitable places in the given area where it would be possible to locate the mentioned support center in such a way so that in the given area this base was functional and configuration of terrain would not limit it at all, or limit them to an acceptable extent. The following text will describe in detail the steps when solving this model example.
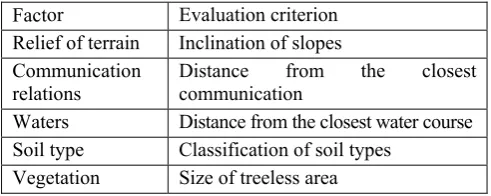
The aim of the solution was to search for places that meet conditions for the given space. These conditions are for instance the minimal size of the area for deployment of elements of the support center, maximal incline of slopes, corresponding distance from communications, bodies of water as well as places of solution of a crisis situation, etc. First of all, it was necessary to understand the factors that influence the complete solution of the problem and arrange these factors into a clear structure. For the individual factors it was then necessary to choose evaluation criteria and set weights to them. In the given example, the selection of a suitable location was influenced especially by the factor of terrain relief, its surface, communication conditions, vegetation cover, hydrological conditions and the distribution of places of crisis situations that were the subject of the solution (Hofmann, Hoskova-Mayerova, Talhofer, & Kovarik, 2015), (Rybansky & Vala, 2010). The given model example required the chosen space to be in a relatively flat terrain, on a suitable soil type that would be sufficiently endurable even after raining, within the reach of communication, in a treeless countryside and in a safe distance from water courses. The individual factors were evaluated by measurable or classifiable criteria. The following criteria may be used in the given example (Table 1):
Factor Evaluation criterion
Relief of terrain Inclination of slopes Communication
relations Distance from the closest communication Waters Distance from the closest water course Soil type Classification of soil types
Vegetation Size of treeless area
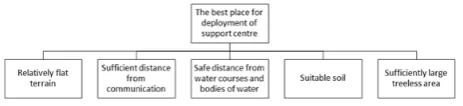
When solving a real situation, also interactions between the individual factors must be looked for. In this simplified example, however, it was not necessary to evaluate the mutual relations between the individual factors because the individual factors are independent on each other and their influence on the solution of the problem may be determined separately. That is the reason why it was possible to express the complete hierarchy of conditions of the solution of the process in the form of a hierarchical scheme (Figure 1).
Figure 1. Hierarchy of conditions of process scheme
In the next phase, suitable input data (usually in vector, raster or TIN format) that enable to set the influence of the individual factors with the help of evaluation criteria were looked for. For evaluation criteria the minimal values of criteria for positive evaluation of the given factor in the whole model of solution of the given problem were established. Thereafter it was possible to solve the individual factors one by one.
The factor of terrain relief resembles in the requirement for relatively small inclination of relief. In order to find such localities, it was necessary to create a map of inclination of relief. The process model then contained a calculation of inclination of slopes where the input data layer was a digital elevation model.
The second factor dealt with the distance of communications from the potential places of deployment of a support center. It is important for the support center to be – if possible – within the reach of communication network and vehicles move on an unpaved surface as little as possible. That is why it was necessary to create a map of distances to the nearest communication, where the communication network was the input data layer.
The third factor dealt with a safe distance from water sources. The location of the support center brings the danger of pollution of waters with oil and other dangerous substances. That was the reason why the next step was to create a map of distance from surface water sources. The model contained the process of calculation of distances to water sources for which the layer of waters was the input data layer.
The fourth factor considered the soil type. It was necessary to decide what soil from the point of view of soil type was suitable for an activity in the given area. A digital soil map containing soil types was the input data. The last factor dealt with the influence of vegetation, especially forest covers. For the deployment of a support center, it is ideal to find – if possible – a continuous treeless area with given minimal dimensions and space. A map of treeless areas with their size was created in this step, the layer of vegetation was used as the input data. Based on the given analysis of facts and criteria of their evaluation, it was possible to create a process scheme that
contains basic conditions, as well as input data, processes and outcomes, as seen in (Figure 2).
Figure 2. Scheme of process model of selection of a suitable place for deployment of support facilities
In order to consider that some factors are more significant for the final solution than others, it is necessary to set weights of the individual factors. For the model example, setting of percent significance and normalized weights of the evaluation criteria are given in the table (Table 2).
Factor Evaluation criterion Impact of factor in % Relief of terrain Inclination of slope 13 Communication Distance from the
closest communication 42
Waters Distance from the
closest water course 21 Soil type Code of soil type 8 Vegetation Size of treeless area 16
Table 2. Weights of factors and evaluation criteria
The model example used the basic digital geographic data model DMU25 (vector model) as the basic positional model with a typical accuracy of position of objects of 5 meters (MoD-GeoS, 2010), elevation model DMR4 (typical height accuracy is 0.3 meters) (CUZK, 2010) and soil database (SD - vector model, typical accuracy of position is 100 meters) (Novák, 2000). The whole analysis was performed on an area east of Brno, Czech Republic, whose dimensions were 13×13 kilometers. The phase of analyzing dealt with the selection of suitable tools for partial analyses of influence of the individual factors and for evaluation of the total influence of all factors. Furthermore, it dealt with a classification of obtained information so that it was possible to classify this information in a unified evaluation scale.
With the help of suitable tools, entry layers for the analysis were created, as shown in the process scheme in the picture (Figure 2). The ArcGIS 10.4 was used as an appropriate software for all analyses (Esri, 2013). For the analysis of suitability of soil, the code of soil type from the soil database (Novák, 2000) was used. It gives classification of soil types according to the first two columns of the table (Table 4).
vegetation type given according to the first two columns in the table (Table 3).
It is obvious that values of pixels in all input layers are given by the method of their transformation into a raster file and thus all gained raster files had pixels of dimensions of 5x5m. Furthermore, it was necessary to set the utilization of these values from the point of view of their influence on the complete analysis. One of the ways how to reach the goal is to assign number values into classes in each map layer, i.e. reclassify them.
The values of pixels of each layer were divided depending on the level of suitability for the given purpose. The division was done in a way that the original values were put into ten classes where numbers 1 10 become new values of the individual pixels.
Number 10 represented the best value and number 1 on the contrary – its worst value. According to the characteristics of raster files, either the method of automated or manual scaling was chosen.
Automated scaling was used for continuously changing values, in this case for Euclidean distances or inclination of slopes, while for setting the interval limits the method of natural breaks (inclination of slopes) or method of fixed intervals (Euclidean distances) was used.
Manual scaling was chosen in a case when enumeration (nominal) values were used in the classification. In the model example from the point of view of vegetation type, there were suitable places without vegetation, acceptable places were pastures and meadows, possibly also scrubs. Forest covers including forest nurseries, orchards and vineyards were considered to be unsuitable. These values were implemented into the table (Table 3).
Similarly, also reclassification according to suitability of the raster file of soil types was done with the use of table (Table 4).
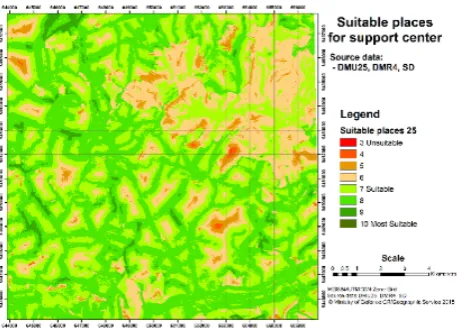
Pixels of layers prepared in such a way have the same influence on the result and they differ only internally by their value. However, as the individual evaluation criteria have various weights (Table 2), it is necessary to consider these weights also in the final multi-criterial analysis. The resulting file, so-called cost map, was created by the combination of partial reclassified files. The tool of weighted overlay was used for the calculations. The final result of the process model is shown in the picture (Figure 3).
The cost map enables to evaluate the level of suitability of the pre-selected area for the deployment of a support center. The final decision about the deployment of the center is now in the hands of the responsible worker (for instance commander) who in such case may even undergo an acceptable risk, i.e. that the given space will not be optimal but that the deployed units will be able to perform their activities even though they might be limited by this environment. As the complete procedure of analysis is usually created by a formation of a geo-process model, it is possible to deliberately modify the input conditions, obtain several results and decide which result will be used in the real conditions.
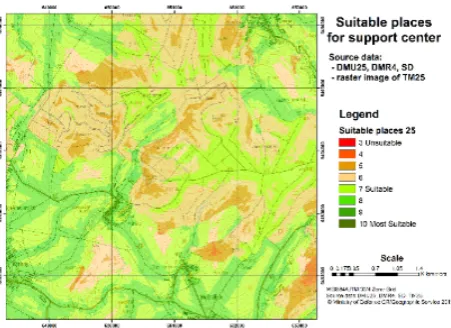
A cost map may be used as a separate output. However, more often it is used as a thematic layer over a suitable background which is usually a raster image of a topographic map. In order to avoid losing the analyzed information, especially from the point of view of its location in space, according to cartographic principles it is necessary to choose the same level of detail of the background map as thematic layers have (Slocum, McMaster, Kessler, & Howard, 2005), (Voženílek, et al., 2011). In the given case, the corresponding background map is a raster image of topographic map 1:25,000. Figure (Figure 4) gives an example of a cost map as a thematic layer over a raster image of military topographic map 1:25,000.
Code Vegetation type Suitability coefficient
EA030 Forest nursery 1
EA040 Orchard 1
EA050 Vineyard 1
EB010 Pasture, meadow 7
EB020 Scrubs 6
EC015 Forest 1
NoData No vegetation 10
Table 3. Codes of vegetation types (MoD-GeoS, 2010) and their suitability for deployment of logistics center
Code Soil type Suitability coefficient
001 weak soil (sandy) 10
002 lighter moderate soil 10 003 moderate soil (loam) 9 004 stronger moderate soil 8
005 strong soil (clay) 7
996 built-up area 1
997 water area 1
998 not defined 1
Table 4. Codes of soil types according to (Novák, 2000) and their suitability for deployment of logistics center
2.2 Quality of geographic data in multi-criterial analysis
Results of a multi-criterial analysis of course depend on the quality of the used digital geographic data. Within the step of research of input data, it is necessary to evaluate not only the content of data files but also their utility value (Talhofer, Hošková-Mayerová, & Hofmann, 2018), (Talhofer, Hoskova-Mayerova, & Hofmann, 2012). The following text presents the influence of quality of source data on the resulting analysis whose geo-process model was presented in the previous paragraph.
In order to establish the influence of quality of the source data on the given analysis, the same analysis with less detailed source data with a lower utility value was made. Positional database DMU100, elevation model DMR3 and the same soil database were used for the analysis. Positional database DMU100 corresponds to the same standards as DMU25, its level of detail, however, is on the level of a topographic map 1:100,000, in which the typical accuracy of position of objects is 50 meters (MoD-GeoS, 2006).
Figure 4. Example of cutout of the cost map as a thematic layer over a raster image of military topographic map 1:25,000
The position of objects is then by one order lower. The elevation model DMR3 is again created by a network of height points, but unlike DMR4, this network is 10×10 meters and the typical height accuracy is 2 5 meters. That is why the results of the performed partial analyses correspond to the characteristics of accuracy. With regards to a thinner network of height points, the complete analysis was made with the size of a raster pixel of 10×10 meters. The picture (Figure 5) shows results of the complete analysis with consideration of weights of the individual factors.
With regards to the fact that this cost map has a lower level of detail, it is suitable to use a raster image of a topographic map in scale 1:50,000 or 1:100,000 as a background map.
A clear difference in obtained results can be understood from the picture (Figure 6), where there are values obtained from less quality data (DMU100, DMR3) deducted from the values of individual pixels of analysis with the use of more accurate data (DMU25, DMR4).
Figure 5. Cost map for the evaluation of suitable places for the deployment of a support center from data of DMU100, DMR3 and SD
3. Discussion
From the given example it is obvious that from more quality data also results of an analysis are of a higher quality. In decision making processes, however, requirements for maximal accuracy of the analysis are often minor, in some cases too accurate results may be even unnecessary because the executive is bothered by many details when making decisions. For making a decision the factor of time is often much more important, i.e. time from giving the instruction to perform an analysis to its delivery to the one who asked for it. In this sense it is necessary to consider not only the result itself but also the time needed to reach it.
Figure 6. Differences in values in Cost maps created from DMU25 and DMR4 and DMU100 and DMR3. The same SD was used.
necessary to take into consideration also the quality of the used calculation tools and the whole used system including considering concurrently running programs (Schmid, Galicz, & Reinhardt, 2015). However, if the result must be delivered in a certain time, it is necessary to consider these times.
Pokonieczny in his work (Pokonieczny & Mościcka, 2018) measured the time needed for an analysis of movement possibilities of military units in an area of 60×60 km (AOI) with the help of data VMap1 (similar to MGCP). The table (Table 5) gives needed times for the preparation of data and the calculation itself.
If an analyst has only limited time, he/she needs to provide the responsible worker – commander – with information about the quality of the analysis result in the given time. Then it is the commander’s decision whether a lower quality of results is sufficient for making the decision. If the given quality is not good enough, he/she needs to decide whether to shrink the area of analysis or to provide longer time to process the analysis.
Another factor that is necessary to take into consideration is the location of the workplace where the spatial analysis is carried out. This workplace is not usually a part of the intervention units, nor the support center, but it is dislocated in a stable facility. The processed analysis – cost map – will then be transferred by communication systems from the analytical workplace to C2S in the place of action. The capacity of the communication lines is usually limited and these lines in case of a crisis situation will be overloaded. Typical capacity of wireless connection is 2 Mb/s (higher level) or 9 kb/s (tactical level). That is why it is necessary to minimize also the volume of transferred information. For this reason, it is necessary to consider sizes of raster files of cost maps.
Pixel size (km)
Number of pixels in AOI
Time for data prep.
Time of analysis calc.
Total time 0.1 295772 90 h 22 min 2 h 28 min 92 h 50 min 0.2 74317 22 h 42 min 0 h 37 min 23 h 20 min 0.5 12060 3 h 41 min 0 h 6 min 3 h 47 min
1 3085 0 h 57 min 0 h 2 min 1 h 0 min 2 808 0 h 15 min 0 h 1 min 0 h 16 min 5 147 0 h 3 min < 0 h 1 min 0 h 4 min 10 44 0 h 1 min < 0 h 1 min 0 h 2 min
Table 5. Times for the preparation and performance of an analysis of movement possibilities of military units in an area of 60x60 km (adapted from (Pokonieczny & Mościcka, 2018))
As already stated, results of geographic analyses are usually displayed within C2S as a thematic layer over raster image of topographic maps. For a higher level of
command, raster image of topographic maps 1:100,000 (TM100) are used, for lower levels that need greater detail raster image of topographic maps 1:25,000 (TM25) are used. From the point of view of the characteristics of the given source maps, the corresponding size of a pixel of the resulting analysis in case of TM100 map is 50x50 meters, in case of TM25 it is then 5x5 meters. Of course, it is possible to use even a smaller pixel size for TM100 but from the point of view of the level of decision making such detail information is not exploited anyway.
Now it is the analyst`s decision what way they get to the required level of detail of input files. If they have data models with various quality available (as described in the previous paragraphs), they can process a more quality analysis with the use of more quality data. The processed result is used on lower levels of command. For higher levels of command, they may resample the resulting cost map to a larger pixel. With this procedure there is not such a loss of information and still the size of the resulting file decreases. On the other hand, it is necessary to count with longer times for processing of the analysis itself and for resampling of its results.
Another option is to use less quality data and to process the required analysis immediately with the required level of detail of the resulting raster file. In this case the required result may differ in details from the result described in the previous paragraph but there is time saved and both processes may run in the analytical workplace at the same time. The decision which procedure to choose always depends both on the data available as well as on the time that the analytical workplace gets to process the analysis and at the same time on the specific user`s requirements.
In order to compare possible procedures and sizes of resulting files, 4 variants of solution of the model task of searching for a suitable location for the support center were prepared.
The table (Table 6) gives sizes of raster files of cost maps in the given variants. Variants V1 and V2 were described in the preceding text. Variant V3 was created by resampling of variant V1 using the method of bilinear transformation, variant V4 was created in the same way as variant V3 but using variant V2 instead.
Variant Input data Output Pixel Size
Pixel Depth
File Size V1 DMU25,
DMR4, SD
5×5 m 8 Bit 6,99 MB V2 DMU100,
DMR3, SD 10×10 m 8 Bit 1,74 MB V3 DMU25,
DMR4, SD – resampled
50×50 m 8 Bit 71,4 KB V4 DMU100,
DMR3, SD – resampled
50×50 m 8 Bit 71,4 KB
It is obvious that in both cases when resampling took place, a significant decrease of the resulting raster file was reached, whose transfer over the net will not load this net much. The duration of transmission of V1 using 2Mb/s transmitter is 30 s, and 9kb/s is 108 min. In case of transmission of V3 or V4 the duration is 0.3 s, resp. 26 min.
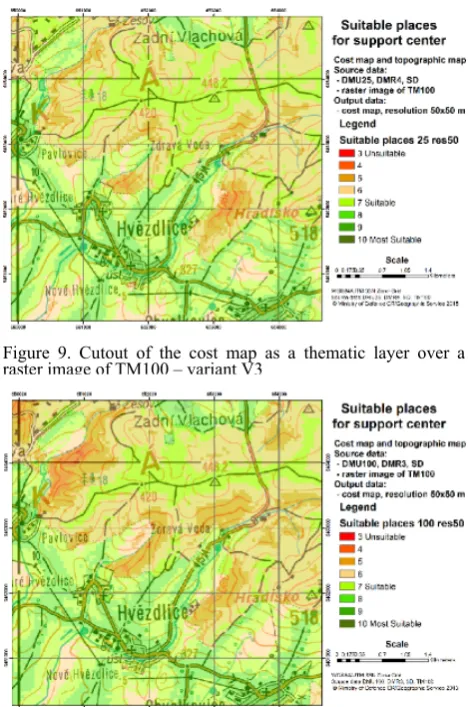
In order to compare the differences in the individual variants, the following pictures show cutouts of the model situation projected as thematic layers over raster image of topographic maps in the way as they may display on the screens of C2S.
4. Conclusion
This contribution certainly could not cover all problems that occur when solving analytical activities of geographic support of C2S. The main aim was to show the issue of quality of digital geographic data within a solution of analytical tasks using multi-criterial analysis. It was indicated how to solve also the questions of visualization of the results of analyses as thematic layers over the basic topographic situation within so-called Common Operational Picture (COP) that are used in C2S. There was also solved the problem of the size of the resulting files and the possibility of minimizing the volume of data in terms of their transmission over the
wireless network. Although the solution was a model example, its results are applicable to automated C2S.
5. Acknowledgement
The work presented in this paper was supported within the project for “Development of the methods of evaluation of environment in relation to defense and protection of the Czech Republic territory” (Project code NATURENVIR) and “Development of the methods for increasing mobility of military vehicles” (Project code MOBAUT) supported by the Ministry of Defence the Czech Republic.
6. References
Aringhieri, R., Carello, G., & Morale, D. (2016, JAN). Supporting decision making to improve the performance of an Italian Emergency Medical Service. Annals of operations research, 236(1), pp. 131-148. doi:10.1007/s10479-013-1487-0
Buttenfield, B. P., & McMaster, R. B. (1991). Map generalization: Making rules for knowledge representation (Longman Scientific & Technical ed.). Essex: Longman.
CUZK. (2010). http://geoportal.cuzk.cz/. (State Administration of Land Surveying and Cadastre, Land Survey Office) Retrieved 10 2017, from Geoportal
Figure 9. Cutout of the cost map as a thematic layer over a raster image of TM100 – variant V3
Figure 7. Cutout of the cost map as a thematic layer over a raster image of TM25 – variant V
Figure 8. Cutout of the cost map as a thematic layer over a
CUZK - Access to map products and services: http://geoportal.cuzk.cz/
D´Amico, P., Di Martino, F., & Sessa, S. (2013). A GIS as a Decision Support System for Planning Sustainabel Mobility in a Case-Study. In Multicriteria and Multiagend Decision Making with Applications to Economics and Social Sciences (Studies in Fuzziness and Soft Computing ed., pp. 115-128). Berlin Heidelberg, Germany: Springer Verlag.
Esri. (2013). ArcGIS User documentation. Copyright © 1995–2013 Esri.
Fiala, P., Jablonsky, J., & Manas, M. (1997). Multicriteria decision making (in Czech). Prague: University of Economics, Prague.
Hofmann, A., Hoskova-Mayerova, S., Talhofer, V., & Kovarik, V. (2015). Creation of models for calculation of coefficients of terrain passability. Quality & Quantity, 49(4), pp. 1679-1691.
Kovarik, V., & Marsa, J. (2014). Specifics of thematic map production within geospatial support at a politico-strategic level. Geographia Technica, 9(1), pp. 52-65. Malczewski, J. (1999). GIS and Multicriteria Decision
Analysis. Ontario: John Wiley & Sons, Inc.
Maliene, V. (2011, May). Specialised property valuation: Multiple criteria decision analysis. Journal of Retail & Leisure Property, 9(5), pp. 443-450.
MoD-GeoS. (2006). Catalogue of Topographic Objects DMU100. Dobruska: Ministry of Defence of the Czech Republic, Geographic Service.
MoD-GeoS. (2010). Catalogue of the Topographic Objects DMU25 (7.3 ed.). Dobruska: Ministry of Defence of the Czech Republic, Geographic Service. Novák, P. (2000). Soil database (Účelová databáze
PŮDY, Příručka uživatele - in Czech). Praha: Vojenský zeměpisný ústav.
Pokonieczny, K., & Mościcka, A. (2018). The influence of the shape and size of the cell on developing military passability maps. Cartography and Geographic Information Science.
Rybansky, M., & Vala, M. (2010). Relief impact on transport. ICMT'09: International Conference on Military Technologies (pp. 551-559). Brno: University of Defence.
Schmid, S., Galicz, E., & Reinhardt, W. (2015). WMS Performance of Selected SQL and NoSQL Databases. International conference on military technologies (ICMT 2015) (pp. 311-316). Brno: University of Defence.
Slocum, T., McMaster, R., Kessler, F., & Howard, H. (2005). Thematic Cartography And Geographic Visualization (2 ed.). Upper Saddle River, NJ 07458: Pearson Education, Inc.
Talhofer, V., Hoskova-Mayerova, S., & Hofmann, A. (2012). Improvement of digital geographic data quality. International Journal of Production Research, 50(17), pp. 4846-4859.
Talhofer, V., Hošková-Mayerová, Š., & Hofmann, A. (2018). Quality of Spatial Data in Command and Control System (Studies in Systems, Decision and Control, Volume 168 ed.). Cham, Switzerland: Springer International Publishing.
Voženílek, V., Kaňok, J., Bláha, J. D., Dobešová, Z., Hudeček, T., Kozáková, M., & Němcová, Z. (2011). Metody tematické kartografie, vizualizace prostorových jevů (in Czech). Olomouc, Česká republika: Univerzita Palackého.