R E S E A R C H
Open Access
Interrogating causal pathways linking genetic
variants, small molecule metabolites, and
circulating lipids
So-Youn Shin
1,2†, Ann-Kristin Petersen
3†, Simone Wahl
4,5,6, Guangju Zhai
7,8, Werner Römisch-Margl
9, Kerrin S Small
7,
Angela Döring
10,11, Bernet S Kato
7,12, Annette Peters
11, Elin Grundberg
13,14, Cornelia Prehn
15, Rui Wang-Sattler
4,
H-Erich Wichmann
10,16,17, Martin Hrabé de Angelis
15,18, Thomas Illig
19, Jerzy Adamski
15,18, Panos Deloukas
1,20,21,
Tim D Spector
7, Karsten Suhre
9,22, Christian Gieger
3and Nicole Soranzo
1,23*Abstract
Background:Emerging technologies based on mass spectrometry or nuclear magnetic resonance enable the monitoring of hundreds of small metabolites from tissues or body fluids. Profiling of metabolites can help elucidate causal pathways linking established genetic variants to known disease risk factors such as blood lipid traits.
Methods:We applied statistical methodology to dissect causal relationships between single nucleotide polymorphisms, metabolite concentrations, and serum lipid traits, focusing on 95 genetic loci reproducibly
associated with the four main serum lipids (total-, low-density lipoprotein-, and high-density lipoprotein- cholesterol and triglycerides). The dataset used included 2,973 individuals from two independent population-based cohorts with data for 151 small molecule metabolites and four main serum lipids. Three statistical approaches, namely conditional analysis, Mendelian randomization, and structural equation modeling, were compared to investigate causal relationship at sets of a single nucleotide polymorphism, a metabolite, and a lipid trait associated with one another.
Results:A subset of three lipid-associated loci (FADS1,GCKR, andLPA) have a statistically significant association with at least one main lipid and one metabolite concentration in our data, defining a total of 38 cross-associated sets of a single nucleotide polymorphism, a metabolite and a lipid trait. Structural equation modeling provided sufficient discrimination to indicate that the association of a single nucleotide polymorphism with a lipid trait was mediated through a metabolite at 15 of the 38 sets, and involving variants at theFADS1andGCKRloci.
Conclusions:These data provide a framework for evaluating the causal role of components of the metabolome (or other intermediate factors) in mediating the association between established genetic variants and diseases or traits.
Background
Recent technological advances allow for the collection of high-dimensional molecular phenotype datasets in thou-sands of individuals in a highly standardized manner. Meta-bolomics technologies based on mass spectrometry (MS) or nuclear magnetic resonance (NMR) enable the monitoring of hundreds of small molecule metabolites in tissues or body fluids [1-3]. Metabolites are intermediates in metabolic
pathways, which can be used to obtain a snapshot of the physiological status of an individual at a given time point. These datasets are typically organized into metabolic correl-ation networks, which are mined to deduce unknown path-ways from observed correlations, for instance to identify metabolic signatures of disease status [4].
An emerging application of quantitative or semi-quantitative technologies such as LC-MS-based metabolomics is their combination with genome-wide association data to discover genetic loci underlying variation in human me-tabolism. Genome-wide metabolomics scans based on hundreds of metabolite and lipid species measured using
* Correspondence:[email protected]
†Equal contributors
1
Wellcome Trust Sanger Institute, Genome Campus, Hinxton CB10 1HH, UK
23Department of Hematology, Long Road, Cambridge CB2 0PT, UK
Full list of author information is available at the end of the article
© 2014 Shin et al.; licensee BioMed Central Ltd. This is an Open Access article distributed under the terms of the Creative Commons Attribution License (http://creativecommons.org/licenses/by/2.0), which permits unrestricted use, distribution, and reproduction in any medium, provided the original work is properly credited. The Creative Commons Public Domain Dedication waiver (http://creativecommons.org/publicdomain/zero/1.0/) applies to the data made available in this article, unless otherwise stated.
standardized high-throughput assays have to date identified over 100 independent loci for metabolites [5-14]. Import-antly, several of the metabolite-associated loci correspond to loci previously associated with risk of disease or their risk factors such as Crohn’s disease, kidney disease, and serum lipids. These first studies have demonstrated the usefulness of large-scale metabolomics scans for formulating novel hy-potheses on biochemical processes underpinning complex traits and diseases. Once correlations between a metabolite and a trait have been observed at a locus, however, the next challenge is to tease apart causal relations from shared en-vironmental effects or confounding.
This study explored the application of statistical infer-ence to dissect causal relationships at complex-trait loci where there is a concomitant association with one or more metabolites. The analysis was focused on: (1) a set of SNPs robustly associated with the four main circulating serum lipids in genome-wide association studies at the time of analysis, and including total cholesterol (TC), low-density lipoprotein cholesterol (LDL-C), high-density lipoprotein cholesterol (HDL-C), and triglycerides (TG) [15,16]; (2) 151 metabolites measured using the Biocrates platform [10]; and (3) the same four main serum lipids stated above. Briefly, subsets of the SNPs that have statistically signifi-cant associations with at least one metabolite and one lipid in our data were selected. Conditional analysis, Mendelian randomization (MR) [17], and structural equation model-ing (SEM) [18-20] were then applied to the data to infer
statistically causal relationships in each of
SNP-metabolite-lipid sets previously defined.
The overarching aim of this study was to apply statistical approaches to interrogate causal relationships using gen-omic, metabolgen-omic, and circulating lipid biomarker mea-sures as an exemplar model. This provides a framework that can be applied in many other settings both in relation to metabolomics data as well as other -omic measures.
Methods
Study description KORA
The Cooperative Health Research in the Region of Augsburg (KORA) study is a series of independent population-based epidemiological surveys and follow-up studies of participants living in the region of Augsburg, Southern Germany [21]. Blood samples for KORA F4 participants were collected between 2006 and 2008 in a standardized manner as previously described in detail [10].
Genotyping For genotyping, 1,814 KORA F4 samples
were randomly selected and genotyped using the Affy-metrix Human SNP Array 6.0. After filtering out low call rate SNPs and SNPs violating Hardy-Weinberg Equilib-rium (HWE), imputation was conducted using IMPUTE v0.4.2 [22] based on HapMap2.
Lipid measurement Four serum lipid measurements (in
mg/dl) were collected using the Dimension RxL (Dade Beh-ring); total cholesterol was determined by cholesterol-esterase method (CHOL Flex, Dade-Behring, CHOD-PAP method), HDL-C cholesterol by the AHDL Flex (Dade-Beh-ring, CHOD-PAP method after selective release of HDL-C), LDL-C cholesterol by the ALDL Flex (Dade Behring, CHOD-PAP method after colourless usage of all non-LDL-cholesterol) and triglycerides (TG) by the TGL Flex (Dade Behring, enzymatic colorimetric test, GPO-PAP method).
Metabolite measurementA total of 3,044 KORA F4
sam-ples were profiled using Biocrates AbsoluteIDQ Kit p150 across three periods of time (August/September 2008, November/December 2008, and March/April 2009; which were marked as three batches for the analysis). Finally, a total of 1,797 KORA F4 samples were available with genotypes, metabolite, and serum lipid measurements (Additional file 1: Table S1).
Twins UK
The TwinsUK cohort is an adult twin British registry recruited from the general population in the United Kingdom [23]. Blood samples collection has been de-scribed previously [9].
Genotyping TwinsUK samples were genotyped using a
combination of Illumina arrays (HumanHap300 [24,25], HumanHap610Q, 1 M-Duo and 1.2MDuo 1 M). For each dataset, the Illuminus calling algorithm [26] was used to as-sign genotypes (posterior probability≥0.95) and applied the standardized data QC criteria based on: (1) call rate, hetero-zygosity, ethnicity, and relatedness (for sample exclusion); and (2) HWE, minor allele frequency, and call rate (for SNPs). After pair-wise concordance check and further vis-ual inspection, the genotype datasets from different arrays were merged. Imputation was performed using the IM-PUTE software package (v2) [22] using two reference panels, P0 (HapMap2, rel 22, combined CEU + YRI + ASN panels) and P1 (610 k+, including the combined Human-Hap610 k and 1 M reduced to 610 k SNP content).
Lipid measurement Serum lipids for TwinsUK samples
were measured (in mmol/L) as described in [27] and the LDL-C values were derived from HDL-C and TG values using Friedewald’s equation. We converted all lipid mea-surements to mg/dl values to be consistent with KORA, by multiplying 38.67 for the LDL-C, HDL-C, and TC mea-surements and 87.5 for the TG measurement.
Metabolite measurement Metabolite measurements were
performed using the metabolomics platform Biocrates
AbsoluteIDQ Kit p150 under an identical protocol as
the Helmholtz Zentrum München. For 1,235 randomly selected TwinsUK samples with genotypes available, the metabolite measurements were conducted in two batches: one for 422 individuals in April 2009 and the other for 813 individuals in November 2009. One reference sample was included in each of the 10 plates run in the second batch, and metabolites were measured five times in each plate. These reference measurements were used for quality control purposes. After further QC (more details below), a total of 1,176 TwinsUK samples were available with me-tabolite, genotype, and serum-lipids measurements.
All the participants in both KORA and TwinsUK co-horts have provided informed consent and this study has been approved by Local Research Ethics Committee, Guy’s and St. Thomas’Hospital Ethics Committee for TwinsUK, and Bayerische Landesärztekammer for KORA. Summary information for all the samples can be found in Additional file 1: Table S1.
Metabolomics measurements and QC Metabolite panel
The analyzed metabolite panel comprises 163 differ-ent metabolites, including 14 amino acids, hexoses (H1), free carnitine (C0), 40 acylcarnitines (Cx:y), hydro-xylacylcarnitines (C(OH)x:y), and dicarboxylacylcar-nitines (Cx:y-DC), 15 sphingomyelins (SMx:y) and N-hydroxylacyloylsphingosylphosphocholine (SM (OH) x:y), 77 phosphatidylcholines (PC, aa = diacyl, ae = acyl-alkyl), and 15 lyso-phosphatidylcholines. Quality pa-rameters and quantification procedures were as de-scribed by us [28]. After quality control, 151 different metabolites remained in the dataset (Additional file 1: Table S2). Lipid side-chain composition is abbreviated as Cx:y, where x denotes the number of carbons in the side chain and y the number of double bonds. For ex-ample,‘PC ae C32:1’denotes an acyl-alkyl phosphatidyl-choline with 32 carbons in the two fatty acid side chains and a single double bond in one of them. Full biochemical names are provided in Additional file 1: Table S1. The precise position of the double bonds and the distribution of the carbon atoms in different fatty acid side chains cannot be determined with this technology. In some cases, the mapping of metabolite names to indi-vidual masses can be ambiguous. For example, stereo-chemical differences are not always discernible, and neither are isobaric fragments. In such cases, possible al-ternative assignments are indicated.
Metabolite measurements in KORA and TwinsUK
Liquid handling of serum samples (10 μL) was
per-formed with a Hamilton Star (Hamilton Bonaduz AG) robot, and samples were prepared for quantification
using the AbsoluteIDQ Kit p150 (BIOCRATES Life
Sci-ences AG). Sample analyses were done on 4000 Q TRAP
LC/MS/MS System (AB Sciex) equipped with a Shimadzu Prominence LC20AD pump and a SIL-20 AC autosam-pler. The complete analytical process was performed using the MetIQ software package, which is an integral part of the AbsoluteIDQkit. The MetIQ version 1.2.1r (Lithium), released in April 2010 was used, which incorporates an isotope correction. The experimental targeted metabolo-mics measurement technique is described in detail by US patent US 2007/0004044 [29] and in the manufacturer’s manuals. A summary of the method can be found in else-where [30-32], and a comprehensive overview of the field and the related technologies is given in [33]. Briefly, a tar-geted profiling scheme is used to quantitatively screen for known small-molecule metabolites using multiple reaction monitoring. Quantification of the metabolites of the bio-logical sample is achieved by reference to appropriate in-ternal standards. The method has been proven to conform to 21CFR (Code of Federal Regulations) Part 11, which implies proof of reproducibility within a given error range. It has been applied in different academic and industrial applications [11,33,34]. Concentrations of all analyzed me-tabolites are reported inμM.
Batch effects
The mean differences of the metabolomics measurements across different measurement batches were compared to assess the influence of possible batch effects due to calibra-tion of the machines at periodical time points. To account for these differences in mean, a batch variable was included in all analyses of metabolomics data. For consistency this batch variable was applied to all metabolites independent of demonstration of significant batch effects.
Quality control
Quality control of the metabolomics datasets was con-ducted in two steps. In the first step the quality of all metabolites was controlled by their coefficient of vari-ation (CV) and missing value rate. For CV calculvari-ation, one reference blood sample was measured five times on each plate across all 10 plates. The CV for each metabol-ite was calculated as follows:
CV¼ sd ðall five reference measurementsÞ mean ðall five reference measurementsÞ
The mean CV for each metabolite was computed from all 10 plates. All metabolites with a mean CV greater than 25% were excluded. In addition to this criterion, a maximal missing value rate of 5% was imposed. The second step of our quality control was removing outlying data points and outlying samples. This step was applied to log-transformed metabolites, which were consistently closer to normality than the untransformed metabolites based on the Anderson Darling test. Outlying data points were defined as values
Shinet al. Genome Medicine2014,6:25 Page 3 of 16
greater than 5 sd away from the mean for each metabolite. For each sample, two outlying data points were claimed to be independent if the correlation of corresponding metabo-lites was less than 70%. Samples with more than three inde-pendent outlying data points were excluded. For samples with less than, or equal to, three independent outlying data points, only the data points were excluded. Finally, all miss-ing values were imputed usmiss-ing the R-package ‘mice’[35], which applies a linear regression approach to estimate a distribution of each variable with missing values conditional on all the other variables in the same multivariate dataset, and replaces missing values with simulated values drawn from this distribution.
Data summary
A total of 163 metabolites were measured in 3,061 sam-ples of KORA F4 and in 1,237 samsam-ples of TwinsUK. In the first step of quality control, 11 metabolites were ex-cluded for having a CV higher than 25% and one metab-olite for having more than 5% missing values (Additional file 1: Table S2). In the second step, 17 samples were dis-carded in KORA F4, due to their multiple independent outlying data points and two samples in TwinsUK. In addition, 419 and 254 outlying data points were treated as missing values in KORA F4 and TwinsUK, respect-ively. Together with the original missing data points, 0.09% of all data points were imputed in KORA F4 and 0.16% in the TwinsUK. After sample and metabolite ex-clusions, a total of 151 metabolites were available for analysis in 3,044 samples in KORA F4 and 1,235 samples in TwinsUK (among which 1,797 samples in KORA F4 and 1,176 in TwinsUK had available metabolite, geno-type, and serum-lipids measurements).
Candidate SNPs
The analysis focused on a total of 102 SNPs at 95 lipid-associated loci reported as primary association signals in a large-scale GWAS [16] for four lipid traits under the genome-wide significance threshold (P value ≤5 × 10⁻⁸) since our study would not have the same statistical power to detect additional novel lipid-associated loci with even smaller variances explained. Among the 102 SNPs, 52 were associated with TC, 37 with LDL-C, 47 with HDL-C, and 32 with TG in the original study. Many of these loci were associated with multiple lipid traits; for example, 41 were associated with two lipid traits, seven with three lipid traits, and six with all four lipid traits. Summary informa-tion for these SNPs measured in KORA and TwinsUK co-horts can be found in Additional file 1: Table S3.
Statistical analyses
Metabolite and lipid trait transformation
The Anderson Darling test with and without log-transformation was used to test deviation from normality
for metabolite values. The log-transformed metabolites were consistently closer to normality than the untrans-formed metabolites, and thus all metabolite measurements were log-transformed for analysis. The skewness of metab-olites used in our causal analyses is reported in the Additional file 1: Table S8. Most metabolites had skew-ness between−0.5 and 0.5, indicating a symmetrical distri-bution, with the exception of PC aa C32:2 in KORA
(skewness of −0.934) and five metabolites in TwinsUK.
However, these small deviations from symmetry had no impact on the results and interpretation of causal relation-ships (data not shown), so no filtering or transformation were applied at this stage. For lipids, TG values were log-transformed to achieve normality. The distribution of LDL-C, HDL-C, and TC approximated normality and no transformation was applied.
Heritability
For each metabolite, the narrow sense heritability was esti-mated from 86 monozygotic and 245 dizygotic twin pairs in TwinsUK under the ACE model. The ACE model as-sumes that the phenotypic variance is influenced by addi-tive genetic variation, common environmental effects, and unique environmental effects (or random effects), and in-fers the narrow sense heritability as the ratio of the esti-mated additive genetic variance to the phenotypic variance. The estimation was done by maximum likelihood methods implemented in OpenMx software [36].
Spearman’s correlation tests
Spearman’s correlation tests were used to identify corre-lated metabolite-lipid pairs, defined asPvalue <8.3 × 10⁻⁵ (Bonferroni corrected for 4 lipids and 151 metabolites) and the same direction of Spearman’s rho in both cohorts. We note that this correction over the number of tests may be over-conservative owing to highly correlated metabolite concentrations. Significant covariates (sex, age, and batch effect) were regressed out from metabolites and lipids prior to the correlation test. The computation of thePvalue and Spearman’s rho were done using the function ‘cor.test’in R. Correlations were visualized by a heat map plot com-bined with a hierarchical clustering using the ‘heatmap.2’ function of the R-package‘gplots’[37] with default settings.
Single-trait association and meta-analysis
in both cohorts were selected. Associations of the 102 candidate SNPs and main lipids were also tested using the same approach, and SNPs withP value <0.05 in the TwinsUK-KORA meta-analysis were retained for analysis.
SNP-MET-LIP sets
Each metabolite with its statistically significantly associ-ated SNP and lipid trait (defined by the criteria above) was assigned to a unique SNP-MET-LIP dataset, where SNP denotes a genetic variant, MET denotes a metabol-ite, and LIP denotes a serum lipid trait. Only unrelated samples in TwinsUK (N = 845) were included for ana-lysis. For metabolites and lipid traits, covariates adjust-ment were performed including age, sex, and batch effect using a linear regression model [16].
Conditional analysis
For each SNP-MET-LIP set, the association between SNP and LIP was tested under a linear regression model with and without adjustment for MET.
Unadjusted model :yLIP¼αþβ⋅xSNPþε
Adjusted model for the metabolite :yLIP¼αadjþ βadj⋅xSNPþγadj⋅xMETþεadj
To examine the influence of MET on SNP-LIP associ-ation, theP value between SNP and LIP in adjusted model was examined (in the way thatPvalue≥0.05 was considered as unlikely to have direct association) and the change of the estimated effect size of SNP was measured as follows.
Effect size change :¼
^ βadj−β^
^ β
Mendelian randomization
To estimate the causal effect of a metabolite on a lipid trait, Mendelian randomization (MR) [17,38] was applied to each SNP-MET-LIP set. Briefly in the MR approach, a genetic variant (G, here SNP) is used as an instrumental variable, which is not correlated with unknown con-founders (U), to test a hypothesis that a variable (X, here MET) is causal to the outcome (Y, here LIP).
X
Y
G
U
MR studies rest on three assumptions: (1) G is associ-ated with X; (2) G is independent of U; and (3) G is in-dependent of Y given X and U, that is, there is only one path from G to Y which is through X. For the estimation
in MR, the Wald ratio, two-stage least squares and lim-ited information maximum likelihood are commonly used, which are equivalent for a single instrument [39]. The Wald ratio method was applied here to estimate the unconfounded causal effect from MET to LIP [40] from the ratio of the regression coefficient of SNP in a linear regression of MET and LIP on SNP, respectively, under a simple linear model.
^
βMET→LIP¼
^ βSNP→LIP
^
βSNP→MET
The confidence interval of the unconfounded causal effect was computed using 1,000 bootstrap replicates [41] using the R-package‘boot’.
Structural equation modeling
SEM represents a generalization of the MR model. While MR tests the magnitude of an unconfounded effect under a given hypothesis on a causal relationship (for example,
SNP→MET→LIP), SEM measures the likelihood of each
of the possible hypotheses on path model implying a causal relationship, to select the best fitted path model. When a SNP and two traits are cross-associated with one another, 10 path models are suggested to be possible (Figure 1) [18]. Of these, only Models 4 to 10 were tested for SNP-MET-LIP sets because Models 1 to 3 in Figure 1 were overpara-meterized in our study (that is, they had zero degrees of freedom). Models 1 to 3 are also Markov equivalent and cannot be statistically distinguished as their maximized likelihood are the same [42-44]. It should be also noted that Model 4 in Figure 1 corresponds to the MR model, however, the estimation of Model 4 within the SEM frame-work would be done by the full information maximum likelihood method, rather than by the limited information maximum likelihood method that coincides with the MR we used above. The former maximizes the full joint likeli-hood and the latter the reduced likelilikeli-hood only [39].
In details, the structural model can be denoted as
v¼Avþu
where v is the vector of all the variables included in the model,uis the vector of residuals, andAis the matrix of the model coefficients. Under the same assumptions of a simple regression model (including independence, con-stant variance, and normality of the errors as well as lin-earity between dependent and independent variables), the expected covariance matrixΣcan be estimated as follows
Σ¼E vv T¼ðI−AÞ−1E uu TðI−AÞ:
The matrix Σ=Σ(θ) is a function of model parameter vectorθ which includes model coefficients, measurement errors, and structural disturbances. Next, the observed
Shinet al. Genome Medicine2014,6:25 Page 5 of 16
covariance matrix S is computed directly from the va-riable values. Finally, the difference between expected
and observed covariance matrices Σand S is evaluated
by Pearson’s chi-squared test (Goodness of Fit Test)
under the null hypothesis that the model fits the obser-vation. The test statistic is derived as
lnjΣ θð Þj þtr S Σ−1ð Þθ −lnj jS−peX2
wherepis the number of variables included. All SEM ana-lyses were performed by using the R-package‘sem’[45].
Once the fit of all possible path models was evaluated, the best fitted model was required to fit the following four criteria as defined previously [46-48]: (1) Goodness of Fit Test P value ≥0.05 (indicating how likely the hy-pothesis is, or how well the observed data fit the expect-ation of the model); (2) 0.9 < Goodness of Fit Index
(GoFI)≤1; (3) Root Mean Squared Error Approximation
(RMSEA)≤0.05; (4) smallest negative Bayesian Informa-tion Criterion (BIC). Where multiple models fit to the data, the best fitted model was selected if its BIC was at least two units smaller than the next lowest BIC [48], otherwise none was selected.
Software programs
Most analyses were carried out using publically available packages in the R environment. SNP-metabolite associ-ation analyses were carried out using SNPTEST and MER-LIN. Heritability estimation was carried out in OpenMx.
Results
The study design is shown in Figure 2. The Biocrates metabolomics profiling described in Illig et al. [10] was
extended to an additional 813 TwinsUK samples. After stringent quality controls, a complete set of data for 151 metabolite concentrations (Additional file 1: Table S2) and four main serum lipid traits (TC, LDL-C, HDL-C, and TG) collected at the same time point became avail-able for 1,797 and 1,176 individuals from the KORA (Germany) and TwinsUK (UK) samples, respectively (Additional file 1: Table S1).
To quantify the genetic basis of each metabolite con-centration, the proportion of the heritable variance was estimated from 86 monozygotic and 245 dizygotic twin pairs in TwinsUK samples under the ACE model. A total of 96 metabolites were observed to be moderately to highly heritable (68 with 25%≤h2< 50% and 28 with
h2≥50%) (Additional file 1: Table S2) confirming a
broad genetic basis for small metabolites.
showing similar patterns of correlation (Additional file 2: Figure S1).
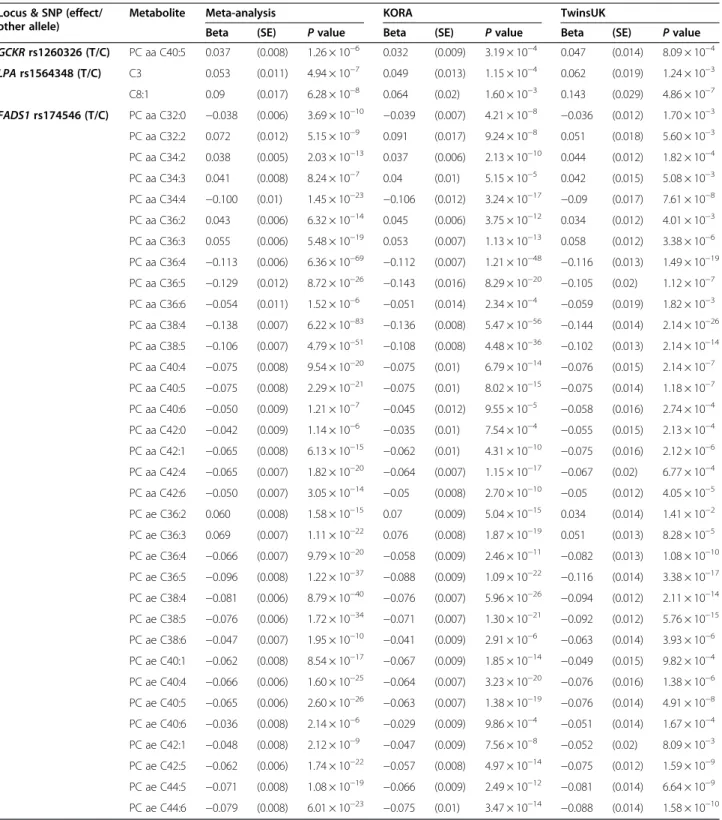
Metabolite levels are associated with known lipid SNPs Genetic associations between 151 metabolites and 102 SNPs at 95 known lipid loci [16] were further tested. Three loci, namelyFADS1, GCKR, and LPA, were associ-ated with at least one metabolite in the combined KORA and TwinsUK dataset (P value <3.3 × 10⁻⁶, Table 1). SNP rs174546 inFADS1was statistically significantly associated with concentrations of 34 different phosphatidylcholines (among which the strongest association was observed at PC aa C38:4 with Beta =−0.138 (SE = 0.007) andP value = 6.22 × 10−83), rs1260326 in GCKR was associated with the phosphatidylcholine PC aa C40:5 (Beta = 0.037 (0.008) andPvalue = 1.26 × 10⁻⁶) and rs1564348 inLPAwith car-nitines C3 (Beta = 0.053 (0.011) andP value = 4.94 × 10⁻⁷) and C8:1 (Beta = 0.09 (0.017) and P value = 6.28 × 10⁻⁸). Among them, the phosphatidylcholine PC aa C40:5 was
associated with both rs174546 in FADS1and rs1260326
inGCKR.
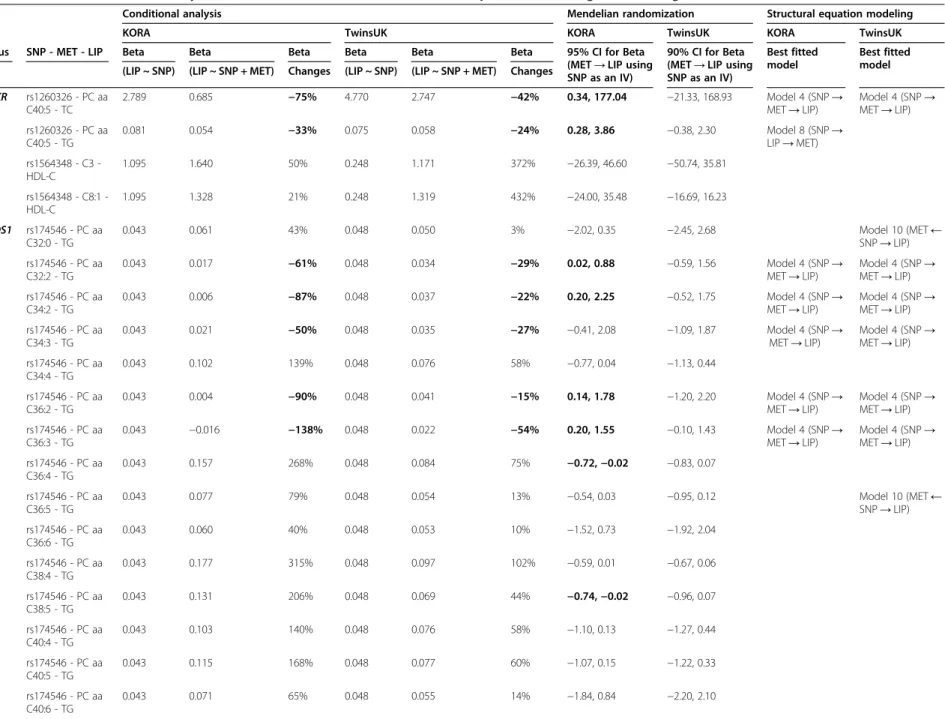
Metabolites mediate some lipid pathways
Based on the association result, all 38 significant SNP-MET-LIP sets were selected (that is, where a metabolite was statistically significantly associated with a SNP and a lipid; Table 2). For each SNP-MET-LIP set, three differ-ent statistical approaches were used to test the
hypoth-esis that MET might mediate SNP→LIP pathway.
First, the SNP-LIP association was conditioned on MET under a linear regression model in each SNP-MET-LIP
set. A total of 19 metabolites associated with lociGCRK and FADS1 resulted in marked declines of effect sizes in the metabolite-adjusted model (Table 2 and Additional file 1: Table S5). For example, the association between
rs1260326 in GCKR and TC showed a 66% decrease in
the effect size (from 3.274 mg/dl per copy of allele T, P value = 0.00429 to 1.125 mg/dl, P value = 0.275) after adjusting for PC aa C40:5. These observations were com-patible with the hypothesis that these metabolites may mediate the lipid pathways.
As a second approach, MR analysis was used to esti-mate the unconfounded causal effect of a metabolite on a lipid. For each SNP-MET-LIP set, the causal effect was estimated by the Wald method and its confidence inter-val was generated based on 1,000 bootstrap replicates. In KORA, 17 SNP-MET-LIP sets showed a causal
relation-ship between MET and LIP (that is, MET→LIP) at the
5% significance level, however, none of them were repli-cated in TwinsUK at the same level of significance (al-though two of them were significant at 10% significance level and in need of further analysis in a larger dataset) (Table 2 and Additional file 1: Table S6). For example, by using rs174546 inFADS1as an instrumental variable, the unconfounded causal effect of PC ae C38:5 onto TG was estimated to be −0.62 (95% CI = (−1.18, −0.05)) in KORA, but only−0.53 (90% CI = (−1.02, −0.01)) in a set of unrelated TwinsUK individuals (Figure 3).
Lastly, SEM was applied to test a broader range of possible paths in each SNP-MET-LIP set. In a total of 15 SNP-MET-LIP sets, the best fitted model was shown to be Model 4 (which corresponds to the path tested by Variable selection (KORA and TwinsUK)
Identify SNP-MET-LIP sets significant under Bonferroni correction
SNP
102 SNPs at 95 known lipid loci
MET
151 metabolites
LIP TC, LDL-C, HDL-C, TG P<8.3x10⁻⁵ P<3.3x10⁻⁶
published
Structural Equation Modeling (KORA)
Measure the model fit and select the best fitted path model among the models 4-10 in Figure2
SNP
MET
LIP
Mendelian Randomization (KORA)
Measure the significance of unconfounded effect from MET to LIP assuming MET LIP
SNP
MET
LIP
Conditional Analysis (KORA)
Measure the effect size decreases from SNP to LIP after adjusting for MET
SNP
MET
LIP adjusting for MET
?
? ?
Structural Equation Modeling (TwinsUK) Replication
Mendelian Randomization (TwinsUK) Replication
Conditional Analysis (TwinsUK) Replication
Figure 2Study design.
Shinet al. Genome Medicine2014,6:25 Page 7 of 16
MR) assuming SNP→MET→LIP (Figure 1) in both KORA and TwinsUK. For example, in a set composed
of rs174546 in FADS1, PC ae C38:5 and TG, only
Model 4 showed Goodness of Fit TestP value≥0.05 in
both cohorts (Figure 3). This set also satisfied other cri-teria to be selected as the best fitted model; such as
showing 0.9 < GoFI ≤1, RMSEA ≤0.05 and smallest
negative BIC (Additional file 1: Table S7). Thus the SEM analysis supports the model tested by MR that
phosphatidylcholines may mediate associations of GCKR
to TC and FADS to TG (Table 2 and Additional file 1:
Table S7).
Table 1 Association summary statistics
Locus & SNP (effect/ other allele)
Metabolite Meta-analysis KORA TwinsUK
Beta (SE) Pvalue Beta (SE) Pvalue Beta (SE) Pvalue
GCKRrs1260326 (T/C) PC aa C40:5 0.037 (0.008) 1.26 × 10⁻⁶ 0.032 (0.009) 3.19 × 10⁻⁴ 0.047 (0.014) 8.09 × 10⁻⁴
LPArs1564348 (T/C) C3 0.053 (0.011) 4.94 × 10⁻⁷ 0.049 (0.013) 1.15 × 10⁻⁴ 0.062 (0.019) 1.24 × 10⁻³
C8:1 0.09 (0.017) 6.28 × 10⁻⁸ 0.064 (0.02) 1.60 × 10⁻³ 0.143 (0.029) 4.86 × 10⁻⁷
FADS1rs174546 (T/C) PC aa C32:0 −0.038 (0.006) 3.69 × 10⁻¹⁰ −0.039 (0.007) 4.21 × 10⁻⁸ −0.036 (0.012) 1.70 × 10⁻³
PC aa C32:2 0.072 (0.012) 5.15 × 10⁻⁹ 0.091 (0.017) 9.24 × 10⁻⁸ 0.051 (0.018) 5.60 × 10⁻³
PC aa C34:2 0.038 (0.005) 2.03 × 10⁻¹³ 0.037 (0.006) 2.13 × 10⁻¹⁰ 0.044 (0.012) 1.82 × 10⁻⁴
PC aa C34:3 0.041 (0.008) 8.24 × 10⁻⁷ 0.04 (0.01) 5.15 × 10⁻⁵ 0.042 (0.015) 5.08 × 10⁻³
PC aa C34:4 −0.100 (0.01) 1.45 × 10⁻²³ −0.106 (0.012) 3.24 × 10⁻¹⁷ −0.09 (0.017) 7.61 × 10⁻⁸
PC aa C36:2 0.043 (0.006) 6.32 × 10⁻¹⁴ 0.045 (0.006) 3.75 × 10⁻¹² 0.034 (0.012) 4.01 × 10⁻³
PC aa C36:3 0.055 (0.006) 5.48 × 10⁻¹⁹ 0.053 (0.007) 1.13 × 10⁻¹³ 0.058 (0.012) 3.38 × 10⁻⁶
PC aa C36:4 −0.113 (0.006) 6.36 × 10−69 −0.112 (0.007) 1.21 × 10−48 −0.116 (0.013) 1.49 × 10⁻¹⁹
PC aa C36:5 −0.129 (0.012) 8.72 × 10⁻²⁶ −0.143 (0.016) 8.29 × 10⁻²⁰ −0.105 (0.02) 1.12 × 10⁻⁷
PC aa C36:6 −0.054 (0.011) 1.52 × 10⁻⁶ −0.051 (0.014) 2.34 × 10⁻⁴ −0.059 (0.019) 1.82 × 10⁻³
PC aa C38:4 −0.138 (0.007) 6.22 × 10−83 −0.136 (0.008) 5.47 × 10−56 −0.144 (0.014) 2.14 × 10⁻²⁶
PC aa C38:5 −0.106 (0.007) 4.79 × 10−51 −0.108 (0.008) 4.48 × 10−36 −0.102 (0.013) 2.14 × 10⁻¹⁴
PC aa C40:4 −0.075 (0.008) 9.54 × 10⁻²⁰ −0.075 (0.01) 6.79 × 10⁻¹⁴ −0.076 (0.015) 2.14 × 10⁻⁷
PC aa C40:5 −0.075 (0.008) 2.29 × 10⁻²¹ −0.075 (0.01) 8.02 × 10⁻¹⁵ −0.075 (0.014) 1.18 × 10⁻⁷
PC aa C40:6 −0.050 (0.009) 1.21 × 10⁻⁷ −0.045 (0.012) 9.55 × 10⁻⁵ −0.058 (0.016) 2.74 × 10⁻⁴
PC aa C42:0 −0.042 (0.009) 1.14 × 10⁻⁶ −0.035 (0.01) 7.54 × 10⁻⁴ −0.055 (0.015) 2.13 × 10⁻⁴
PC aa C42:1 −0.065 (0.008) 6.13 × 10⁻¹⁵ −0.062 (0.01) 4.31 × 10⁻¹⁰ −0.075 (0.016) 2.12 × 10⁻⁶
PC aa C42:4 −0.065 (0.007) 1.82 × 10⁻²⁰ −0.064 (0.007) 1.15 × 10⁻¹⁷ −0.067 (0.02) 6.77 × 10⁻⁴
PC aa C42:6 −0.050 (0.007) 3.05 × 10⁻¹⁴ −0.05 (0.008) 2.70 × 10⁻¹⁰ −0.05 (0.012) 4.05 × 10⁻⁵
PC ae C36:2 0.060 (0.008) 1.58 × 10⁻¹⁵ 0.07 (0.009) 5.04 × 10⁻¹⁵ 0.034 (0.014) 1.41 × 10⁻²
PC ae C36:3 0.069 (0.007) 1.11 × 10⁻²² 0.076 (0.008) 1.87 × 10⁻¹⁹ 0.051 (0.013) 8.28 × 10⁻⁵
PC ae C36:4 −0.066 (0.007) 9.79 × 10⁻²⁰ −0.058 (0.009) 2.46 × 10⁻¹¹ −0.082 (0.013) 1.08 × 10⁻¹⁰
PC ae C36:5 −0.096 (0.008) 1.22 × 10−37 −0.088 (0.009) 1.09 × 10⁻²² −0.116 (0.014) 3.38 × 10⁻¹⁷
PC ae C38:4 −0.081 (0.006) 8.79 × 10−40 −0.076 (0.007) 5.96 × 10⁻²⁶ −0.094 (0.012) 2.11 × 10⁻¹⁴
PC ae C38:5 −0.076 (0.006) 1.72 × 10⁻³⁴ −0.071 (0.007) 1.30 × 10⁻²¹ −0.092 (0.012) 5.76 × 10⁻¹⁵
PC ae C38:6 −0.047 (0.007) 1.95 × 10⁻¹⁰ −0.041 (0.009) 2.91 × 10⁻⁶ −0.063 (0.014) 3.93 × 10⁻⁶
PC ae C40:1 −0.062 (0.008) 8.54 × 10⁻¹⁷ −0.067 (0.009) 1.85 × 10⁻¹⁴ −0.049 (0.015) 9.82 × 10⁻⁴
PC ae C40:4 −0.066 (0.006) 1.60 × 10⁻²⁵ −0.064 (0.007) 3.23 × 10⁻²⁰ −0.076 (0.016) 1.38 × 10⁻⁶
PC ae C40:5 −0.065 (0.006) 2.60 × 10⁻²⁶ −0.063 (0.007) 1.38 × 10⁻¹⁹ −0.076 (0.014) 4.91 × 10⁻⁸
PC ae C40:6 −0.036 (0.008) 2.14 × 10⁻⁶ −0.029 (0.009) 9.86 × 10⁻⁴ −0.051 (0.014) 1.67 × 10⁻⁴
PC ae C42:1 −0.048 (0.008) 2.12 × 10⁻⁹ −0.047 (0.009) 7.56 × 10⁻⁸ −0.052 (0.02) 8.09 × 10⁻³
PC ae C42:5 −0.062 (0.006) 1.74 × 10⁻²² −0.057 (0.008) 4.97 × 10⁻¹⁴ −0.075 (0.012) 1.59 × 10⁻⁹
PC ae C44:5 −0.071 (0.008) 1.08 × 10⁻¹⁹ −0.066 (0.009) 2.49 × 10⁻¹² −0.081 (0.014) 6.64 × 10⁻⁹
PC ae C44:6 −0.079 (0.008) 6.01 × 10⁻²³ −0.075 (0.01) 3.47 × 10⁻¹⁴ −0.088 (0.014) 1.58 × 10⁻¹⁰
Table 2 Results of conditional analysis, Mendelian randomization and structural equational modeling for the 38 significant SNP-MET-LIP sets
Conditional analysis Mendelian randomization Structural equation modeling
KORA TwinsUK KORA TwinsUK KORA TwinsUK
Locus SNP - MET - LIP Beta Beta Beta Beta Beta Beta 95% CI for Beta
(MET→LIP using SNP as an IV)
90% CI for Beta (MET→LIP using SNP as an IV)
Best fitted model
Best fitted model (LIP ~ SNP) (LIP ~ SNP + MET) Changes (LIP ~ SNP) (LIP ~ SNP + MET) Changes
GCKR rs1260326 - PC aa C40:5 - TC
2.789 0.685 −75% 4.770 2.747 −42% 0.34, 177.04 −21.33, 168.93 Model 4 (SNP→
MET→LIP)
Model 4 (SNP→ MET→LIP)
rs1260326 - PC aa C40:5 - TG
0.081 0.054 −33% 0.075 0.058 −24% 0.28, 3.86 −0.38, 2.30 Model 8 (SNP→
LIP→MET)
LPA rs1564348 C3 -HDL-C
1.095 1.640 50% 0.248 1.171 372% −26.39, 46.60 −50.74, 35.81
rs1564348 C8:1 -HDL-C
1.095 1.328 21% 0.248 1.319 432% −24.00, 35.48 −16.69, 16.23
FADS1 rs174546 - PC aa C32:0 - TG
0.043 0.061 43% 0.048 0.050 3% −2.02, 0.35 −2.45, 2.68 Model 10 (MET←
SNP→LIP)
rs174546 - PC aa C32:2 - TG
0.043 0.017 −61% 0.048 0.034 −29% 0.02, 0.88 −0.59, 1.56 Model 4 (SNP→
MET→LIP)
Model 4 (SNP→ MET→LIP)
rs174546 - PC aa C34:2 - TG
0.043 0.006 −87% 0.048 0.037 −22% 0.20, 2.25 −0.52, 1.75 Model 4 (SNP→
MET→LIP)
Model 4 (SNP→ MET→LIP)
rs174546 - PC aa C34:3 - TG
0.043 0.021 −50% 0.048 0.035 −27% −0.41, 2.08 −1.09, 1.87 Model 4 (SNP→
MET→LIP)
Model 4 (SNP→ MET→LIP)
rs174546 - PC aa C34:4 - TG
0.043 0.102 139% 0.048 0.076 58% −0.77, 0.04 −1.13, 0.44
rs174546 - PC aa C36:2 - TG
0.043 0.004 −90% 0.048 0.041 −15% 0.14, 1.78 −1.20, 2.20 Model 4 (SNP→
MET→LIP)
Model 4 (SNP→ MET→LIP)
rs174546 - PC aa C36:3 - TG
0.043 −0.016 −138% 0.048 0.022 −54% 0.20, 1.55 −0.10, 1.43 Model 4 (SNP→
MET→LIP)
Model 4 (SNP→ MET→LIP)
rs174546 - PC aa C36:4 - TG
0.043 0.157 268% 0.048 0.084 75% −0.72,−0.02 −0.83, 0.07
rs174546 - PC aa C36:5 - TG
0.043 0.077 79% 0.048 0.054 13% −0.54, 0.03 −0.95, 0.12 Model 10 (MET←
SNP→LIP)
rs174546 - PC aa C36:6 - TG
0.043 0.060 40% 0.048 0.053 10% −1.52, 0.73 −1.92, 2.04
rs174546 - PC aa C38:4 - TG
0.043 0.177 315% 0.048 0.097 102% −0.59, 0.01 −0.67, 0.06
rs174546 - PC aa C38:5 - TG
0.043 0.131 206% 0.048 0.069 44% −0.74,−0.02 −0.96, 0.07
rs174546 - PC aa C40:4 - TG
0.043 0.103 140% 0.048 0.076 58% −1.10, 0.13 −1.27, 0.44
rs174546 - PC aa C40:5 - TG
0.043 0.115 168% 0.048 0.077 60% −1.07, 0.15 −1.22, 0.33
rs174546 - PC aa C40:6 - TG
0.043 0.071 65% 0.048 0.055 14% −1.84, 0.84 −2.20, 2.10
Shin
et
al.
Genome
Medicine
2014,
6
:25
Page
9
o
f
1
6
http://geno
memedicin
e.com/conten
rs174546 - PC aa C42:1 - TG
0.043 0.016 −62% 0.048 0.030 −38% −1.39,−0.07 −1.24, 0.15 Model 4 (SNP→
MET→LIP)
Model 4 (SNP→ MET→LIP)
rs174546 - PC aa C42:4 - TG
0.043 0.054 26% 0.048 0.051 6% −1.29, 0.03 −1.20, 0.63 Model 10 (MET←
SNP→LIP)
rs174546 - PC aa C42:6 - TG
0.043 0.067 57% 0.048 0.048 0% −1.77, 0.33 −1.76, 0.48 Model 10 (MET←
SNP→LIP)
rs174546 - PC ae C36:2 - TG
0.043 0.058 36% 0.048 0.054 12% −0.06, 1.14 −3.89, 2.77
rs174546 - PC ae C36:3 - TG
0.043 0.069 61% 0.048 0.062 29% −0.01, 1.03 −0.76, 1.89
rs174546 - PC ae C36:4 - TG
0.043 0.044 2% 0.048 0.037 −23% −1.39, 0.11 −1.13, 0.10 Model 4 (SNP→
MET→LIP)
rs174546 - PC ae C36:5 - TG
0.043 0.031 −29% 0.048 0.016 −66% −0.93,−0.07 −0.84, 0.02 Model 4 (SNP→
MET→LIP)
Model 4 (SNP→ MET→LIP)
rs174546 - PC ae C38:4 - TG
0.043 0.036 −16% 0.048 0.044 −8% −1.10,−0.06 −1.01, 0.07 Model 10 (MET←
SNP→LIP)
rs174546 - PC ae C38:5 - TG
0.043 0.030 −30% 0.048 0.022 −55% −1.18,−0.05 −1.02,−0.01 Model 4 (SNP→
MET→LIP)
Model 4 (SNP→ MET→LIP)
rs174546 - PC ae C38:6 - TG
0.043 0.039 −10% 0.048 0.030 −37% −1.99, 0.18 −1.52, 0.13 Model 4 (SNP→
MET→LIP)
rs174546 - PC ae C40:1 - TG
0.043 0.056 30% 0.048 0.046 −3% −1.19, 0.10 −2.02, 1.04 Model 10 (MET←
SNP→LIP)
rs174546 - PC ae C40:4 - TG
0.043 0.013 −71% 0.048 0.049 2% −1.36,−0.08 −1.20, 0.23 Model 4 (SNP→
MET→LIP)
Model 10 (MET← SNP→LIP)
rs174546 - PC ae C40:5 - TG
0.043 0.014 −68% 0.048 0.042 −13% −1.35,−0.05 −1.26, 0.19 Model 4 (SNP→
MET→LIP)
Model 4 (SNP→ MET→LIP)
rs174546 - PC ae C40:6 - TG
0.043 0.037 −13% 0.048 0.034 −29% −2.90, 2.54 −1.99, 0.64 Model 4 (SNP→
MET→LIP)
Model 4 (SNP→ MET→LIP)
rs174546 - PC ae C42:1 - TG
0.043 0.060 41% 0.048 0.051 6% −1.81, 0.26 −1.74, 1.72 Model 10 (MET←
SNP→LIP)
rs174546 - PC ae C42:5 - TG
0.043 −0.003 −106% 0.048 0.031 −36% −1.43,−0.11 −1.35, 0.15 Model 4 (SNP→
MET→LIP)
Model 4 (SNP→ MET→LIP)
rs174546 - PC ae C44:5–TG
0.043 −0.001 −102% 0.048 0.022 −54% −1.26,−0.14 −1.16, 0.12 Model 4 (SNP→
MET→LIP)
Model 4 (SNP→ MET→LIP)
rs174546 - PC ae C44:6–TG
0.043 −0.007 −117% 0.048 0.006 −87% −1.10,−0.10 −1.02,−0.05 Model 4 (SNP→
MET→LIP)
Model 4 (SNP→ MET→LIP)
Effect size declines in conditional analysis, confidence intervals not containing 0 in Mendelian randomization, and Model 4 reported as the best fitted model in structural equation modeling in each cohort were highlighted in bold to provide evidence for the mediating role of MET in SNP-LIP pathways. SEM Model 4: SNP→MET→LIP; Model 8: SNP→LIP→MET; Model 10: SNP→MET; SNP→LIP.
Genome
Medicine
2014,
6
:25
Page
10
of
16
memedicin
e.com/conten
Discussion
Blood lipid levels are major risk factors for coronary artery disease (CAD) and myocardial infarction (MI), and targets for therapeutic intervention. Recent large scale meta-analyses of genome-wide association scans (GWAS) to-taling >100,000 individuals has identified a total of 95 independent and common loci statistically significantly associated with at least one of the four main lipid traits (TC, LDL-C, HDL-C, and TG) [15,16]. Some of these loci are mapped to genes that are well known therapeutic tar-gets [49-51], but for the majority, little is known in terms of their biological function or their value as therapeutic targets. Further characterization of the pathways via which these loci may influence lipid species is a necessary step towards evaluating their therapeutic potential.
In this study, the potential roles of metabolites as inter-mediate phenotypes of the four main lipid traits were ex-amined. First, we showed that all 151 small metabolites profiled on the Biocrates metabolite panel were statistically significantly associated with lipid traits in two independent cohorts. Second, we demonstrated that 37 of these metabo-lites were robustly associated with variants at three different lipid-associated loci, including one metabolite associated with two loci, highlighting both known and potential new biochemical correlates (summarized in Table 3). Third, we applied a statistical framework composed of conditional analysis, MR, and SEM to investigate the role of metabo-lites in lipid pathways, and showed that one or more me-tabolites potentially mediate the SNP-lipid association at two loci,FADS1andGCKR(both statistically significant by
SEM, andFADS1suggestively by MR).
Overlap of associations of a genomic locus with different complex traits can be useful to derive novel hypotheses on possible underlying pleiotropic or causal effects. For in-stance, recent highly powered meta-analyses have systemat-ically compared the association of type 2 diabetes loci with correlated glycemic (fasting glucose, fasting insulin, 2-h glucose, HbA1C, and others) and metabolic traits (BMI, lipids, and others) [24,25,64-66] in an attempt to better characterize physiologic processes underlying asso-ciations at these loci. A similar degree of overlap has been characterized at serum lipid and coronary artery disease loci [16]. While these efforts have provided first important insights into pathophysiologic correlates at disease variants, observed correlations at a locus may often reflect shared environmental effects or confounding rather than causal re-lations between traits. Distinguishing causality from correl-ation in these contexts is essential to identify modifiable causes of disease and to unearth new avenues for thera-peutic intervention.
The advantage of using metabolites as intermediate phe-notypes is that they are more proximal to genes and bio-logical pathways than downstream phenotypes or clinical endpoints [11], ensuring more statistical power to detect genetic associations compared to more complex lipid traits. Furthermore, analysis of metabolites provides the opportunity to dissect complex metabolic pathways into their components. We showed here that through appro-priate statistical tools and prioritization strategies we can begin to dissect causal relationships. Although our infer-ences are limited by the lipid-focused content of the Biocrates metabolomic panel and by the study power, it
Structural Equation Modeling (KORA)
Measure the model fit and select the best fitted path model among the models 4-10 in Figure2
rs174546 TG
Mendelian Randomization (KORA)
Measure the significance of unconfounded effect from MET to LIP assuming MET LIP
rs174546 TG
Conditional Analysis (KORA)
Measure the effect size decreases from SNP to LIP after adjusting for MET
Beta decrease = 30% (0.043 0.030 after adjustment)
rs174546
PCaeC38:5
TG
adjusting for MET
Structural Equation Modeling (TwinsUK)
Replication
Best fitted model = Model 4 (Goodness of fit P = 0.43) Mendelian Randomization (TwinsUK)
Replication
Beta = -0.53 95%CI = (-1.13, 0.12) 90% CI = (-1.02, -0.01)
PCaeC38:5 PCaeC38:5
Conditional Analysis (TwinsUK)
Replication
Beta decrease = 55% (0.048 0.022 after adjustment)
Beta = -0.62 95% CI = (-1.18,-0.05)
Best fitted model = Model 4 (Goodness of fit P = 0.13)
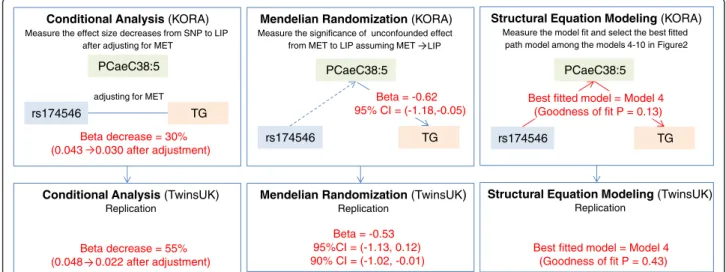
Figure 3Three different statistical analyses to test the hypothesis that a metabolite mediates theFADS1→TG pathway.The rs174546-T allele inFADS1locus is associated with both triglycerides and a small molecule metabolite, PC ae C38:5. We have tested the hypothesis that a metabolite mediates the lipid pathway using three different statistical approaches. The conditional analysis (left) confirmed that the effect size of rs174546 on triglyceride decreased conditional on PC ae C38:5 in both KORA and TwinsUK cohorts (top and bottom). The MR (middle) estimated a statistically significant causal effect of PC ae C38:5 on triglyceride, which however was not replicated in TwinsUK at 5% significance level, perhaps due to the small sample size (KORA = 1,797 and unrelated TwinsUK = 845). The SEM (right) showed that out of all possible models tested, the model 4 (rs174546→PC ae C38:5→trycliceride) was the best fitted one in both cohorts.
Shinet al. Genome Medicine2014,6:25 Page 11 of 16
is foreseeable that information relevant to this and other physiological context can be obtained by applying similar approaches to broader metabolite panels and larger study sizes.
Importantly, we demonstrate that our results are ro-bust in two independent populations and recapitulate a known biological process. For instance, the most plaus-ible path model atFADS1predicts that phosphatidylcho-lines mediate the association between SNP rs174546 and TG. FADS1 encodes a fatty acid desaturase regulating the desaturation of fatty acids by the addition of a fourth double bond between carbons of the fatty acyl chain [59-61], a role compatible with the observation in this study. This provides proof-of-principle evidence that these approaches deliver robust and interpretable evidence. We further discriminated path models connecting rs1260326
in GCKR to TC through phosphatidylcholines. GCKR
encodes a glucokinase regulatory protein that inhibits glucokinase in liver and pancreatic islet cells by binding non-covalently to form an inactive complex with the en-zyme. The locus has been shown to have a pleiotropic effect on multiple cardio-metabolic phenotypes [15,24,52-56].
We postulate here that GCKR SNP rs1260326 affects
TC through regulation of phosphatidylcholine metabol-ism, a hypothesis that needs to be validated in experi-mental settings.
Conditional analysis is a commonly used approach to show dependencies between the variables of the unadjusted model and the variable being adjusted for. However, the dif-ferent results between unadjusted and adjusted models might be due to reverse causation or confounding rather than causation. One of the most widely applied causal infer-ence approaches is MR. If the direction of the association is previously known between two variables (for example, a metabolite and a lipid in a SNP-MET-LIP set), MR can measure the extent of the unconfounded causal relationship using genetic variants as instrumental variables. However,
in some –omics level studies, the direction of the associ-ation among variables cannot be easily assumed. To over-come this limitation of MR, we also applied SEM, which evaluates each hypothesis based upon the directional rela-tionship of variables by comparing it with all possible hy-potheses and infers the most likely causal relationship. By applying both SEM and MR to our dataset, we obtained significant support for our hypothesis on the direction and the degree of association in each SNP-MET-LIP set. Our framework suggests the usefulness of combined statistical methods as an exploratory tool to infer causal relationship from high-dimensional molecular data.
Although our approach helps to infer causation statisti-cally, it has limitations. In MR, the validation for all of the assumptions is not always feasible, although its violation could increase the bias [67]. MR also has relatively low statistical power and may be affected by weak instrument bias as only the small percentage of phenotypic variance is explained by single (or often multiple) genotypes for most complex traits. Using weak genetic instruments may cause biases [68]. Furthermore, traditional MR is limited in only testing specific sets of hypotheses. SEM provides a hypothesis-free approach that is complementary to MR, as it enumerates all possible models and infers causality from the most likely model. However, it may mislead causal inference in the presence of unknown confounders [46] or measurement errors [69]. Finally, the use of BIC scores to select the most likely model may represent a fur-ther limitation of the model. A recent study showed that the new causal model selection test (CMST test) outper-forms BIC in terms of statistical precision, although it has lower statistical power [20]. More generally, both MR and SEM in our suggestive framework are designed to detect only linear relationships and targeted on a small set of variables, which were statistically significantly cross-associated with one another (that is, SNP-MET-LIP set). Thus, this framework cannot be readily applied to
Table 3 Summary of known evidence or hypothesis on the functional and biological role of metabolites for each of the three lipid loci
Locus Metabolite class Functional and biological evidence
GCKR Phosphatidylcholine GCKRencodes a glucokinase regulatory protein that inhibits glucokinase in liver and pancreatic islet cells by binding non-covalently to form an inactive complex with the enzyme. The locus has been shown to have a pleiotropic effect on multiple cardio-metabolic phenotypes [15,24,52-56]. We postulate here that GCKR SNPs affect TC through regulation of phosphatidylcholine metabolism, a hypothesis that needs to be validated in experimental settings.
LPA Carnitine A connection between Lp(a) and carnitine has been shown before. Derosaet al.[57] observed a statistically significantly decreased plasma Lp(a) concentration after L-carnitine intake of up to six month . Moreover, after a coadministration of simvastatin and carnitine the reduction in Lp(a) was significanty greater than after simvastatin medication alone [58].
FADS1 Phosphatidylcholine TheFADS1-2-3gene cluster encodes for fatty acid desaturase enzymes regulating the desaturation of fatty acids by adding double bonds between carbons of the fatty acyl chain [59-61]. Whereas FADS1 modifies the efficiency of the fatty acid delta-5 desaturase reaction, FADS2 modifies the fatty acid delta-6 desaturase reaction. GWAS of polyunsaturated fatty acids have shown associations between different fatty acids and theFADS1-2-3
complex dataset where hundreds or thousands of variables are linearly and non-linearly related.
Recent papers based on Gaussian graphical models or Bayesian networks [42,43,70-72] take into account all the observed variables of a dataset to infer direct correlation or directional correlation. For example, the IDA method (Intervention-calculus when the DAG is Absent) estimates total causal effects from all the observed variables using PC algorithm and intervention calculus [42]. Although these approaches are still at risk of being misled by un-known confounders and measurement errors, in contrast to MR, adding more meaningful observed variables to the model may help to robustly handle unaccounted-for fac-tors or high correlations among variables. Our future studies will include improving the statistical framework shown here, to be more adequate for increasingly multiple high-dimensional datasets (such as -omics datasets). On another note, well-designed simulation studies would be beneficial to understand and hopefully overcome the limi-tations of each of causal methods introduced in this paper.
Conclusions
Biological systems are clearly far more complex than rela-tively simple sets of equations. However, new insights on underlying biological processes can be obtained from the analysis of data generated in a highly standardized manner and the careful choice of model variables. We showed that, with the use of appropriate statistical instruments, we could dissect the contribution of metabolites assessed through high-throughput molecular profiling to complex biological pathways. The application of these methods to loci identified in large-scale associations of genome-wide SNP data will provide powerful tools for dissecting meta-bolic pathways at a wide range of complex trait loci. Pre-liminary studies exploring metabolic signatures associated with hypertension [73,74], myocardial ischemia [75], and others [76,77] will aid the dissection of genetic and envir-onmental causes of cardio-metabolic disease. The applica-tion of metabolomics profiling to samples from large population cohorts, stratified by known risk factors or ex-posures, may thus provide alternative and powerful de-signs to test causal relationships while minimizing the impact of clinical confounding variables [77], and new av-enues to improve prediction of clinical outcomes.
Additional files
Additional file 1: Table S1.Description of study samples.Table S2. Characteristics of metabolites analyzed in this study.Table S3.SNP quality metrics in KORA and TwinsUK.Table S4.Metabolite-lipid correlation metrics.Table S5.Results of conditional analysis.Table S6. Results of Mendelian randomization.Table S7.Results of structural equation modeling.Table S8.Skewness of metabolites in 38 significant SNP-MET-LIP sets tested.
Additional file 2: Figure S1.Metabolite-lipid correlation heat maps. Heat map plot of metabolite-lipid correlation combined with a hierarchical clustering to show six main groups of metabolites showing similar patterns of correlation with main lipids. The groups are separated by the heavy black line in the heat map and labeled 1 to 6 from top to bottom. The metabolites in each group can be found in the table below.
Competing interests
The authors declare that they have no competing interests.
Authors’contributions
Data analysis: SYS, AKP, CG, and NS. Manuscript preparation: SYS, AKP, CG, and NS. Provision of data or materials: SW, GZ, WRM, KSS, AD, AP, EG, CP, RWS, H-EW, MHdeA, TI, JA, PD, TDS, and KS. All authors read and approved the final manuscript.
Acknowledgements
We thank George Davey Smith, Caroline Relton, Heather Cordell, Stephen Burgess, and four anonymous reviewers for their helpful comments and suggestions.
KORA.The KORA (Kooperative Gesundheitsforschung in der Region Augsburg) research platform and the MONICA (Monitoring trends and determinants on cardiovascular diseases) Augsburg studies were initiated and financed by the Helmholtz Zentrum München - National Research Center for Environmental Health, which is funded by the German Federal Ministry of Education, Science, Research and Technology and by the State of Bavaria. Part of this work was financed by the German National Genome Research Network (NGFNPlus: 01GS0823) by the Munich Center of Health Sciences (MC Health) as part of LMUinnovativ. We acknowledge the contributions of P. Lichtner, G. Eckstein, G. Fischer, T. Strom, and all other members of the Helmholtz Zentrum München genotyping staff in generating the SNP dataset, T. Halex and A. Sabunchi to the metabolomics measurements, and of all members of the field staffs who were involved in the planning and conduct of the MONICA and KORA Augsburg studies. The KORA group consists of H-EW (speaker), A. Peters, C. Meisinger, TI, R. Holle, J. John, and their co-workers who are responsible for the design and conduct of the KORA studies. Finally, we thank all participants of the KORA and the TwinsUK studies.
TwinsUK.The study was funded by the Wellcome Trust is supported by the Wellcome Trust (Grant Codes WT098051 and WT091310) and the EU FP7 (EPIGENESYS Grant Code 257082 and BLUEPRINT Grant Code HEALTH-F5-2011-282510). The study also receives support from the National Institute for Health Research (NIHR) BioResource Clinical Research Facility and Biomedical Research Centre based at Guy’s and St Thomas’NHS Foundation Trust and King’s College London. Tim Spector is holder of an ERC Advanced Principal Investigator award*. SNP Genotyping was performed by the Wellcome Trust Sanger Institute and National Eye Institute via NIH/CIDR. We thank the staff from the Genotyping Facilities at the Wellcome Trust Sanger Institute for sample preparation, Quality Control and Genotyping; Le Centre National de Génotypage, France; Duke University, North Carolina, USA; and the Finnish Institute of Molecular Medicine, Finnish Genome Center, University of Helsinki. Genotyping was also performed by CIDR as part of an NEI/NIH project grant.
Personal.SYS is supported by a Post-Doctoral Research Fellowship from the Oak Foundation. AKP is supported by the ENGAGE Exchange and Mobility Program (HEALTH-F4-2007-201413). WRM is supported by BMBF grant 03IS2061B (project Gani_Med). PD’s work forms part of the research themes contributing to the translational research portfolio of Barts Cardiovascular Biomedical Research Unit, which is supported and funded by the National Institute for Health Research. KS is supported by‘Biomedical Research Program’funds at Weill Cornell Medical College in Qatar, a program funded by Qatar Foundation.
Author details 1
Wellcome Trust Sanger Institute, Genome Campus, Hinxton CB10 1HH, UK.
2MRC Integrative Epidemiology Unit (IEU), University of Bristol, Bristol, UK. 3
Institute of Genetic Epidemiology, Helmholtz Zentrum München, Neuherberg D-85764, Germany.4Research Unit of Molecular Epidemiology,
Helmholtz Zentrum München, Neuherberg D-85764, Germany.5Institute of Epidemiology II, Helmholtz Zentrum München, Neuherberg D-85764,
Shinet al. Genome Medicine2014,6:25 Page 13 of 16
Germany.6German Center for Diabetes Research (DZD), Neuherberg,
Germany.7Department of Twin Research & Genetic Epidemiology, King’s College London, London SE1 7EH, UK.8Discipline of Genetics, Faculty of
Medicine, Memorial University of Newfoundland, Newfoundland, Canada.
9Institute of Bioinformatics and Systems Biology, Helmholtz Zentrum
München, Neuherberg D-85764, Germany.10Institute of Epidemiology I, Helmholtz Zentrum München, Neuherberg D-85764, Germany.11Institute of
Epidemiology II, Helmholtz Zentrum München, Neuherberg D-85764, Germany.12Respiratory Epidemiology, Occupational Medicine and Public
Health, Imperial College London, London SW3 6LR, UK.13Department of Human Genetics, McGill University, Montreal H3A 1A5, Canada.14Genome
Quebec Innovation Centre, McGill University, Montreal H3A 1A5, Canada.
15Institute of Experimental Genetics, Genome Analysis Center, Helmholtz
Zentrum München, Neuherberg D-85764, Germany.16Institute of Medical Informatics, Biometry and Epidemiology, Chair of Epidemiology, Ludwig-Maximilians-Universität, München D-81377, Germany.17Klinikum Grosshadern, München D-81377, Germany.18Institute of Experimental
Genetics, Life and Food Science Center Weihenstephan, Technische Universität München, Freising D-85354, Germany.19Hannover Unified
Biobank, Hannover Medical School, Carl-Neuberg-Straße 1, 30625 Hannover, Germany.20Willian Harvey Research Institute, Barts and The London School
of Medicine and Dentistry, Queen Mary University of London, London EC1M 6BQ, UK.21Princess Al-Jawhara Al-Brahim Centre of Excellence in Research of
Hereditary Disorders (PACER-HD), King Abdulaziz University, Jeddah 21589, Saudi Arabia.22Department of Physiology and Biophysics, Weill Cornell
Medical College in Qatar, Education City - Qatar Foundation, Doha, Qatar.
23Department of Hematology, Long Road, Cambridge CB2 0PT, UK.
Received: 7 November 2013 Accepted: 14 March 2014 Published: 28 March 2014
References
1. Nicholson JK, Lindon JC:Systems biology: Metabonomics.Nature2008, 455:1054–1056.
2. Veenstra TD:Metabolomics: the final frontier?Genome Med2012,4:40. 3. Dettmer K, Aronov PA, Hammock BD:Mass spectrometry-based
metabolomics.Mass Spectrom Rev2007,26:51–78.
4. Wang TJ, Larson MG, Vasan RS, Cheng S, Rhee EP, McCabe E, Lewis GD, Fox CS, Jacques PF, Fernandez C, O’Donnell CJ, Carr SA, Mootha VK, Florez JC, Souza A, Melander O, Clish CB, Gerszten RE:Metabolite profiles and the risk of developing diabetes.Nat Med2011,17:448–453.
5. Suhre K, Gieger C:Genetic variation in metabolic phenotypes: study designs and applications.Nat Rev Genet2012,13:759–769.
6. Kettunen J, Tukiainen T, Sarin AP, Ortega-Alonso A, Tikkanen E, Lyytikainen LP, Kangas AJ, Soininen P, Wurtz P, Silander K, Dick DM, Rose RJ, Savolainen MJ, Viikari J, Kähönen M, Lehtimäki T, Pietiläinen KH, Inouye M, McCarthy MI, Jula A, Eriksson J, Raitakari OT, Salomaa V, Kaprio J, Järvelin MR, Peltonen L, Perola M, Freimer NB, Ala-Korpela M, Palotie A,et al:Genome-wide association study identifies multiple loci influencing human serum metabolite levels.Nat Genet2012,44:269–276.
7. Nicholson G, Rantalainen M, Li JV, Maher AD, Malmodin D, Ahmadi KR, Faber JH, Barrett A, Min JL, Rayner NW, Toft H, Krestyaninova M, Viksna J, Neogi SG, Dumas ME, Sarkans U, The MolPAGE Consortium, Donnelly P, Illig T, Adamski J, Suhre K, Allen M, Zondervan KT, Spector TD, Nicholson JK, Lindon JC, Baunsgaard D, Holmes E, McCarthy MI, Holmes CC:A genome-wide metabolic QTL analysis in Europeans implicates two loci shaped by recent positive selection.PLoS Genet2011,7:e1002270.
8. Suhre K, Wallaschofski H, Raffler J, Friedrich N, Haring R, Michael K, Wasner C, Krebs A, Kronenberg F, Chang D, Meisinger C, Wichmann HE, Hoffmann W, Völzke H, Völker U, Teumer A, Biffar R, Kocher T, Felix SB, Illig T, Kroemer HK, Gieger C, Römisch-Margl W, Nauck M:A genome-wide association study of metabolic traits in human urine.Nat Genet2011,43:565–569. 9. Suhre K, Shin SY, Petersen AK, Mohney RP, Meredith D, Wagele B, Altmaier
E, Deloukas P, Erdmann J, Grundberg E, Hammond CJ, Hrabé de Angelis M, Kastenmüller G, Köttgen A, Kronenberg F, Mangino M, Meisinger C, Meitinger T, Mewes HW, Milburn MV, Prehn C, Raffler J, Ried JS, Römisch-Margl W, Samani NJ, Small KS, Wichmann HE, Zhai G, Illig T, Spector TD,
et al:Human metabolic individuality in biomedical and pharmaceutical research.Nature2011,477:54–60.
10. Illig T, Gieger C, Zhai G, Romisch-Margl W, Wang-Sattler R, Prehn C, Altmaier E, Kastenmuller G, Kato BS, Mewes HW, Meitinger T, Hrabé de Angelis M,
Kronenberg F, Soranzo N, Wichmann HE, Spector TD, Adamski J, Suhre K:A genome-wide perspective of genetic variation in human metabolism. Nat Genet2010,42:137–141.
11. Gieger C, Geistlinger L, Altmaier E, Hrabe De Angelis M, Kronenberg F, Meitinger T, Mewes HW, Wichmann HE, Weinberger KM, Adamski J, Illig T, Suhre K:Genetics meets metabolomics: a genome-wide association study of metabolite profiles in human serum.PLoS Genet2008,4:e1000282. 12. Tanaka T, Shen J, Abecasis GR, Kisialiou A, Ordovas JM, Guralnik JM,
Singleton A, Bandinelli S, Cherubini A, Arnett D, Tsai MY, Ferrucci L: Genome-wide association study of plasma polyunsaturated fatty acids in the InCHIANTI Study.PLoS Genet2009,5:e1000338.
13. Hicks AA, Pramstaller PP, Johansson A, Vitart V, Rudan I, Ugocsai P, Aulchenko Y, Franklin CS, Liebisch G, Erdmann J, Jonasson I, Zorkoltseva IV, Pattaro C, Hayward C, Isaacs A, Hengstenberg C, Campbell S, Gnewuch C, A. Cecile JWJ, Kirichenko AV, König IR, Marroni F, Polasek O, Demirkan A, Kolcic I, Schwienbacher C, Igl W, Biloglav Z, Witteman JCM, Pichler I,et al:Genetic determinants of circulating sphingolipid concentrations in European populations.PLoS Genet2009,5:e1000672.
14. Demirkan A, van Duijn CM, Ugocsai P, Isaacs A, Pramstaller PP, Liebisch G, Wilson JF, Johansson A, Rudan I, Aulchenko YS, Kirichenko AV, A. Cecile JWJ, Jansen RC, Gnewuch C, Domingues FS, Pattaro C, Wild SH, Jonasson I, Polasek O, Zorkoltseva IV, Hofman A, Karssen LC, Struchalin M, Floyd J, Igl W, Biloglav Z, Broer L, Pfeufer A, Pichler I, Campbell S,et al:Genome-wide association study identifies novel loci associated with circulating phospho- and sphingolipid concentrations.PLoS Genet2012,8:e1002490. 15. Kathiresan S, Willer CJ, Peloso GM, Demissie S, Musunuru K, Schadt EE,
Kaplan L, Bennett D, Li Y, Tanaka T, Voight BF, Bonnycastle LL, Jackson AU, Crawford G, Surti A, Guiducci C, Burtt NP, Parish S, Clarke R, Zelenika D, Kubalanza KA, Morken MA, Scott LJ, Stringham HM, Galan P, Swift AJ, Kuusisto J, Bergman RN, Sundvall J, Laakso M,et al:Common variants at 30 loci contribute to polygenic dyslipidemia.Nat Genet2009,41:56–65. 16. Teslovich TM, Musunuru K, Smith AV, Edmondson AC, Stylianou IM, Koseki M,
Pirruccello JP, Ripatti S, Chasman DI, Willer CJ, Johansen CT, Fouchier SW, Isaacs A, Peloso GM, Barbalic M, Ricketts SL, Bis JC, Aulchenko YS, Thorleifsson G, Feitosa MF, Chambers J, Melander MO, Melander O, Johnson T, Li X, Guo X, Li M, Cho YS, Go MJ, Kim YJ:Biological, clinical and population relevance of 95 loci for blood lipids.Nature2010,466:707–713.
17. Davey Smith G, Ebrahim S:‘Mendelian randomization’: can genetic epidemiology contribute to understanding environmental determinants of disease?Int J Epidemiol2003,32:1–22.
18. Li R, Tsaih SW, Shockley K, Stylianou IM, Wergedal J, Paigen B, Churchill GA: Structural model analysis of multiple quantitative traits.PLoS Genet2006, 2:e114.
19. Baron RM, Kenny DA:The moderator-mediator variable distinction in social psychological research - conceptual, strategic, and statistical considerations.J Pers Soc Psychol1986,51:1173–1182.
20. Neto E, Broman A, Keller M, Attie A, Zhang B, Zhu J, Yandell B:Modeling causality for pairs of phenotypes in system genetics.Genetics2013, 193:1003–1013.
21. Wichmann HE, Gieger C, Illig T:KORA-gen–resource for population genetics, controls and a broad spectrum of disease phenotypes. Gesundheitswesen2005,67:S26–S30.
22. Howie BN, Donnelly P, Marchini J:A flexible and accurate genotype imputation method for the next generation of genome-wide association studies.PLoS Genet2009,5:e1000529.
23. Moayyeri A, Hammond CJ, Valdes AM, Spector TD:Cohort Profile: TwinsUK and Healthy Ageing Twin Study.Int J Epidemiol2012,42:76–85. 24. Saxena R, Hivert MF, Langenberg C, Tanaka T, Pankow JS, Vollenweider P,
Lyssenko V, Bouatia-Naji N, Dupuis J, Jackson AU, Kao WH, Li M, Glazer NL, Manning AK, Luan J, Stringham HM, Prokopenko I, Johnson T, Grarup N, Boesgaard TW, Lecoeur C, Shrader P, O'Connell J, Ingelsson E, Couper DJ, Rice K, Song K, Andreasen CH, Dina C, Köttgen A,et al:Genetic variation in GIPR influences the glucose and insulin responses to an oral glucose challenge.Nat Genet2010,42:142–148.
![Figure 1 SEM models. The figure shows all 10 possible path models for a cross-associated set of a SNP, a metabolite or ratio, and a serum lipid, conditioned on the paths originating from the SNP [18]](https://thumb-us.123doks.com/thumbv2/123dok_us/263242.1519314/6.892.86.808.133.429/figure-figure-possible-models-associated-metabolite-conditioned-originating.webp)