Article
1
A New Binarization Algorithm for Historical
2
Documents
3
Marcos Almeida 1, *, Rafael Lins 1,2, Bruno Lima 1, Rodrigo Bernardino 1, Darlisson Jesus 1
4
1 Federal University of Pernambuco, Recife-PE, Brazil
5
2 Federal Rural University of Pernambuco; Recife-PE, Brazil
6
* Correspondence: [email protected]; Tel.: +55-81-2126-7129
7
Abstract: Monochromatic documents claim for much less computer bandwidth for network
8
transmission and storage space than their color or even grayscale equivalent. The binarization of
9
historical documents is far more complex than recent ones as paper aging, color, texture,
10
translucidity, stains, back-to-front interference, kind and color of ink used in handwritting, printing
11
process, digitalization process, etc. are some of the factors that affect binarization. This article
12
presents a new binarization algorithm for historical documents. The new global filter proposed is
13
performed in four steps: filtering the image using a bilateral filter, splitting image into the RGB
14
components, decision-making for each RGB channel based on an adaptive binarization method
15
inspired by Otsu's method with a choice of the threshold level, and classification of the binarized
16
images to decide which of the RGB components best preserved the document information in the
17
foreground. The quantitative and qualitative assessment made with 21 binarization algorithms in
18
three sets of “real world” documents showed very good results.
19
Keywords: documents; binarization; back-to-front interference; bleeding
20
21
1. Introduction
22
Binary documents claim for far less storage space and computer bandwidth for network
23
transmission than color or grayscale documents. Document image binarization plays an important
24
role in the document image analysis, compression, transcription, and recognition pipeline. Historical
25
documents drastically increase the degree of difficulty for binarization algorithms. Physical noises
26
[1] such as stains and paper aging affect the performance of binarization algorithms. Besides that,
27
historical documents were often typed or written on both sides of sheets of paper and the opacity of
28
the paper is often such as to allow the back printing or writing to be visualized on the front side. This
29
kind of “noise”, first called back-to-front interference [2], was later known as bleeding or show-though [3].
30
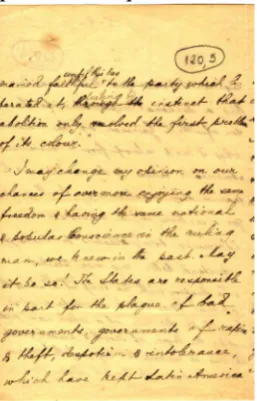
Figure 1 presents an example of a document with such a noise. If the document is exhibited either in
31
true-color or gray-scale, the human brain is able to filter out that sort of noise keeping its readability.
32
Depending on the strength of the interference present, that depends on the opacity of the paper, its
33
permeability, the kind and degree of fluidity of the ink used, the degree of difficulty for obtaining
34
good segmentation capable of filtering-out such a noise increases enormously, as new set of hues of
35
paper and printing colors appear. The direct application of binarization algorithms may yield a
36
completely unreadable document, as the interfering ink of the backside of the paper overlaps with
37
the binary one in the foreground. Several document image compression schemes for color images are
38
based on “adding color” to a binary image. Such compression strategy is unable to handle documents
39
with back-to-front interference [4]. OCRs are also unable to work properly for such documents.
40
Several algorithms were developed specifically to binarize documents with back-to-front interference
41
[2] [3][5-8].
42
There is no binarization technique to be an all case winner as many parameters may interfere in
43
the quality of the resulting image [8]. The development of new binarization algorithms is still an
44
important research topic. International competitions on binarization algorithms, such as DIBCO -
45
Document Image Binarization Competition [9], are an evidence of the relevance of this area. Having
46
quantitative criteria to choose which is the best binarization algorithm, in terms of image quality and
47
performance, for a specific image is of paramount importance.
48
49
Figure 1. Historical document from Nabuco bequest with back-to-front interference.
50
This paper presents a new global filter to binarize documents, which is able to remove the
back-51
to-front noise in a wide range of documents. Quantitative and qualitative assessments made in a wide
52
variety of documents (late 19th century to present, both printed and handwritten, using a different
53
kind of paper, ink, etc.) allow to witness the efficiency of the proposed scheme.
54
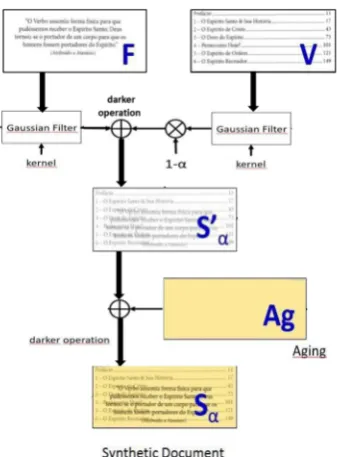
2. The New Algorithm
55
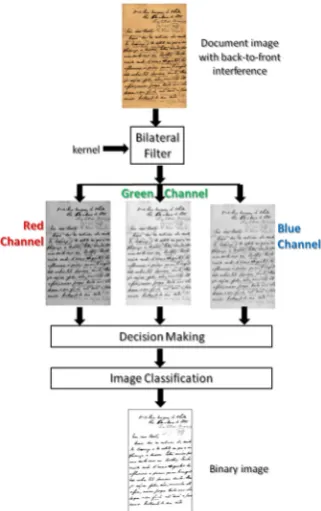
The algorithm proposed here is performed in four steps: filtering the image using a bilateral
56
filter, splitting image into the RGB components, decision-making for each RGB channel based on an
57
adaptive binarization method inspired by Otsu's method with a choice of the threshold level, and
58
classification of the binarized images to decide which of the RGB components best preserved the
59
document information in the foreground. Figure 2 presents the block diagram of the proposed
60
algorithm [10]. The functionality of each block is detailed as follows.
61
2.1. The Bilateral Filter
62
The bilateral filter was first introduced by Aurich and Weule [11] under the name “nonlinear
63
Gaussian filter”. It was later rediscovered by Tomasi and Manduchi [12] who called it the “bilateral
64
66
Figure 2. Block diagram of the proposed algorithm.
67
The bilateral filter is technique to smoothen images while preserving their edges. The filter
68
output at each pixel is a weighted average of its neighbors. The weight assigned to each neighbor
69
decreases with both the distance values among pixels of the image plane (the spatial domain S) and
70
the distance on the intensity axis (the range domain R). The filter applies spatial weighted averaging
71
without smoothing the edges. It combines two Gaussian filters; one filter works in the spatial domain,
72
the other filter works in the intensity domain. Therefore, not only the spatial distance but also the
73
intensity distance is important for the determination of weights. The bilateral filter combines two
74
stages of filtering. These are the geometric closeness (i.e., filter domain) and the photometric
75
similarity (i.e., filter range) among pixels in an NxN window size. For a pixel (x,y), the output of a
76
bilateral filter can be as described by equation:
77
x, y ∑
| | | | , ,
,
, , , (1)
where I(x,y) is the pixel intensity in the image before applying the bilateral filter, IBF(x,y) is the
78
resulting pixel intensity after applying the bilateral filter, , is the coordinates of the pixels
79
encompassed in the bilateral filter window, K is a normalization constant:
80
K ∑
| | | | , ,
,
, , . (2)
Equations (1) and (2) how that the bilateral filter has three parameters. The parameters δd (filter
81
domain) and δr (filter range) are
|| || || ||
and
|| || || ||
, respectively. The third
82
parameter is the window size NxN.
83
The geometric spread of the bilateral filter is controlled by δd. As δd is increased, more
84
neighbours are combined in the diffusion process resulting in a more “smooth” image, while δr
85
represents the photometric spreading. Only pixels with a percentage difference of less than δr are
86
processed [13].
87
2.2. The Decision Making Block
88
After passing through the bilateral filter, the image is split into its Red, Green and Blue
89
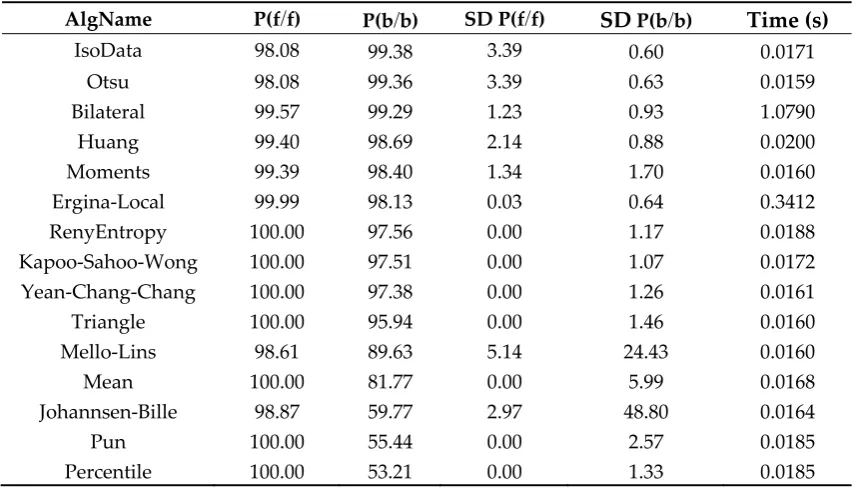
components, as shown the block diagram in Figure 2. Once the RGB channels are generated, the
90
decision making block is applied to process and the optimal threshold is calculated for each RGB
91
function that needs to be optimized in the decision-making block, mapping background pixels
93
(paper) from the original image onto white pixels of the binary image. It depends of all the parameters
94
of the original image texture, strength of the back to front interference (simulated by the coefficient
95
α), paper translucidity, etc. for each RGB channel. Thus, one can represent this dependence as:
96
P(b/b) = f(α,R,G,B).
(3)
The optimal threshold t* for each channel is calculated in the decision-making block, maximizing
97
P(b/b):
98
t* = MaxP(b/b),
(4)
subject to a given criterion P(f/f) ≥ M. The criterion used here was M=97%, that is at most 3% of the
99
foreground pixels may be incorrectly mapped. The matrix of co-occurrence probability is calculated
100
and the decision maker chooses the best binary image. The decision-making block was trained with
101
32,000 synthetic images in such a way to, given a real image to be binarized it finds the optimal
102
threshold parameters. The generation of the synthetic images is explained below.
103
2.3. Generating synthetic images
104
The Decision-Making Block needs training to “learn” about the optimal threshold parameters.
105
Such training must be done using controlled images which are synthesized to mimic the different
106
degrees of back-to-front interference, paper aging, paper translucidity, etc. Figure 3 presents the block
107
diagram for the generation of synthetic images. Two binary images of documents of different nature
108
(typed, handwritten with different pens, printed, etc.) are taken: F – front and V – verso (back). The
109
front image is blurred with a weak Gaussian filter to simulate the digitalization noise [1], the hues
110
that appear in after document scanning.
111
112
Figure 3. Block diagram of the scheme for the generation of synthetic images for the Decision-Making
113
Block.
114
The verso image is “blurred” by passing through two different Gaussian filters that simulate the
115
low-pass effect of the translucidity of the verso as seen in the front part of the paper. Two different
116
parameters were used to simulate two different classes of paper translucidity, this parameter is
117
currently being changed for ten. The “blurred” verso image is now faded with a coefficient α varying
118
between 0 and 1 in steps of 0.01. The two images are overlapped by performing a “darker” operation
119
pixel-by-pixel in the images. Paper texture is added to the image to simulate the effect of document
120
aging. The texture pattern was extracted from document from late 19th century to the year 2000. The
analysis of 3,450 documents representative of a wide variety of documents of such a period was
122
analyzed yielding 100 different clusters of textures. The synthetic texture to be applied to the image
123
to simulate paper aging is generated using those 100 clusters by image quilting [14] and randomly,
124
as explained in reference [8]. The training performed in the current version of the algorithm presented
125
was made with 16 of those 200 synthetic textures. The total number of images used for training here
126
was thus 16 (textures), times 100 (0< α <1 in steps of 0.01), times 2 blur parameters for the Gaussian
127
filters, times 10 different binary images, totaling 32,000 images. Details of the full generation process
128
of the synthetic image database are out of the scope of this paper and may be found in reference [8].
129
2.4. Image Classification
130
The image classification block analyses the three binary images in each of the channels and
131
outputs the one that is considered the best one. The decision was made by an “intelligent” naïve
132
Bayes automatic classifier which was trained using the 32,000 synthetic images by comparing each of
133
them with the original ground truth image, the Front image.
134
3. Experiments and Results
135
As already explained, the enormous variety of kinds of text documents makes extremely
136
improbable that one single algorithm is able to satisfactorily binarize all kinds of documents.
137
Depending on the nature (or degree of complexity) of the image several or no algorithm will be able
138
to provide good results. This paper follows the assessment methodology proposed in reference [8].
139
Twenty-one binarization algorithms were tested using the methodology described:
140
1. DaSilva-Lins-Rocha [5]
141
2. Intermodes [15]
142
3. Ergina-Local [33]
143
4. IsoData [16]
144
5. Johannsen-Bille [17]
145
6. Kapur-Sahoo-Wong [18]
146
7. Li-Tam [19]
147
8. Mean [20]
148
9. Mello-Lins [4]
149
10. MinError [21]
150
11. Minimum (variation of [15])
151
12. Mixture-Modeling [22]
152
13. Moments [23]
153
14. Otsu [24]
154
15. Percentile [25]
155
16. Pun [26]
156
17. RenyEntropy (variation of [18])
157
18. Shanbhag [27]
158
19. Triangle [28]
159
20. Wu-Lu [29]
160
21. Yean-Chang-Chang [30]
161
A ground-truth image for each “real” world one is needed to allow a quantitative assessment of
162
the quality of the final binary image. Only the DIBCO dataset [9] had ground-truth images available.
163
This makes the assessment task of real-world images extremely difficult [32]. All care must be taken
164
to guarantee the fairness of the process. The ground-truth images for the other datasets were
165
generated by applying the 21 algorithms above and the bilateral algorithm to all the test images in
166
the Nabuco and LiveMemory datasets. Visual inspection was made to choose the best binary image
167
in a blind process, a process in which the people who selected the best image did not know which
168
algorithm generated it. To increase the degree of fairness and the number of filtering possibilities, the
169
three component images produced by the Decision Making block were all analyzed. The binary
170
as ground-truth image for the assessment below. All the processing time figures presented in this
172
paper are from Intel i7-4510U@ 2.00GHzx2, 8GB RAM, running Linux Mint 18.2 64-bit. All algorithms
173
were coded in Java, possibly by their authors.
174
3.1. The Nabuco dataset
175
The Nabuco bequest encompasses about 6,500 letters and postcards written and typed by
176
Joaquim Nabuco [6], totaling about 30,000 pages. The images were digitalized by the second author
177
of this paper and the historians of the Joaquim Nabuco Foundation using a table scanner in 200 dpi
178
resolution in true color (24 bits per pixel), back in 1992 to 1994. Due to serious storage limitations
179
then, images were saved in the jpeg format with 1% loss. The historians in the project concluded that
180
150 dpi resolution would suffice to represent all the graphical elements in the documents, but choice
181
of the 200 dpi resolution was made to be compatible with the FAX devices widely used then. About
182
200 of the documents in the Nabuco bequest exhibited back-to-front interference. The 15 document
183
images used in this dataset were chosen for being representative of the diversity of documents in
184
such universe.
185
Table 1 presents the quantitative results obtained for all the documents in this dataset. P(f/f)
186
stands for the number of foreground pixels in the ground truth image mapped onto black pixels in
187
the binarized image. P(b/b) is the number of background pixels in the ground-truth image mapped
188
onto white pixels of the binary image. The SDP(f/f) and SDP(b/b) the standard deviation of P(f/f) and
189
P(b/b). The time corresponds to the mean processing time elapsed by the algorithm to process the
190
images in this dataset. The results were ranked in P(f/f) decreasing order.
191
Table 1. Binarization results for images from Nabuco bequest.
192
AlgName P(f/f) P(b/b) SD P(f/f) SD P(b/b) Time (s)
IsoData 98.08 99.38 3.39 0.60 0.0171
Otsu 98.08 99.36 3.39 0.63 0.0159
Bilateral 99.57 99.29 1.23 0.93 1.0790
Huang 99.40 98.69 2.14 0.88 0.0200
Moments 99.39 98.40 1.34 1.70 0.0160
Ergina-Local 99.99 98.13 0.03 0.64 0.3412
RenyEntropy 100.00 97.56 0.00 1.17 0.0188
Kapoo-Sahoo-Wong 100.00 97.51 0.00 1.07 0.0172
Yean-Chang-Chang 100.00 97.38 0.00 1.26 0.0161
Triangle 100.00 95.94 0.00 1.46 0.0160
Mello-Lins 98.61 89.63 5.14 24.43 0.0160
Mean 100.00 81.77 0.00 5.99 0.0168
Johannsen-Bille 98.87 59.77 2.97 48.80 0.0164
Pun 100.00 55.44 0.00 2.57 0.0185
Percentile 100.00 53.21 0.00 1.33 0.0185
193
The results presented in Table 1 shows the bilateral filter in third place for this dataset in terms
194
of image quality, however the standard deviation is much lower than the two first. That implies that
195
it is a more stable documents among the various images in this dataset. Figure 4 presents the
196
document for which the bilateral filter presented the worst results in terms of image quality with two
197
199
Figure 4 – Historical document from Nabuco bequest with the worst binarization results for the
200
bilateral filter with zoom from original and binary parts
201
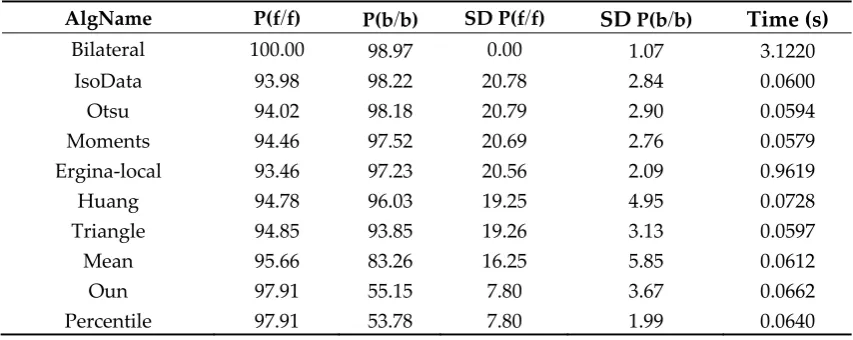
3.2. The LiveMemory dataset
202
This dataset encompasses 15 documents with 200 dpi resolution selected from the over 8,000
203
documents from the LiveMemory project that created a digital library with all the proceedings of
204
technical events from the Brazilian Telecommunications Society. The original proceedings were offset
205
printed from documents either from typed or electronically produced. Table 2 presents the
206
performance results for the 10 best ranked algorithms. The bilateral filter obtained the best results in
207
terms of image filtering. It is in worth observing that the image quality degraded for all the
208
algorithms. The shaded area due to the hard bound spine of the volumes of the proceedings, as one
209
can see in Figure 5, were possibly the responsible for such lower quality results.
210
Table 2. Binarization results for images from the LiveMemory project.
211
AlgName P(f/f) P(b/b) SD P(f/f) SD P(b/b) Time (s)
Bilateral 100.00 98.97 0.00 1.07 3.1220
IsoData 93.98 98.22 20.78 2.84 0.0600
Otsu 94.02 98.18 20.79 2.90 0.0594
Moments 94.46 97.52 20.69 2.76 0.0579
Ergina-local 93.46 97.23 20.56 2.09 0.9619
Huang 94.78 96.03 19.25 4.95 0.0728
Triangle 94.85 93.85 19.26 3.13 0.0597
Mean 95.66 83.26 16.25 5.85 0.0612
Oun 97.91 55.15 7.80 3.67 0.0662
Percentile 97.91 53.78 7.80 1.99 0.0640
212
213
214
215
216
217
218
219
220
221
222
223
Figure 5 –LiveMemory with the worst binarization results for the bilateral filter with original and
224
226
3.3. The DIBCO dataset
227
This dataset has all the 86 images from the Digital Image Binarization Contest from 2009 to 2016.
228
Table 3 presents the results obtained. The performance of the bilateral filter in this set may be
229
considered poor. The reason for that is possibly that all the training images for the bilateral filter were
230
300 dpi synthetic images, while the DIBCO images are very small sized high-resolution images.
231
Figure 6 presents the DIBCO image for which the bilateral filter presented the worst binarization
232
results.
233
Table 3. Binarization results for images from DIBCO.
234
AlgName P(f/f) P(b/b) SD P(f/f) SD P(b/b) Time (s)
Ergina-local 91.37 99.88 6.25 1.89 0.1844
RenyEntropy 90.13 96.77 14.19 3.50 0.0125
Yean-Chang-Chang 90.61 96.16 14.44 4.35 0.0112
Moments 90.75 95.80 9.91 5.19 0.0112
Bilateral 92.99 90.78 9.06 16.01 0.6099
Huang 95.62 84.22 6.37 18.36 0.0147
Triangle 96.40 80.80 5.72 23.32 0.0113
Mean 99.35 78.99 1.14 9.35 0.0115
MinError 92.79 74.29 23.46 19.36 0.0115
Pun 99.68 56.20 0.82 6.18 0.0122
Percentile 99.71 55.06 0.72 3.58 0.0121
235
236
237
Figure 6 – Document from DIBCO with the worst binarization results for the bilateral filter
238
4. Conclusions
239
Historical documents are far more difficult to binarize as several factors such as paper texture,
240
aging, thickness, tranlucidity, permability, the kind of ink, its fluidity, color, aging, etc all may
241
influence the performance of the algorithms. Besides all that, many historical documents were written
242
or printed on both sides of translucent paper, giving rise to the back-to-front interference. This paper
243
presents a new binarization scheme based on the bilateral filter. Experiments performed in three
244
datasets of “real world” historical documents with twenty one other binarization algorithms showed
245
that the proposed algorithm yields good quality monochromatic images that may compensate its
246
high computational cost. This paper provides evidence that no binarization algorithm is an
“all-kind-247
of-document” winner, as the performance of the algorithms varied depending of the specific features
248
of each document. A much larger test set of synthetic about 250,000 images is currently under
249
development, such a test set will allow much better training of the Decision Making and Image
250
Classifier blocks of the bilateral algorithm presented. The authors of this paper are promoting a
251
scanned documents using over 5.4 million synthetic images in the DIB-Document Image Binarization
253
platform. An image matcher is also being developed and trained with that large set of images, in
254
order to whenever fed with a real world image, to be able to match with the most similar synthetic
255
one. Once made that match, the most suitable binarization algorithms are immediately known. If this
256
paper were accepted, all the test images and algorithms will be included in the DIBplatform. The
257
preliminary version of the DIB-Document Image Binarization platform and website is publically
258
available at www.cin.ufpe.br/~dib.
259
Acknowledgments: The authors of this paper are grateful for those who made the code of their algorithms
260
publically available for testing and performance analysis and to the DIBCO team from making their images
261
publically available. The authors also acknowledge the partial financial support of to CNPq and CAPES -
262
Brazilian Government.
263
References
264
1. Lins, R.D. A Taxonomy for Noise in Images of Paper Documents - The Physical Noises. ICIAR2009, Volume
265
5627.pp. 844-854.
266
2. Lins, R.D. at al. An Environment for Processing Images of Historical Documents. Microproc. and
267
Microprogramming 1995. pp. 111-121.
268
3. Sharma, G. Show-trough cancellation in scans of duplex printed documents. IEEE Transaction Image
269
Processing 2001. Volume 10. N. 5, pp. 736-754.
270
4. Mello, C. A. B. and Lins, R. D. Generation of Images of Historical Documents by Composition. Symp. On
271
Document Engineering 2002. pp. 127-133.
272
5. Silva, M. M., Lins, R. D., Rocha, V. C. Binarizing and Filtering Historical Documents with Back-to-Front
273
Interference. ACM Symposium on Applied Computing2006, pp. 853-858.
274
6. Lins, R. D. Nabuco – Two Decades of Processing Historical Documents in Latin America. Journal of Universal
275
Computer Science2011Volume 17. N. 1, pp. 151-161.
276
7. Roe, E. and Mello, C. A. B. Binarization of Color Historical Document Images Using Local Image
277
Equalization and XDoG. 12th International Conference on Document Analysis and Recognition2013. pp. 205-209.
278
8. Lins, R.D., Almeida, M. A. M., Bernardino, R. B., Jesus, D., Oliveira, J. M. Assessing Binarization Techniques
279
for Document Images. In Proceedings of ACM Symposium on Document Engineering, Valetta, Malta2017.
280
9. DIBCO.
281
10. Almeida, M. A. M. Statistical Analysis Applied to Data Classification and Image Filtering. Doctorate,
282
Federal University of Pernambuco, Recife-PE, Brazil, 21 December 2016.
283
11. Aurich, V. and Weule, J. B. Non-linear gaussian filters performing edge preserving diffusion. In Proceedings
284
of the DAGM Symposium1995. pp. 538 - 545.
285
12. Tomasi, C. and Manduchi, R. Bilateral filtering for gray and color images. In IEEE Proc. 6th International
286
Conference on Computer Vision1998. pp. 836-846.
287
13. Paris, P., Kornprobst, P., Tumblim, J., Durand, F. Bilateral Filtering: Theory and Applic. Found. Trends in
288
Comp. Graphics and Vision2008. Volume 4. N. 1, pp. 1-73.
289
14. Efros, A. A. and Freeman, W. T. Image quilting for texture synthesis and transfer. SIGGRAPH ’01 28th
290
Annual Conference on Computer Graphics and Interactive Techniques2001. pp. 341-346.
291
15. Prewitt, M. S. and Mendelsohn, M. L. The Analysis of Cell Images. Ann. N. Y. Acad. Sci. 1996. Volume 128,
292
N. 3, pp. 836-846.
293
16. Ridler, T. W. and Calvard, S. Picture Thresholding Using an Iterative Selection Method. IEEE Trans.
294
Systems, Man., and Cybernetics1978. Volume 8, N. 8, pp. 630-632.
295
17. Johannsen, G. and Bille, J. A. A Threshold Selection Method Using Information Measure. ICPR’82 – 6th
296
International Conference on Pattern Recognition1982. pp. 140-143.
297
18. Kapur, N., Sahoo, P. K., Wong, A. K. C. A New Method for Gray-Level Picture Thresholding Using the
298
Entropy of the Histogram. C. Vision Graphics and Image Processing1985. Volume 29, pp. 273-285.
299
19. Li, C. H. and Tam, P. K. S. An iterative algorithm for minimum cross entropy thresholding. Pattern
300
Recognition Letters1998. Volume 19, N. 8, pp. 771-776.
301
20. Glasbey, C. A. An analysis of histogram-based thresholding algorithms. CVGIP: Graphical Models and Image
302
Processing1993. Volume 55, pp. 532-537.
303
21. Kittler, J. and Illingworth, J. Minimum error thresholding. Pattern Recognition1986. Volume 19, N. 1, pp.
41-304
22. Title of Site. Available online: https://imagej.nih.gov/ij/plugins/mixture-modeling.html (accessed on 24
306
October 2017).
307
23. Tsai, W. H. Moment-preserving thresholding: A new approach. Computer Vision, Graphics, and Image
308
Processing1985. Volume 29, N. 3, pp. 377-393.
309
24. Otsu, N. A Threshold Selection Method from Gray-Level Histograms. IEEE Transaction on Systems, Man and
310
Cybernetics1979. Volume SMC-9, N. 1, pp. 62-66.
311
25. Doyle, W. Operation useful for similarity-invariant pattern recognition. Journal of the Association for
312
Computing Machinery1962. Volume 9, pp. 259-267.
313
26. Pun, T. Entropic Thresholding, A New Approach. Computer Vision Graphics, and Image Processing1981. pp.
314
210-239.
315
27. Shanbhag, A. G. G. Utilization of Information Measure as a Means of Image Thresholding. Computer Vision
316
Graphics, and Image Processing1994. Volume 56, N. 5, pp. 414-419.
317
28. Zack, G. W., Rogers, W. E., Latt, S. A. Automatic measurement of sister chromatid exchange frequency.
318
Journal Histochem Cytochem1977. Volume 25, N. 7, pp. 741-753.
319
29. Wu, U. L., Songde, A., Haqing, L. U. A. An Effective Entropic Thresholding for Ultrasonic Imaging.
320
International Conference Pattern Recognition 1998. pp. 1522-1524.
321
30. Yen, J. C., Chang, F. J., Chang, S. A New Criterion for Automatic Multilevel Thresholding. IEEE transaction
322
Image Process IP-4 1995. pp. 370-378.
323
31. Lins, R. D., Silva, G. F. P., Torreão, G., Alves, N. F. Efficiently Generating Digital Libraries of Proceedings
324
with The LiveMemory Platform. In: IEEE International Telecommunications Symposium, IEEE Press 2010. pp.
325
119-125.
326
32. Ntirogiannis, K., Gatos, B., Pratikakis, I. Performance Evaluation Methodology for Historical Document
327
Image Binarization. IEEE Transaction Image Process 2013. Volume 22, N. 2, pp. 595-609.
328
33. Kavallieratou, Ergina, and Stamatatos Stathis, Adaptive binarization of historical document images. Pattern
329
2006, ICPR 2006. 18th International Conference on. Volume 3, IEEE, 2006.
330