Lincoln
University
Digital
Thesis
Copyright
Statement
The
digital
copy
of
this
thesis
is
protected
by
the
Copyright
Act
1994
(New
Zealand).
This
thesis
may
be
consulted
by
you,
provided
you
comply
with
the
provisions
of
the
Act
and
the
following
conditions
of
use:
you
will
use
the
copy
only
for
the
purposes
of
research
or
private
study
you
will
recognise
the
author's
right
to
be
identified
as
the
author
of
the
thesis
and
due
acknowledgement
will
be
made
to
the
author
where
appropriate
you
will
obtain
the
author's
permission
before
publishing
any
material
from
the
thesis.
Small seCtions of Chapter 3 has been published in:
(1) W.A.P. Isaac, G.D. Hill, B.A. McKenzie, C. Frampton,
&
G.W.Bourdot-Effect of Crop Morphology and Density on Crop and Weed Productivity.
In
Agronomy New Zealand (Unpublished)(2) Wendy A.P. ISAAC!, George D. HILL!, Bruce A. McKENZIE! & Graeme W. BOURDOT2
The effect of grain legume species and density on crop and weed growth
For the 4th European Conference on Grain Legumes (Unpublished)--..'
. ~,.-.
.
CONTRIBUTION OF CROP MORPHOLOGICAL
CHARACTERISTICS AND DENSITY OF SELECTED
CROPS TO WEED SPECIES COMPOSITION AND
SUPPRESSION
A thesis
submitted in partial fulfilment
of the requirements for the Degree of
Master of Applied Science
at
Lincoln University
by
Wendy Ann P. Isaac
Lincoln University
2001
-•... .. . ~ "-.... ;.:.
~~~i~~;~~~~~;~ ,...-,'
.(-.-;:~.
I·
Abstract of a thesis submitted in partial fulfilment of the requirements for the degree of M.AppI.Sc.
Contribution of Crop Morphological Characteristics and Density of
Selected Crops to Weed Species Composition and Suppression
by
Wendy Ann P. ISH3c
A field study ,vas conducted at Lincoln University during the 1999-2000 growing season to investigate the effect of crop species and smving density on weed dynamics. productivity and species composition. Crops with a spreading (narrow-leafed lupin. LlIpinlls al1gllslijolills and dwarf French bean. flwseo/lis vlIlgaris). rosette (turnip. Brassica wl71pesiris and· forage rape. Bmssim l1aplls) and upright (maize. Zea muys. and ryecorn. Sem/e cerea/e) growth habits were smvn at 0.0.0.5. 1.0 . .1.0 and 4.0 times their optimum population. No other weed control measures were applied.
The six crops were sown on 8 September 1999 (early spring): narrow-leafed lupin. ryecorn and forage rape on and 4 November 1999 (early summer): dwarf French bean. maize and turnip. The weed seed bank prior to smving was predominated by
('oroI10jJlIS dic(rl71 liS.
There were significant differences in the suppressive ability of the different crop species and different crop populations (p < 0.00 I). Weed dry matter (OM) \\las lowest in turnip (0.58 g/m2) and highest in dwarf French bean (1.13.50 g/m2) at final harvest.
By final harvest crop density had a marked effect on weed OM production. There was decreased weed OM at higher plant populations in all crop species. except turnip. at all plant populations. However. there were differences between 0.5 and 4.0 x optimum populations in bean (397 and 12 g/m2). rape (I S9 and 26 g/m2). lupin (1.15 and 7 g/m\ maize ( 106 and 0 g/m2) and ryecorn (51 and I g g/m2).
Weed suppressIOn as affected by the diflerent crop treatments ,·vas directly
-(RUE). The highest LArs were recorded in turnip (4.1) at 60 DAS. \\lhile other crops such as bean and maize attained LAI's of only 0.66 and 1.1 respectively by the same time. Leaf area index increased with increased plant population in [III crops. Leaf area index in turnip at 60 DAS mnged from 3.5 at 0.5 x optimum populmion to 5.1 [It 4.0 x
optimum population. In maize LAI ranged from 0.4 to 2.0 at the smne plant populations at the same time.
Canopy closure occurred at 50 DAS in turnip at 4.0 x optimum population. at 60 OAS for lupin. ryecorn [lnd rape and at 83 OAS fiJr maize [lnd bean. Canopy closure \V[lS never attained [It 0.5 x optimum population in lupin. rape. ryecorn. bean and maize.
Turnip intercepted the most solar radiation (SR) at I 06g M.I/m~. \.vhich was 354
MJ/m~ more than bean. which intercepted the least photosynthetic [lctive radiation
(PAR). Total intercepted PAR also increased with increased plant population. There was a strong linear relationship between cumulative intercepted PAR and cumulative OlVI yield in [Ill crops. Maize produced more DrvI per fvl.! of intercepted PAR than all the other crops at _~.4 g OM MJ PAR-I whereas lupin. ryecorn. rape. bean and turnip produced 1.7. 1.2. O.9X and 0.37 g OM PAR -I respectively.
Crops \vith large leaf size and mpid growth were effective in reducing the weed seed bank. weed species and numbers in the following growing season. The most effective reduction OCCUlTed with turnip follmvecl by l11[1ize (55 [lnd 66 x I oj seed/m~
respectively) compared with lupin and rape which conwined the highest (ISS and 130 x
I O'~ seeds/m~ respectively). \Veed seed production \Vas markecily [lffectecl by plant
population (p < 0.05). Higher plant popul[ltions (2.0 and 4.0 x optimum population) of I upin. rape. ryecorn and maize effectively suppressed weed seed production. Lower plant popUlations (0.5 and LO x optimum population) contained higher weed seed
numbers/m~ in lupin. rape. ryecorn. bean and maize plots. ('o/'()/1Olm.\" dic~vl11lfS was the
most abundant species in the weed seed bank in the 2000-growing se[lson.
'vVeed seed ling emergence in the 2000-growi ng season al so rei1ected prevIous crop tre[ltments. Be[ln contained the highest ,,'eed seedling density (1.163 weed
seedlings/I11~) and turnip the least (109 weed seedling/m\ As pl[lnl population
increased from 0.0 to 4.0 x optimum population weed density decreased. The decrease was most pronounced in lupin (1.128 to 466 \.veeci seedlings/I11~). rape ( 1.082 to 319
II
weed seedlings/m2) and ryecorn (1.308 to 362 weed seedlings/m2). Chenopodillm
alhum was the most abundant weed species to emerge during the 2000. growing season.
A mechanistic model of crop and weed growth was tested for its ability to simulate DM accumulation of weed and crop in lupin. rape and ryecorn and used SR and LAI data. The model accurately predicted crop and weed Ol'vI for lupin. rape and ryecorn grown at the 4 crop densities. The model could be of practical value in predicting the potential weed OM yield under different crop species at different plant densities.
The results sllggested that inclusion of large leaf size and rapid growth in selection of crop as competitors to suppress \veeds by using crops sllch as turnip: maize and ryecorn should be feasible in a \\ieed management program.
Keywords: I1LIITO\Y-leafed luj)in. (LlIpil1l1S ol1glls/if()IiIlS). dwarf French bean.
(Plwseoills I'II/gori.I). turnip (Bf'{fssico campes/ris). /'orage rape (/3mssica 110p1lS) maize.
(Zco l77ays). ryl'L'orn (S('co/e cereale). Tr(fh/illl77 r('pens. (·O/'()110pII.I di(ZvJJ7l1s. leaf area
1.1 1.2 1.3 2.1 I I 2.4
Table of Contents
Abstract
Table of Contents List of Figures List of Tables List of Plates
List of Abbreviations List of Appendices
Chapter One General Introduction Background Justification Research objectives Chapter Two Literature Review Introduction
The distribution of problem weed species in Canterbury. The dynamics of ,veed populations.
Crop losses clue to weeds.
2.4.1 Weed-crop competition and interference 2.4.2 [J'j'ccts of weed interference on crop yield The LIse
or
models for crop-weed interactions2.6 Eflect of morphological and agronomic characteristics of crops on weed suppression
2.7
2.6.1 Effect of crops on weed suppression,
2.6.2 Interaction of cultivar. row spacing and planting density on weeds Conclusions Chapter Three Page IV vii x xii xiii xiv 2 .., J 4 7 10 12 12 14 15 18 18 II
"Veed suppression and crop yield effects of different densities and of crops canopy architectm'es
3.1
.., ")
-,
.-'-J ntroduction
Materials and methods
29
IV
. , .
:-, ... :-,_ .•.• l..
" . '. . .
3.4 3.5 4.1 4.2 4.3 4.4 4.5 4.6 3.2.1 3.2.2
Experimental site and preparation Experimental design .., ') .., J._.J 3.2.4 3.2.5 Results Crop protection Measurements Analysis
3.3.1 El1\'ironment
3.3.:2 Plant population
:1.3.3 Dry matter production 3.3.4 Seed yield
3.3.5 Harvest Index
3.3.6 Leaf area index. radiation interception and radiation LIse efJiciency
Discussion Conclusions
Chapter Four
Evaluation of a mechanistic model of crop and weed growth
Introduction
Materials and methods Measurements
4.3.1 Image acquisition and analysis 4.3.2 Statistical anal vsis
Results
4.4.1 Ground cover from digital images 4.4.2 Crop dry matter accumulation 4.4.3 Weed dr\' matter accumulation 4.4.4 (irollnd coyer
Discllssion
4.5.1 Digital image analysis
4.5.2 A mechanistic model for crop groyvth 4.5.3 A mechanistic model for weed grO\,vth Conclusions
29
29
30 30 ..,..,_J J
Chapter Five
The effect of' crop morphology and density on the species composition of' a weed community
5.1 Introduction
5.2 Materials and methods 5.2.1 jvleasurements 5.3 Data analvsis
5A Results and discussion
5.4.1 Soil seed bank analysis
5.4.2 Weed seedling emergence and species composition 5.4 C one I liS ions
6.1
Chapter Six
General Discussion
6.2 Weed suppression by crops: di,crsity and composition of the weed communit\.
6.3
7.1
Modelling of crop type ane! weed growth Chapter Seven
General Conclusions
Conclusions
7.1.1 FITl'Cl
or
crop morphology and densil~' on crop and \veedproducti,ity
7.1.2 :. ItH.lcliing of crop and weed growth
7.1.3 Erket of crop morphology and density on diversity and composition of the weed community
7.2 Recommendations for future research
Acknowledgmcnts References
Appendiccs
89 90 90 92 93 93 100
1"7 .J_
134 138
139
139
139
139
140
142
144
159
VI
- ... ~>:.
,;~<;;~<~::~: ::::~~~:~:~:..:.:.;,:
, .. ~-:. ". ~-'.~ ..
~ -'.
,.
r __ ... _ .-.
, -"-";'.'
List of Figures Figure
2.1
2.2
3.1
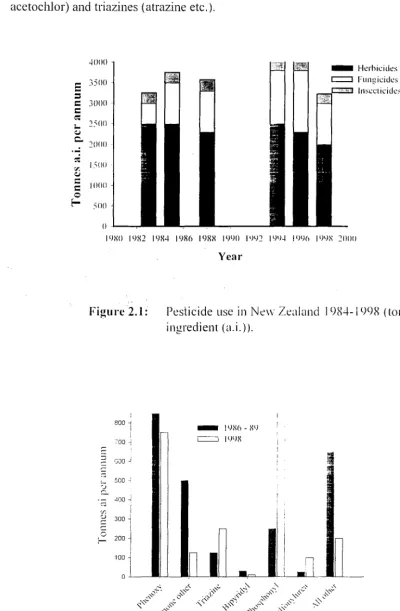
Pesticide use in New Zealand 1984-1998 (tonnes of active ingredient (a.i.)).
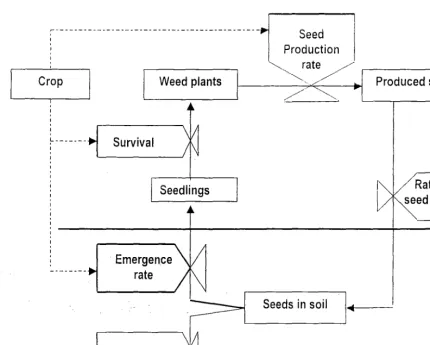
Herbicide lise by class - comparison between I L)~6-X9 ~lIld 1998.
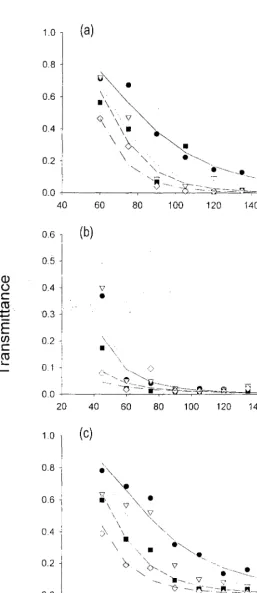
Schematic representation of a population dynamics model for weeds. Broken lines indicate processes where crop and weeds interact.
V.,leather pattern for the September to April experimental period. 1999-2000 and the long term means (L TM) from Broadfields iv!eteorological station.
The dry matter accumulation of the early sO\vn crops (a) crop and (b) weed at 0.5. 1.0. 2.0. and 4.0 x optimum populmion over the growing
season 1999/2000.
3.3 The dry matter accumulation of the late So\\,"11 crops (a) crop and (b)
weed at 0.5. 1 .
.0.
2.0. and 4.0 x optimum population over the growingPage
5
5
12
34
38
season! 999/2000. 39
3.4 The relationship between crop yield and total weed dry matter present at tinal harvest for rape and bean. No crop control. 0.5. 1.0. 2.0. and 4.0 x
optimum population. 44
3.5 Weed dry matter as a percentage ofTDM at relative sowing density (0.5.
1.0. 2.0 and 4.0 .\ optimum plant population) ror the early (lupin. rape.
ryecorn) and late sown crops (bean. turnip. maize) at lInal harvest. 45
3.6 Total crop and weed productivity as affected by relatiw so\\"ing density and crop harvest index. (Total crop and weed (TDfv!). crop OM. \veed
OM. seed yield and harvest index for lupin and bean. 46
:3.7 Total crop and weed productivity as affected by relative sO\:ving density and crop harvest index. (Total crop and weed (TOr'll!). crop Dl'vl. \veed
Drvl. seed yield. and harvest index for ryecorn ~lI1d maize. 47
3.8 Total crop and weed productivity as affected by relative sowing density. (Total crop and weed (TOM). crop OIvl and weed OIvl. for rape and
turnip). 48
3.9 Relationship betw'een seed yield and crop DM I'or (a) lupin and (b)
maize. 0.5. 1.0. 2.0. 4.0 x optimum population. 49
3.10 Relationship between seed yield and weed 01,,1 fnr (a) lupin and (b)
maize. 0.5. 1.0. :2.0.4.0 x optimum population. 50
.:1.11 The relationship bet\\"een weed biomass and LAI rnr rCIJ1l' anci maize.
0.5. 1.0.2.0.4.0.\ optimum population. 51
.--... :.~<..;;-.;..~ t~~~~~j~~~~~
3.12 The changes in LAI for 6 crops at 0.5. 1.0. 2.0. 4.0 X optimum
population over the growing season 1999/2000. 56
3.13 Relationship between leaf area index and the proportion of intercepted radiation for the early sown crops in the 1999/2000 growing season.
J .14 Relationship bet\veen leaf area index ancl the proportion of intercepted
57
radiation of the late sown crops in the 1999/2000 growing season. 58 3.15 The relationship between accumulated orvi and intercepted PAR for
lupin. rape and ryecorn at 0.5. 1.0.2.0 and 4.0 x optimum populations. 59 3.16
3.17
3.18
4.1
4.2
-+ . .J ..,
The relationship between accumulated bean. turnip. and maIze at 0.5. population.
DM and intercepted PAR for 1.0. 2.0. -J..O X llptil11um
The fraction of light transmitted through the canopy to the soil surface as . a function of days after so\ving (DAS) for the early sown crops. 0.5. 1.0. 2.0. 4.0 X optimum population over the grO\\'ing season 1999/2000. (a)
lupin. (b) rape and (c) ryecorn.
The fraction of light transmitted through the canop~( to the soil as a
function of days after sovving (DAS) for the late sown crops. 0.5. 1.0. 2.0. 4.0 x optimum population over the grO\ving season 1999/2000. (a) bean. (b) turnip and (c) maize.
Ground cOYer (as a proportion) by crop and "'eed from the digital images over time from 26 - 60 days after emergence. 0.5. 1.0. 2.0. and 4.0 x optimum population.
The proportion of weed ground cover hom digital images ror the three crops at four plant populations.
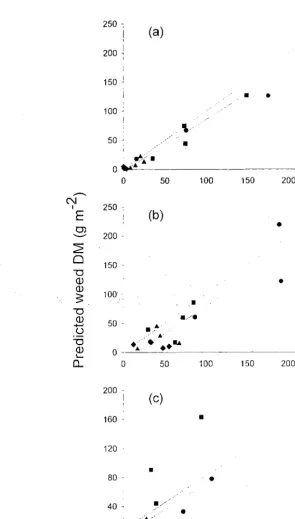
S il11ulated and measured crop dry matte I' (0 IV!) accum ul ation for lupi n.
rape and ryecorn at the 0.5 and 4.0 x optimum population.
Observed versus predicted crop dry matter (Divl) accumulation for three crops at four plant populations 0.5. 1.0. 2.0 and 4.0 x optimum population.
4.5 The effect of crop density on the dry matler (UiVI) accumulation of weeds.
4.6
4.7
Observed versus predicted weed dry matter (DIVI) accumulation for three crops at four plant populations 0.5. 1.0. 2.0 and 4.0 x optimum population.
The relationship between ground cover (GC) and lear area Index (LAI) for the crop and the weed for rape and ryecorn at ().5 .\ llplimum
population.
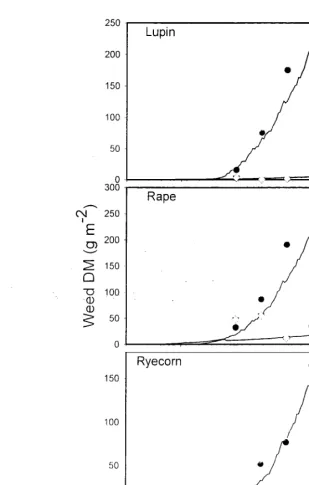
5.1 Weed Dl'vl (g/l1l") for the early and late sown crops at (J.O. ().s. I.U. 2.0 and 4.0 :\ optimum population in the 1999/2000 gnming season (tinal
60
61
62
76
77
80
81
82
83
84
harvest).
5.2 Anagallis ((/"vensis DM production over time for 5 crop treatments and the no crop control at 0.5, 1.0. 2.0 and 4.0
x
optimum population over101
the growing season 1999/2000. No crop control sovving I and sowing 2. 105
5.3 Trif()/iul71 repel1s DM production over time for 6 crop treatments. 0.5. 1.0. 2.0. and 4.0 x optimum population over the growing season
1999/2000. No crop control sowing I and sow'ing 2. 106
5.4 Coronoplls dic~vl7111s DM production over time for 5 crop treatments at
four densities. 0.5, 1.0, 2.0. and 4.0 x optimum population over the
growing season 1999/2000. No crop control sowing 1 and sowing 2. 107
5.5 Dry matter contribution of total (a) annuals and perennials. and (b) hroadleaved and grassy \\leeds in the 1999/2000 growing season for each
crop species. NC - No crop control and S - sowing. 108
5.6 fv1ultivariate analysis of weed species in the 1999/2000 growing season
for lupin. rape. ryecorn. bean anclmaize treatments. 116
S.7 Effect of preceding crop type on the total weed population 111 winter
2000. ' 117
5.8 Effect of relative crop sowing density on the total weed population for
winter weeds (2000) at 0.0.0.5. 1.0.2.0 and 4.0 x optimum population. 118
5.9 The 7 major \\ieed species populations under the 6 crop treatments and
no crop control in winter :2000. 119
5.10 Dry matter contribution of annual and perennial weeds in the different
crop treatments. 120
5.11 The efTect of crop type on total \,veed population 111 the 2000/2001
growll1g season.
5.12 Effect of relative so\ving density on the total ,,'eeci population 111
122
Table
:2. I
:1. I
3.4
3.5
3.6
5.1
List of Tables
New Zealand national herbicide use in \'arious sectors tLlr 1 99!-;.
Expected number of plants/m2 and the actual plant establishment at 60 days after smving.
The interaction between crop density and species on crop and \·veed dry matter at 60 DAS (g/m2) inthe 199912000 gro\Ving season.
The interaction bet\veen crop density and species on crop and ,veed dry matter at tinal harvest (g/m2) in 1999/2000 growing season.
Orthogonal contrasts of weed dry matter (g/m2) under crop treatments at
60 DAS and final harvests in the 199912000 growing season.
Regression model of fraction of light transmitted through the canopy as a function of days after planting for 6 crops.
Total intercepted radiatiori and radiation use efticiency (RUE) of 6 crop species at four plant populations in the 1999/:20()() growing season.
The percentage composition of weed seeds. b:- species in soil seed bank hefore cultivation in September 1999.
5.:2 Weed seed numbers x 103 1 1112 in September 200() lor early smvn crops
(lupin. rape. ryecorn).
5.3 \\ieed seed numbers x 10J 1 m2 in September 2000 for late so\vn crops
(bean. turnip and maize).
5.4 Botanical and common names of all weeds recorded in the different crops. lupin. rape. ryecorn. beans. maize <Ind turnips in the 1999/2000 growmg season.
5.6
5.7
5.9
Weed species richness (number of weed species/treatment) Ic)!" the No crop controls. lupin. rape. ryecorn. bean. turnip and maize.
Weed species DMg/m2 in the 1999/2000 growing season ror the early sown crops (lupin. rape. and ryecorn) at tirst and tinal harvest.
Weed species OM g/m2 in the 1999/2000 growing season for the late sO\vn crops (bean. turnip and maize) at tirst and linal harn~sl.
\-Veed seedling numbers/m2 September :2000 i"or early'
SO\\ n crops (lupin.
rape and ryecorn).
Weed seedling l1umbers/m2 September :2000 I'or late s()\\n crops (hean. turnip and maize ).
- - . ' . ' :~~ :-:: ::::~~::~.,
Page
8
35
.f0
41
42
54
))
9.f
1 I ()
112
113
114
5.10 Percent of weed seeds that emerged for 6 weed species found in the
200012001 growing season. (Early sown plots - lupin. rape and ryecorn).
5.11 Percent of weed seeds that emerged for X weed species loulld ill the
129
2000/2001 growing season. (Late sown plo[s - beall. [urnip and maize). 130
5.12 Correlation coefficients for the relationship between seedling populations in 6 crop and the no crop control plots and estimates from weed seed extraction methods for 9 weed species t()Und in the
2000/2001 grovving season. 131
i
I
Plate
4.1
4.2
·L3
List of Plates
Digital camera used for taking digital images of crops.
This photo illustrates the four step procedure necessary to obtain the proportion of crop and weed pixels from computer software (a) green leaf material against soil background in picture frame of the computer program: (b) green leaf material (c) black ancl white I mage after
thresho I cling: (d) segmented image.
Digital im<.lges taken weekly for ryecorn <.It ..t.() :\ optimum population.
Page
70
71
72
CV
cv. DAE DAS df OM FC
GC GR ha HI
LAI LSD LTM
MJ
ns "C PAR PCA PPD % RSMD RUE SED SEM sp. SR
Temp.
List of Abbl'eviations
Coefficient of variation Cuitivar
Days after emergence Days after sowing degree of freedom Drv matter
Field capacity gram
Ground cover Growth rate hectare· Harvest index Kilogram Leaf area index
Least significant difference Long term mean
square meter Megajoule not significant degree Celsius
Photosynthetically active radiation Principle Component Analysis Plant Population Density Percentage
Root square mean difference Radiation use efficiency
Standard error of mean difference Standard error of mean
Species Solar radiation Tonne
Temperature
List of Appendices
Appendix
2
4
Herbicide use in use in three crops grown in Canterbury 1998/99.
Temperature from data loggers for air. crop canopy and soil in the 1999/2000 grO\ving season.
Seeds (t/ha). harvest index (HI) and pods per plant produced In gralJl
crops - lupin. ryecorn. bean and maize.
The simulation of ryecorn and ryecorn \veed (h'Y matter accumulation from the Excel spreadsheet at 0.5 x optimum population.
5 Differences in \veed species morphology with increasing plant.
Page
159
160
161
162
population for the ryecorn crop. 166
6
7
Winter weed species numbers found in July 2000 for different crop treatments under oat. (Early sown plots).
Winter \\ccc.l species numbers found in .lui\' 200() for different crop treatmel1ls under oat. (Late sown plots).
Weed species identitied and their lifespan.
167
168
169
xiv
,-1.1 Background
Chapter 1
General Introduction
Food losses due to weeds have been estimated at 20 % in most developing countries and about 10 % in developed countries. Losses due to weeds. if not curbed. are usually significantly higher than those caused by diseases or insect pests (Kropff and Walter. 2000). In a given year. these losses ultimately arise from the population dynamics. bi~logy and
ecology of both crop and weeds. particularly during their early development (Alteri. 1988). Weeds interfere adversely with cropping systems primarily by:
(1) reducing the growth and yield of crops due to competition for the limited resources of light water and nutrients;
(2) reducing the financial value of the product to be harvested. mainly by contaminating the crop produce. reducing its size and quality.
Thus. weeds must be controlled to avert financial losses as they reduce profits by lowering output increasing expenses and reduce quality.
The management of weeds was a key issue in agricultural production systems even before the advent of the herbicide revolution. Since their invention in the 1940's. herbicides and other high energy based inputs have resulted in the intensification of agriculture. particularly in developed countries. Since the introduction of herbicides in the mid- 1950·s. scientiiic research on weeds has mainly been herbicide driven (Van der Zweep and Hance, 2000). Extensive use of herbicides over the years. aimed at the total eradication of \\Teeds. has significantly alleviated weed problems in the short term (Alteri, 1988). However. heavy inputs and mis-use (in most cases stimulated by efforts in pursuit of short- . term gains by fanners) have been identified as major contributors to the destruction of fragile ecosystems in many countries. In addition to these environmental safety concerns. this heav), use and mis-use of herbicides has contributed to rapid vieed flora shifts and the development of herbicide resistance in many weed species (Bridgemohan. 1993).
These problems have in recent years prompted increased research into a more integrated approach to weed management and the lise of alternative methods for weed
.:.'.-."., ....
.. .,.. ... -... ~ "
~~;.t~~i~~i;
"----." .. rr:-:..:;--(
. ~ -'",
- ~.', .
'.--.':
control to reduce these negative effects. Instead of total eradication of weeds from the field, emphasis must now be on the management of weed populations. An understanding of the biology, ecology and population dynamics of weeds. and how they interact with the crop, is important for the development of an economically sound. integrated approach to weed management (Liebmann and Davis. 2000: Rahman et
(/1 ..
20(0).Successful \veed management as identitied by Regehr and Thomas (1994). is most readily attained where the knowledge of weed ancl crop biology. cultural practices that favour vigorous crop grO\vth. mechanical weed control. and herbicide technology are brought together in carefully planned systems. Such integrated weed management. he further explained is characterised by processes and practices that complement and'reinforce each other. to exploit \veaknesses in weed species. Liebmann and Davis (2000) emphasised the need to reduce the use of herbicides. They also stressed that Imv-external-input (LEI) farming systems should be employed to ameliorate economic and environmental effects. shifts in weed populations and communities. and the health risks of exposure to agrochemicals associated with conventional farming systems.
1.2
Justification
In Ne\v Zealand. as in many other developed countries. there is interest in reducing pesticide use and an increased interest in organic fanning (Seefeldt and Armstrong. 2000). Weeds however. continue to be a major concern in conventional farming systems as their control is still essentially by herbicides. These chemicals account for 68 % of the total pesticide active ingredient applied in New Zealand (Holland and Rahman. 1999). Despite the control methods presently used. crop losses caused by weeds are still of the same magnitude as those caused by pests and diseases Oerke el a/.. (1994). At a Symposium on 'Organic Farming. 2000' held in Christchurch. Ne\y Zealand scientists drew attention to the fact that weeds and their control is still underrated. They stressed the urgency of the need to address the problems associated with weeds by increased research into environmentally sound control techniques.
There is an extensive literature on the etlects of herbicides on \,veeds as well as on the competitive nature of weed on crops. However. there is a dearth of information on the phytotoxic effects of herbicides on crop yield and even less on the eftects of crops on weeds
:~::
(Lotz et aI., 1996; Kropff and Walker, 2000). In this context, the selection of crops as part of an integrated approach to weed management is particularly important. To select crops. which may be effective at controlling weeds, it is important to determine the morphological and physiological attributes. associated with their competitive ability. This could assist in breeding more competitive crops. \vhich could be Llsed in etfective crop rotations (Lermerle
el (f/., 1996 a). Additionally. other factors could be used :>~'nergistically \,vith crop
competitiveness to further enhance the crop' s competitive abi Ii ty over the weed such as varying the plant density and the spatial arrangement (Mal ik el (fl" 1993: Paolini el 01"
1999),
1.3 Research objectives
In response to the above concerns the following objectives were formulated:
The overall objective of the research was to identify the factors that regulate the ecology and dynamics of weed populations in response to crop morphology and density. To examine weed management strategies based on weed suppression by a range of morphologically different crops oyer a cropping season.
The study \vas planned to:
1. Assess the impact
or
crop type and population density on \veed-crop interactions and on the growth and dc\'clopment of the crop.! Study the erICe! or morphologically different crops on the weed species composition
and production and to identify those morphological crop characteristics that are desirable for suppression of weed growth,
3. Compare the performance of a simple simulation model \,vith independent tield data on the critical period of weed competition in early sown crops and to use the model to evaluate the in11uence of crop and \veed leaf area using comparisons yvith the crop biomass accumulation.
Chapter 2
Literature Review
2.1 Introduction
The intensification of agriculture during the last 5 decades would not have been possible without \videspread use of agrochemicals offering an effective and reliable method ohveed control. Increasing environmental concerns. the need for reduced costs. and increased herbicide resistance in weeds has prompted research in recent years on alternative. sustainable management systems that reduce the need for agrochemic·als.
A recent report by MAF (2000) found that there has been a decline in the use of hormone herbicides and mi increase in phosphonyl herbicides (mainly glyphosate). triazine and sulfonylurea herbicides in New Zealand. indicating the changes in land use (more forestry). and cost-effectiveness (more glyphosate and sulfonylurea). Herbicides. \vere the most commonly used pesticide reported. (2.143 t) accounting for 68 % of the lotal active pesticide ingredient applied. follO\ved by fungicides al 24 (% and insecticides at 8.2 % (Holland and Rahman. 1999). The phosphonyl herbicides (mainly glyphosate) were the largest class (831 t). followed by phenoxy hormone herbicides (743 t).
dithiocarbamate fungicides (366 t) and triazine herbicides (245 t)' The trends Jl1
pesticide use in Ne\y Zealand from 1984 to 1998 in t of active ingredient are shown in
Figure 2.1 and the changes in the uses of several important herbicide classes between 1986 and ]998 are shown in Figure 2.2.
Overall the trends show that the broad-spectrum phosphonyls. principally glyphosate now dominate in New Zealand. This could be attributed to their wide range of uses. high cost-effectiveness. low persistence in the soil and lack of ill effects on mammalian and human health and the environment. Phenoxy hormone herbicides have experienced a small drop in use. However. the use of 2.4-0 and ivlCP A for broadleaf weed control is still common and triazine herbicide use has increased lw 90 %. This dependency has been attributed to increased use in cropping and in forestry.
Herbicides. particularly phenoxies and sulphonyl ureas (eg. Glean). are used extensively for broad leaf weed control in cereal and herbage seed production in Canterbury. In field peas (PiSlIIl1 sa/ivlIIn). which is the major grain legume in Nev,;
Zealand herbicide. treatments are mainly with triazine ~ll1d phenoxy herbicides.
4
i:
!
Herbicides are the main pesticides used in maize (Z{'(/ IIlU.' 's): mainly umides (alachlor.
acetochJor) and triazines (atrazine etc,).
~()()O
E 350()
::I
=
JO()(I=
:.. ~.:'O{)
CJ
c:.. ~IH)()
.-:<; 151111
'"
CJ
=
=
101111 oE- 51111
o
_ Herbicides + l'(iRs
,....,.,."'~~ Insecticides
19XO 19X2 19X4 19X6 19XX 1990 I ()l)~ 1'I().j I'll)(, 1'Il)X 201H)
Figure 2.1:
i 800
"
i
i
~oo ~
~ GOO J
500 c ~
400
..
r:/)CJ 300
~ ~
, 0 200
100
0 e .
-Figure 2.2:
Year
Pesticide lise in New Zealand 19R4-19C)g (tonnes of active ingredient (a.i.)).
,
I
-
I'IX() -Xl)! I I (I'IX
11
!!II
!
, I i
i
n
I
••
i.n
Herbicide lise bv class - companson between 1986-89 and 1998.
:.-'-"-" . .;
.',--,Cr_~.L' ~ .• _",._
::"::.':'.;:~::::;::: ~.;c::~::;~S.:i:j.
-.-.c;".-:"::;'--Vegetable crops such as asparagus (A.\jJa/'{(glls otfjcillo/is). green pea (PiSIII17 sa/ivul11)
and sweet corn (Zeo mays) require heavy inputs of residual triazines. bromacil and
phenoxies to control weeds. Holland and Rahman (1999) noted that the amount of triazines used is high and there is a threat of leaching of their residues into ground water in areas with light. free-draining soils. Table 2.1 shows the herbicide use in the various farming sectors for 1998 and Appendix 1 shows herbicide use in .3 crops grown in Canterbury in 1998. 1999.
1 n pastoral farming there is evidence that the extensive usage of phenoxy hormone products for broadleaf control in pastures has increased the spectrum of weed species exhibiting resistance to these herbicides such as nodding thistle (Cardul/s
I1I1/al1s) (Harrington. 1988. 1989) and giant buttercup (RmwllclI/IIS oeris) (Bolirdot ef
o/., 1994. 1(96) in some areas.
In concluding statements in the [vIAF reporl. Holland and Rahman (1999) noted that herbicide is the most cost-effective technology for \\'eed control ~ll1d that often there
is no realisiic alternative, Hmvever. they highlighted [hat the .. tviAF should develop policies on pcsticidc use which are integrated for sustainable agriculture and which address the key issues of identifying unacceptable risks hom current use practices. development (If alternative plant protection strategies. encouraging safer pesticide handling and more targeted application. and increasing end user confidence to adopt alternative practices" (Holland and Rahman. 19(9),
Efforts ll1ust address the reduction in the extensive use
ur
herbicides USll1g alternative or a ll111re integrated approach to \veed management in New Zealand. This effort to control m:eds \vithout extensive herbicide inputs would consist of three components according to Lotz ef of .. (1995). The first component would be to control weeds only at the economic threshold level. in other words where weeds are controlled only if the cost of control measures is less than the increased return on yield. The second component \\'ould be to reduce the herbicide input through proper and selected application methods. By putting less pesticide into the environment. the risk of poll ution and \veed resistance is reduced. Bridgemohan ( 1l)93) noted that this can be achieved by banding application of herbicides. llsing low \'olul11es to improve glyphosate performance. proper timing of post emergence herbicides. use of herbicide combinations at low rates. use of newer. more active and more rapidly degraded herbicides. [n addition. chemical control can be replaced by alternative practices such as mechanical or biological weed control.A third component suggested by Lotz el ul .. lll)9:,)) involves the possibility of
decreasing the need for weed control by crop manipulation. This could be achieved by increasing the relative competitiveness of the crops in a rotation (e.g. by selecting more competitive cultivars or crops). or by optimising the competitive ability of the crop through general cropping practices (e.g. with respect to crop sowing date. crop density. and nitrogen supply). Recent research by Christensen et (fl .. (1994) and Grundy ef uf..
( 19(7) showed that both choice of crop and cullivar and crop ciensity can be etfective in suppressing weeds. Thus. herbicide inputs can be minimised. as lhere arc a number of morphological traits that confer specific crop cultivars with greater competitive ability with weeds. A thorough quantitative insight into the crop-weed interaction is needed to be able to predict yield losses. to assess risks of less effective control methods and to explore ideas to improve the relative competitive ability of crops.
At the Second International Weed Control Congress. in Copenhagen. Kropff el
ul .. (1996) stressed lhat for the development
or
ill1pro\'\:~cI weed management systems. with reduced dei)enclency on hei-bicides. an insight inlo the population dynamics of \veeds and the interactions between the crop and the \veeds is necessary. Such insighls they suggested may help to identity opportunities for new control lechniques that break weed life cycle at some point in time. to develop strategies for weed management.2.2 The distribution of problem weed species in Canterbury
Holm el 01 .. (1977) reported that. of the world's \\orSl \\ceds. TJ. (!.() arc
monocots. 44 (X) are perennials. 61 % reproduce vegetatively. and 33 (Yo reproduce by rhizomes. The most troublesome weeds in New Zealand \\we introduced from Australia. Asia. Europe. North and South America and Africa and arc now of economic significance. Forty four percent of these weeds are wild llowering planls (Parham and Healy. j (85). [vlany of these weeds include species thal in\'ade culti\'atcd. arable and
wasle lancls. gardens. road sicles. pastures. farm yarcis. sheep cLlmps ~1l1d low tussock
grasslands. Of the weeds that have invaded pastures ~1I1d ~lI'able lands in the South
Island. Chenopodium al/nllll. ('irsiull1 arl'el1se. RIIII/('x Cl'ispus. ('(lpseIILl hurso-posloris. Pol.1'gOJ1ull1 (f1'iculure. Tal'({XaClII71 officina/e. Solal1l1m l1ig/'l/ll/ Lind others appear to have become very successful weed species.
Table 2.1: New Zealand national herbicide use in various sectors for 1998. Sector
Arable farming
Cereals (\",heat & barley) Grass Seed
Legume Seed Field peas
IVlaize (grain & silage) Horticulture Apples Kiwifruit Grapes Vegetables Potatoes Onions Brassicas Green peas field tomatoes Pastoral
Sheep & beef Dairy
Forestry (year 011 and 2)
National acreage 120 26 14 20 28 1 5 10 10 14 5 4 10 I 11.890 1.270 205
AYerage Use (kg a.i.lha/annum) 156.000 XO.600 9.ROO 34.000 126.000 -iX.OOO 17.000 29.000 22.400 34.000 1.200 16.000 7.200
-i 75.600 355.600 820.000
AdapLed J"rom: Rc\'icII or Trends in AgriculLural PesLicides I ;sc in Nell 7.c,i/and. J\I..\F I'olie~' Technical Paper
l)l); II. MinisLry or Agriculture and Forestry (Holland and Rahman I ()l)l)).
Research on the weed t10ra associated \\'ith cereal crops (wheat (Triticllm oestil'lllJ1. cv. Otane and barley Hordeum "II/gor(', C\" Corniche) in C'anrerbury. New
Zealand by Bourdot et (II .. (1998) indicated that a total of 23 families were present. "vith the Asteraceae. Brassicaceae. Caryophyllaceae. Fabaceae. and Polygonaceae being the most predominant. Annuals were more common (29 taxa) than perennials (12 taxa). whereas biennials (4 taxa) were the least frequent. vVeecl population densities varied greatly among species. but there was less variation between : ears and crop type. In the weed survey conducted by Bourdot el (I/.. (1998) more than 57 weed species in more
8
than 49 genera were recorded. Of the most frequently occurnng weeds recorded.
Trifolium sp. (mainly Trij'olium repens), CopseI/o hu/,.\·u-pos!oris. Fiolo orvensis. Stelloria media. Polygonlll71 aviell/are. Chenopodilll7l a/hllm and Al1ogollis orl'ensis
present in mos1 of the crops sampled.
Chenopodi lim 01 hum (fathen) is one of the most wielely d istri buteel weed species
111 the world. In many countries. for instance. it is tht' principal wccd of barley and
chickpea (CiccI' ({ric! il1ul11): in the United States. it I s considered the rourth most
important weed in wheat (Harper and Gajic. 1961: Koch and I-less. I nO): and it ranks
among the top three important weeds in cereals in Ne\\ Zealand. Holms e!
(/1 ..
(1977)noted that this erect annual weed exhibits great plasticity III its response to the
environment when it is in the proximity of neighbouring plants. The plant can grow to a height of 3 m if it grows in crops such as corn (2L'({ /ll(/ys) and sorghum (Sorghllm hic()lor) where there is abundant availability of nutrients. and water. Ho\vever. in waste places the ,veed tends to be small and insigniiicant. In stud ics by' Plew (1994). Chenopodillm alhum dominated the weed spectrum primarily hecause of its ability to mature rapidly and seed prolifically Ovans and Taylor. 19R5). ('hL'110poc/iIIl11 o/hllm also
competed strongly with corn for nitrogen. potassium. calciulll and Illagnesium (Vengris.
1955).
('irsilllll ({/'1'L'17se (Californian thistle) is alsl) a major \\'ceLi . .lust one plant can colonise an area se\'eral square meters in diameter during thc lirst Ollt' or two seasons of
its growth. Small fragments of roots can also give rise to new plants, Hcnskens L'I ul"
( 1(96) suggested that its persistence can been attri buted to the possession of substantial below- ground reserves and adventitious root buds. This erect perennial herb together \vith its annllal relative species (', vlIlgare are or particular importance in the South Island of New Zealand \vhere they cause seriolls \ield losses in many crops such as barley. corn. and other cereals (Bourdot and Field. 19XX), A considerable amount of research has recentl\' been conducted 011 the colllrnl 01' this \\'el'd [)\' Bourdot e/ {f/" (1996. 2000).
Achilleo l11illej'o1illl71 (yarrow) is also considered a successful and aggressive weed that is C01111110n in arable land in Neyv Zealand. It causes signiticant crop losses in a \-ariety of crops (Bourdot and Field. 19R8) by choking them out due to its dense
growth habit. According to Henskens e! ul .. (1996). thl' \\cell \\as llriginally sown in
productive species. It was soon regarded as a weed of arable land. The success of this weed is attributable to its persistent and vigorous rhizomes (Hartley e/ ul.. 1984).
It is assumed that the differences among plant species in their morphology and pauerns of growth influence their ability to acqUIre resources and consequently their competitive abil i ty. Research by Gross el (/1.. (1992) on comparison or root morphology. grO\vth rate and topology of seedlings of 12 herbaceous weeds. including fathen and yarrow and others that occurred in early to mid-successional fields. revealed
signiticant differences among species that were largely related to their life history. They found that annuals grew faster and produced larger and more branched roots than biennials and perennials. Among the annuals. there was a positive correlation between seed mass and root growth. Grasses allocated proportionally more biomass to roots than the dicotyledons. bUl did nOl differ in their root length or branching.
2.3 The dynamics of weed populations
The development of integl:ated weed management systems that are economically sOLlnd requires a thorough understanding of the dynamics of weed populations (Walker
~Illd Buchanan. 19X2: Fernandez-Quintanilla. 19XX: Zimdhal Il)95). Rahman e/ (/1 ..
(2000) indicated that bio-economic weed management models. which use seed bank
estimates to predict weed popUlation dynamics anel competitin:ness provide a good starting point for an integrated weed management program. The analvsis of these populations is very complex as each population is composed oj' indi\'iduals in various functional stages. interacting with each other. with populations of other species and with the environment (Fernandez-Quintanilla. 1988). The major approaches that are a\'ailable for the ,1ll,lIysis of the population dynamics of weeds are ( 1 ) long-term studies \\here II single component of the population oj' a cenain weed is monilored over several
years. (2) demographic studies and (3) mechanistic model s.
Weed population dynamics refers mainly to the changes that occur in the abundance. distribution and genetic structure of popUlations of weed species over time. Dramatic changes occur from year to year in the abundance of nne species while other species may remain invariable (Cousens and iVlortimcr. 1095). III II I'e\\' vears some
species may escalate and become problematic over ,\ \\hoiL' regioll while other species may decline and become extinct. In many cases. ,lccllrciing to i\,lnrLimer ( 1(90). weed control practices which were aimed at forestalling damage b,' weeds. have acted as a
powerful force in the interspecific selection of weed tlora. Figure 2.3 illustrates a schematic representation of a population dynamics model for \veeds.
Cousens and Mortimer (1995) noted that plant species may be pre-adopted to be weeds in the sense that a species possesses a sui te 0 J' life history characteristics that
enables rapid population growth in the particular habitat conditions created and maintained by human activity. These pre-adapted ""eeds are defined as those species \vhich are either resident in the planfs natural community within dispersal distance of the crop (or other habitat) and may come to predominate within the crop as a consequence of a change in crop husbandry practices.
The demography of a weed can be divided into tv.ro fractions. according to Fernandez-Quintanilla (1988): one active (the growing plants) and one passiVe (the dormant seeds and underground buds). Demographic studies l)t1~r some insights into
the processes and factors that regulate the sizes of populations. In mechanistic studies on the other hanel. the life cycles of the population must be broken dmvn into a large number of coniponents representing the various stages or plant growth and development. In such studies. the ma.ior physiolugical and ecological processes involved in the cycle should be considered. including en\'ironment~lI conditions.
Studies on the etlect of crops on the popul,ltion dynamics of the weed nutsedge (( \perus esculentus) were done by Lotz et 01 .. (I C)l) I). After six years cropping with
maize. the effects of one year cropping of maize. tibre hemp (( 'ul7l7ahis salim). winter barley (Hordeum l'lIlgore). winter rye (Secole cereale). and of no crop were assessed on the tuber production per weed plant. In the hemp. there was hardly any tuber production. Howe\'cr in other crops the reproduction of the \\'eed \Vas .3 to 50 tubers per plant. The after dfects of the different crops on the density or the primary shoots of Illltsecige in a following maize crop were studied. The \\eecl lk'nsilY \\'as substantially reduced after grm\'ing hemp. \vhereas it was increaseci ~li'ter growing the other crops.
Crop
L ______ _
I I
Figure 2.3.
Weed plants
Survival
Emergence rate
Death rate
Seed Production
~_,~a~
Seeds in soil
Produced seeds
Rate of
Schematic representation of a population dynamics model for weeds. Broken lines indicate processes where crop and weeds interact. (Adapted from Lotz. ('/ (Ii .. 1995)
2.4 Crop losses due to weeds
Weeds are considered [he most persistel1l orall crop pests (LimdahL 1980). The malor agronomic constraints limiting yields nf an} crop results from competition between weeds and crops for \vater. soil nutrients. space. and light. Competition is a dynamic process and can be understood. according to Kropff and Lutz ( 199:2). from the distribution of the growth determining (light) or limiting (,vater. nutrients) resources over the competing species and the efficiency \\'ith ,,-hich each species utilises them.
2.4. j IV eed-crop cOll/petitiol1 ([nd intel/erence
rVlany authors have descri bed competi ti 011 as a \' i wi j~lctor 111 the plant
community. Brenchley (19:20) emphasised this in her studies of weeds in farmlands. \V-here she stated that. --It is impossible to SO\\' a crop without the certainty that other
12
plants will appear". A considerable volume of literature on \veed-crop interactions has been accumulated over the last 40 years. Since Zimdahr s (1980) review on weed-crop, competition there has been a proliferation of research in lhis area. This barrage of research has helped to some extent according to COLisens (1992). in developing an understanding of the nature of particular w'eecl-crop interactions bv providing information on:
1. yield losses in a given crop caused by a given population of a weed species.
J the calculation of economic thresholds. and J. i 111proved \veed control strategies.
The extent to which weed competition can reduce crop yield depends on species, density and duration (Cousens. 1992). Cousens ( 1(92) stated that considerable variation exists among species of crops and weeds in their competitive abilities. A strong plant competitor. either a crop or weed retards the growth of other plants growing in associatioll with it. Pavlychenchoand Harrington (1934) studied plant competition. They examiiled the root developnlent of weeds and crops in competition with each other under dry land 1~\l'Illing. They observed that competition i'or w,lter begins in the soil
when root systems overlap in their search for water and nutrienrs. They concluded that weeds were strong competitors for water. Shaw (198.2) reported th,lt a plant of common ragweed (AmiJJ'()sio oJ'femisi!j'o/io) competes with corn. as it requires three times as much water as a corn plant. In other studies by Pavlychenco and Harrington ( 1934). it was mentioned that strong competitors tend to have larger embryos. early emergence
andl~lster and taller growth.
Some weed scientists have differentiated between the types of competition as
i Iller-specific (bet\veen plants of the different species) and i ntra-speci tic (between plants of the same species). When t\,\'o plants interact. a number of processes may OCCUI'.
According to Cousens ( 1992). this may lead to one. both or neither plant benefiting or suffering. Radosevich ef o/.. (1996) referred to these processes occurring as competition. allelopathy. parasitism. and commensalism. The term competition is strictly defined <IS the c<lpture of limited resources hy olle indi\idual at the expense of
the other. As Cousens (1992) indicated. it \vas the 1irst interference process that was postulated. and. as a result. the term 'competition' is often used synonymously with interference.
Despite this accumulation of information on \\eed-crop competition. Cousens
- I·:. ,'. '~-:-' .".' ...
:i~t~~©};.i
, . ,
-control than anticipated. He stressed that more attention needs to be given to species comparisons. multispecies losses. effects of crops on weeds and the variabil ity of yield loss among sites and years. Critical-period studies. he added. ha \'e had little etfect on the understanding of competition. Competition develops through time. especially in relation to crop phenological development. He ended by establishing that research is needed in the area of comparative temporal development of weeds and crops and that a better understanding of this should lead to more ei'licielll and cll\'ironmentally sensitive weed control.
2.4.2 Effects of weed illtel:/,erellce Oil crop yield
Weed infestations cause serious economic losses in many crops. In cereals. for example barley. it was reported by O'Sullivan 1'1 of .. (Ic)X2) that yield loss (y) due to California thistle infestation \Vas described by the equation:
, I
Y
=
0.42
+
7.6
"YXWhere x is the number of Californian thistle shoots per square meter. A similar equation was tested by Hamman (1979) to estimate barley yield loss from a \vild oat (A1'(,110 lOIIlO) infestations:
I
L
=
3b'\lx\\'here L is the predicted yield loss (g/m2): a is the weed-free yield (!lIllY'). b IS a
competition index value. and x is the number of wild oat plants per m~.
This equation gave a reliable estimate of yield losses \vith a competition index \'alue. b. of O,()230, Wilson and Peters (I c)S2) found that barle\' vield \\'as correlated \\'ith dry \\eight llt' wild oat plants at harvest. rVlOSI or the \il'lci loss from weed competition was caused by a reduction in the number of barley tillers, However. in one year. they noticed that competition also led to smaller and fewer seeds per spike. They suggested that yield loss was due to replacement - type competition between two speCles.
Typically. loss in crop yield exhibits a proportional relationship with the abundance of weeds and the severity of interference (Cousens. I t)X51. Sewral authors
14
,-;: ~ "".:.-: r: ~~ ?:.'~
! .. ,'-": I ~
have described lhe relationship between crop yield and \\eed density as sigmoidal (Zimdahl. 1980: Radosevich el 01.. 1996) or quasi-sigmoidal \vith a biological threshold weed density below which no yield loss occurs. Cousens (1992) argues that such response curves are inappropriate and the statistics are not sufficient to describe yield losses. He emphasised that the appropriate approach should be a graphical presentation combined with non-iinear regression. This should be used and less reliance placed on lables of means. hypothesis testing and mUltiple range tests. He further noted. based 011
\vork done on density responses. that only a small range of species ill ~I small number of
crops have been studied and there are fey\" comparative studies of different weed species or different crops.
Weed impacts can change considerably with crop density. crop variety. 'relative time of emergence of weed and crop~ fertiliser use and other factors. Cousens (1992)
emphasised the paucity of research in these areas. He also stressed that predictions of yield loss c~lLIsed by. a single weed species in ~I crop are imprecise and possess
considerable inaccuracies when tr)Ting to extrapolate from one (or more) experiments to a particular field in a particular year. Cousens (1992) also slated that few attempts have been made to study the effects of weed mixtures on crop yield, !\ few studies have been done on mixtures of two or three \\feeds. but mixtures of more species have not been studied in a svslematic \\·a\" . .
A number
or
models have been developed for making realistic spray decisions. Spillers (I<)~D). ('oble (19XS) and Wilson (19X()) h~l\'e all dewloped mullispecies yieldmodels.
2.5 The lise of models for crop-weed interactions
Many models have been used to describe crop-weed interactions, Spitters and Aerts (19X3) lirsl introduced eco-physiological models Ill!' illlerplant competition involving light. \\"ater. and nutrient resources, kropff and Lutz (I t)9~) described the
eco-physiological model as consisting of a number oj' crop growlh models equal to the number of competing species. This model yvas referred to as a dynamic simulation
model in which competition for light and water is simulated al the process level. Kropff and Lotz (199~) did an experiment with three weed species in three eli fferent sligar beet
(Be/(f 1'lI/g(fris) \'arieties Llsing eeo-physiological model predictions as a frame\york for
the ~Ieloption of crop management strategies. The three sligar beel "arieties were
selected with differences in their leaf angle distribution. so that the variety chosen had the potential to suppress weeds. Leaves, which exhibited a more horizontal orientation, absorbed more light per unit leaf area of crop and significantly increased the death of late emerging weeds.
Spitters (1989) explained that the grmvth rate of a crop that is well supplied with \vater and nutrients is roughly proportional to its light interception. TI1l' rate of crop dry matter (DM) growth can be estimated from intercepted light and the average efficiency (E) with which the crop uses the intercepted light. Light interception is calculated from the incoming solar radiation (R) and the leaf area index (L)
or
the crop. The light fluxpenetrating the canopy decreases exponentially with the leaf area. so that the growth rate at time t is given by:
i.1Yt
=
(I -exp(-O.7
Lt )] U.) R ~ EWhere 0.7 is the light extinction coefficient and the factor 0.5 indicates that 50 (X) of the
incoming solar radiation (R) is photosynthetically active. At optimum temperature. the I ight utilisation efficiency (E) does vary. HO\vever reports suggest that the radiation use elliciency (RUE) is about is 2.5 to 3g DM/J'v1J intercepted light for ('1 species and 4.5g
DIVl/fVIJ for
C
1 plant species (Sinclair and rVluchO\\'. 1l)99)'Kropff and Lotz ( 19(2) mentioned that these models required too many inputs. such as elates of crop and "veed emergence anel \veed densities in order to be useful for linking field observations to yield loss in agricultural practice. They suggested that a simple quantitative model be used to quantify weed infestation such ~lS those developed
by Cousens (1985) and by Kropffand Spitters (1991).
Empirical models have been developed to describe the responses of crop yield to one or more parameters such as weed density and the rdatiw time 0/' emergence v,'ith
respect to the crop (Hakansson. 1983: Cousens e{ (/1 .. 19H7). Kroptf and Spitters ( 1991 )
explained that. precise predictions of yield loss on the basis of early obser\'ations should be based on both weed density and the period between crop and weed emergence to determine the competitive relations between the crop and the weeds. Spitters and Aerts ( 1(83) suggested that a relationship between relati\'C leaf area and yield Inss \vould be appropriate to predict )'ield loss rather than a relationship based on \wed density. Kropft' (19~8) shO\ved. using simulated data. that a (Iuse relationsnip existed bet\veen
16
-~.~
relative leaf area of the weeds and yield loss over a wide range of densities and relative times of weed emergence.
Spitters el a/., (1989) suggested an approach that was not worked out in experimental detail. The approach ,vas based on a hyperbolic yield density function. in which the plant densities of each species are replaced by their LArs monitored early in the grow-ing season. Cousens ( 1985) concluded that a h:-·perbolic model gave the best tit for the available data in his review of weed density/vield loss models.
Kropff and Spitters (1991) mathematically derived an empirical model from the hyperbolic yield loss weed density relationship. The independent variables in this model were leaf area index (LAI) of a weed species as a fraction of the total LAI of all species. Density is often not an accurate measure oj" weed quantities in a 1ield. as it does not account for thc patchiness. size and emergence pattern
or
weeds (Parker and Murdoch. 19(6). The relative leaf cover-yield loss model accounts for the effect of weed density. diftCrent weed tlushes. as well as the period between crop and yveed emergence. Thc model relates yield loss (YI) to relative leaf area (i-II expressed as leafarea weeds/leaf area crop
+
leaf area weeds) of the weeds shortly after crop emergence using a 'relatiyc damage coefticient' q as the single model parameter:A fmther parameter was added by Lotz el (f/., ( 199~):
Y
I =q Lw / I
+
(q
/171-
I) L"
Where 111 = maximum yield loss
Parker and iVlurdoch (1996) explained that the lise oj" 111 may be needed to
increase the accuracy of the yield loss prediction with weed species rhelt. at high density. cannot result in total crop yield loss. Lutman (1992) suggested that measuring leaf area is a time consuming process. so that ground covcr has to be lIsed to replace leaf area parameters.
Spitters and Aerts ( 1983) reported that the competitive strength of a species is strongly determined by its share of leaf area at the moment "hen thc canopy closes and inter-plant competition starts. In order to make precise decisions in weed management:
;, . ' ,l :_"~.' .' :-. '.,. -'..-... -.~, ... ~.
~~~i:>~:-:~?i:~t
yield loss caused by the "'eeds has to be estimated as early as possible after crop emergence. The relative damage coefficient q depends on the ratio of the leaf area per plant of the crop and the weed (Lo/Lo,,). It is important to kno,v how the relative area of weeds changes in the period between crop emergence and the moment when the crop canopy closes.
2.6 Effect of morphological and agronomic characteristics of crops
on weed suppression
A reduced dependence on herbicides is desirable La reduce the cost of crop production. reduce environmental degradation and to impede the development of herbicide resistance. A large amount of research is now being conducted to develop integrated weed management strategies for agricultural producers. One component of such a strategy is to grovv crops that are more competitive or to manipulate the crops' row spacing. plant popUlation. and canopy inlluence to ensure thaL the crop-weed relationships are fully exploited. The groyving of more aggressive crops could increase the density threshold values for weed control. This. perhaps. might improve the ellectiveness of chemical treatments at lower application rates (Christensen el ul .. 1994:
Lemerle el (II .. 1l)l)6 a. b) or mechanical control. with potential economic and/or environmental benctits (Paolini el ul .. 19(9).
One 01' the most important factors in a weed control program according to Johnson (1999) is the intluence of the crop canopy. 'vVhen the soil is fully shaded by the crop. sunlight is not available for weeds to establish and compete with the crop. This restriction of light is effective in manipUlating emerging \Veeds (Verschwele el {fl.,
1994: Grundy el (fl., 19(7). Rapid development of the crop canopy l11a}' reduce reliance
on herbicides to suppress weeds. There is evidence that these bctors can be successfully manipulated to provide an enhanced competitive ad\'antage for the crop. often at the expense of the weed tlora. Different crops and crop cultivars can reduce weed biomass from 4 to 83 % during a full season of competition (lvlinotti and Sweet.
1(81). Thus. the judicious manipulation of these I'actors can be ,1 highly effective component of an integrated weed management system.
2.6.1 E.llecl (~lcrofJs Oil weed suppressiol1
18
-> ., ,