2018 JINST 13 P05020
Published by IOP Publishing for Sissa MedialabReceived:February 16, 2018 Revised:March 27, 2018 Accepted:April 20, 2018 Published:May 16, 2018
MARS-MD: rejection based image domain material
decomposition
C.J. Bateman,a,b,c,d,1D. Knight,bB. Brandwacht,gJ. Mc Mahon,c J. Healy,eR. Panta,a,b
R. Aamir,bK. Rajendran,b M. Moghiseh,bM. Ramyar,bD. Rundle,aJ. Bennett,a
N. de Ruiter,a,b,f D. Smithies,aS.T. Bell,aR. Doesburg,aA. Chernoglazov,a,f
V.B.H. Mandalika,a,f M. Walsh,aM. Shamshad,a,b M. Anjomrouz,a,bA. Atharifard,b
L. Vanden Broeke,cS. Bheesette,b,hT. Kirkbride,j N.G. Anderson,b S.P. Gieseg,b,e
T. Woodfield,bP.F. Renaud,b,c,iA.P.H. Butlera,b,hand P.H. Butlera,c,h
aMARS Bioimaging Ltd.,
29a Clyde Rd, Christchurch, New Zealand bDepartment of Radiology, University of Otago,
2 Riccarton Ave, Christchurch, 8140 New Zealand
cDepartment of Physics and Astronomy, University of Canterbury,
P.O. Box 69 133, Lincoln, Christchurch, 7640 New Zealand dLincoln Agritech Limited,
Private Bag 4800, Christchurch, 8140 New Zealand eDepartment of Biology, University of Canterbury,
Private Bag 4800, Christchurch, 8140 New Zealand fHIT Lab NZ, John Britten Building,
Cnr of Creyke & Engineering Rd, Ilam, Christchurch, New Zealand gUniversity of Twente,
Drienerlolaan 5, Enschede, 7522NB The Netherlands hEuropean Organization for Nuclear Research (CERN),
Geneva 23, CH-1211 Switzerland
iDepartment of Mathematics and Statistics, University of Canterbury,
Private Bag 4800, Christchurch, 8140 New Zealand
jDepartment of Nursing, Midwifery and Allied Health, Ara Institute of Canterbury,
P.O. Box 540, Christchurch, 8140 New Zealand
E-mail: [email protected]
2018 JINST 13 P05020
Abstract: This paper outlines image domain material decomposition algorithms that have been routinely used in MARS spectral CT systems. These algorithms (known collectively as MARS-MD) are based on a pragmatic heuristic for solving the under-determined problem where there are more materials than energy bins. This heuristic contains three parts: (1) splitting the problem into a number of possible sub-problems, each containing fewer materials; (2) solving each sub-problem; and (3) applying rejection criteria to eliminate all but one sub-problem’s solution. An advantage of this process is that different constraints can be applied to each sub-problem if necessary. In addition, the result of this process is that solutions will be sparse in the material domain, which reduces crossover of signal between material images. Two algorithms based on this process are presented: the Segmentation variant, which uses segmented material classes to define each sub-problem; and the Angular Rejection variant, which defines the rejection criteria using the angle between reconstructed attenuation vectors.
Keywords: Computerized Tomography (CT) and Computed Radiography (CR); Data processing methods; Medical-image reconstruction methods and algorithms, computer-aided diagnosis
2018 JINST 13 P05020
Contents1 Introduction 1
2 Image domain material decomposition 2
3 MARS-MD heuristic process 3
4 MARS-MD algorithms 3
4.1 Segmentation variant 3
4.2 Angular rejection variant 4
5 Algorithm calibration 5
6 Evaluation 5
6.1 Data acquisition 5
6.2 Multi-Contrast phantom 6
6.3 Concentration phantoms 7
7 Discussion 9
8 Conclusion 11
1 Introduction
Spectral CT is a variant of x-ray computed tomography (CT) which uses additional measurements of photon energy to enable identification and quantification of different materials simultaneously. Energy information can be obtained through a multitude of ways. Clinical dual-energy CT is typi-cally performed using either dual-source [1], kVp switching [2–4], or dual-layered detectors [5,6]. More recently there has been development of pre-clinical systems which utilise energy
discrim-inating photon counting detectors to provide up to eight channels of energy information [7–10].
The MARS (Medipix All Resolution System) is a spectral CT system based on the Medipix3RX photon counting detector. This detector has eight energy bins which include one arbitrated, four charge summed, three single pixel counters. Information about these different counting modes
can be found elsewhere [11]. Recent MARS systems typically only utilize the arbitration and/or
charge-summed counters for spectral analysis due to their superior energy resolution, yielding 4–5 unique energy bins for each measurement.
The process of converting energy information into material information is known as either basis or material decomposition (MD). This was first demonstrated to be possible by Alvarez and Macovski through the conversion of dual-energy measurements into photo-electric and Compton
2018 JINST 13 P05020
number [13,14], and material specific densities [15–17]. There are three different ways in which MD
can be performed: pre-reconstruction, post-reconstruction, and (simultaneous) joint-reconstruction. Each of these have their own advantages and disadvantages. Pre- and joint-reconstruction allows for modelling of the x-ray beam poly-chromaticity, which in turn avoids beam hardening artefacts. To do this however requires use of non-linear optimization techniques which can be computationally intensive. Post-reconstruction MD has the advantage that it can be performed quickly, however it is susceptible to any beam hardening artefacts within the reconstructed data. The impact of this can be minimized by, using synchrotron x-ray sources, or applying beam-hardening correction techniques, and in some cases of measuring within narrow energy ranges.
One issue that is common to all three approaches is the linear dependencies between the attenu-ation distributions for materials commonly of interest in medical imaging. It was originally assumed that only two materials without K-edges could be decomposed due to the primary dependence on
the photo-electric and Compton interactions in the diagnostic imaging range [18]. Bornefalk later
showed that the attenuation for the set of elementsZ <20 can theoretically be decomposed into four
independent components [19]. Despite this, the decomposition of many materials simultaneously
can still prove challenging if any of them are close in effective atomic number.
This paper outlines two post-reconstruction MD algorithms that has been routinely used in MARS small animal scanners, and the heuristic they are based on to minimize the impact of this basis linear dependence issue. We also describe the image domain formulation of post-reconstruction MD problem. Use of the presented algorithms is demonstrated on three multi-material phantoms.
Results from MARS-MD have been used in numerous publications on pre-clinical applications for spectral CT. Examples where the Segmentation variant of the MARS-MD algorithm has been
used include: soft tissue imaging using lamb meat [20]; arthritic cartilage imaging [21]; intrinsic
biomarker and contrast identification in atherosclerosis [22]; and simultaneous imaging of multiple
contrast agents [23]. Each of these studies use different imaging parameters and provide independent
assessments of MD results that are relevant to the given studies. The Angular Rejection variant is more recent and its additional benefits in such applications is currently under investigation.
2 Image domain material decomposition
MD in the image domain processes reconstructed energy bin volumes into material image volumes. Each voxel of the reconstructed image provides an estimate of the attenuation in that voxel for each energy bin. That voxel’s attenuation for a given energy bin can be parametrized by a linear combination of basis functions
µ(E)=a1f1(E)+a2f2(E)+· · ·+aNfN(E). (2.1)
Using this, the attenuation for all energy bins can be written as the matrix equation
b= Mx (2.2)
where b = µ(E) is a column vector containing the attenuation of the voxel in each energy bin;
M =[f1(E) f2(E) . . . fN(E)]is a matrix whose columns containing values of the basis functions
2018 JINST 13 P05020
coefficients. Here we useEto represent the vector of energy bins with a slight abuse of notation.
If each energy bin is capturing a monochromatic signal then the elements ofEwould be just the
energies of the corresponding x-rays. When working with polychromatic energy bins the elements
ofEare more abstractly thought of as observable energy intervals. It is not uncommon for this
to be defined using effective energies to simplify the description of each energy bin. The image
domain MD problem is simply the inversion of this matrix equation (x= M−1b) for every voxel in
the volume.
Numerous approaches have been taken for solving this problem, many of which are based on a
linear least squares estimates [15,24]. Variations include application of different constraints such as
volume conservation [25], mass conservation [17], or non-negativity [26]; each voxel being treated
either independent or dependent of its neighbours [27]; and the representation of a voxel being
restricted to a subset of basis functions [15,28].
3 MARS-MD heuristic process
The MARS-MD algorithms are based on a simple heuristic which is designed to be adaptable to different situations. Both algorithms presented below are based on the same three steps: given a
set of N basis functions, (1) construct a number of feasible sub-problems from the basis set, (2)
calculate the solution to every sub-problem, and (3) apply some rejection criteria to eliminate all but one sub-problem solution.
When determining what set of sub-problems to use we first choose the maximum number k
of basis functions that will be allowed to describe a voxel (in practice this might be the maximum
number of materials per voxel). We then consider all k ≤ N combinations of basis functions and
further eliminate any that are non-physical and/or undesirable. A sub-problem is then formulated
to find a solution to eq. (2.2) for each remaining sub-set of basis functions. Since each of these are
calculated independently, different constraints can be applied to different sub-problems.
4 MARS-MD algorithms
There are two versions of the MARS-MD algorithm following this heuristic that have been used with MARS systems — the Segmentation variant and the Angular Rejection variant. These two algorithms have been known by different names in different places. In the MARS system automated image processing chain they are known as MARS-MD v1.0 and MARS-MD v1.1 respectively. Each of these methods only considers solutions with at most two materials per voxel. For each voxel, the MARS-MD algorithms typically decompose reconstructed effective linear attenuation onto a set of mass attenuation bases for different materials. The results of the algorithms are produced as estimated densities of the given basis materials.
4.1 Segmentation variant
The segmentation variant uses a procedure we have previously published [28] to categorize each
2018 JINST 13 P05020
for lipid and water linear attenuation vectors. Soft tissue voxels are identified as having a norm value between lipid and water; dense tissue above water; and air below lipid. Cases close to the segmentation boundaries are then reclassified using the Mahalanobis distance
d(u,v)=(u−v)TΣ−1(u−v) (4.1)
between linear attenuation vector for the respective voxel to those for both lipid and water. For
multi-variate normal distributions with covarianceΣ, the Mahalanobis distance iso-surfaces trace
out confidence ellipsoids with the distance equalling the χ2 distribution value to that level of
confidence. Any pixel with a Mahalanobis distance within a 95% confidence of either lipid or water is preferentially classified as soft tissue. The vectors for lipid and water are determined
experimentally during algorithm calibration described in section 5. The covariance matrix Σ is
also estimated from large homogeneous regions within calibration scans. Following this initial segmentation these pixel classifications are represented as binary masks on which a median filter is applied (removing speckle noise in the masks) to produce the final classification.
Sub-problem selection. Following classification, combinations of materials within a voxel are then restricted based on its class. Air voxels are considered to be empty and set to the zero solution. Soft tissue voxels are treated as containing a combination of lipid and water obeying volume conservation. Dense material voxels which contain either a single dense material, or a single dense material in combination with water.
Sub-problem solution. Eq. (2.2) is solved for each basis combination using a non-negative linear least squares estimate. The volume constraint is applied to the lipid-water sub-problem as an additional equation included within the matrix equation. To do this the lipid and water bases used in the matrix equation need to be expressed as linear attenuation.
Solution rejection. The linear least squares errorkb−Mx∗k2is calculated for each sub-problem
solutionx∗. The solution with the smallest error is selected as the final solution for the respective
voxel.
4.2 Angular rejection variant
Rather than using segmentation to assign a classification to each pixel, the Angular Rejection Variant calculates all sub-problems from the Segmentation Variant. However there is no strict exclusion of sub-problems resulting from attenuation intensity. Instead solutions are picked based on which has a vector direction closest to the original signal when projected back onto attenuation space.
Sub-problem selection. Each voxel is treated as containing either a combination of lipid and water, a single dense material, or a single dense material in combination with water. Similarly to above, a volume conservation constraint is included in the lipid-water sub-problem.
2018 JINST 13 P05020
Solution rejection. An attenuation vector Mx∗ is calculated from the solution for each sub-problem. Each element of each of these vectors is then normalised by the attenuation of water at the corresponding energy (taken from the calibration). The cosine angle is then calculated between these vectors and similarly normalised reconstructed linear attenuation vector of the respective pixel.
θ(u,v)=arccos
uTv
kuk · kvk
. (4.2)
The solution with the smallest cosine angle is then selected as the final solution for the respective
voxel. We have found that using this normalisation (a pseudo-Hounsfield unit [29]) for this procedure
yields better discrimination than using plain linear attenuation vectors.
5 Algorithm calibration
In its implementation within MARS systems, theMmatrix in the MARS-MD algorithm is calibrated
using scans of phantoms which contain the materials of interest at known concentrations and
locations (figure1). This is a two step process. First the effective linear attenuation for each material
(for each concentration and energy bin) is estimated by taking the mean of respective regions in the reconstructed data. These values are then used to calculate the effective mass attenuation, which is
used in theMmatrix. If more than one concentration is used to calculate the mass attenuation for a
given material then it is determined using the non-negative linear least squares estimate of eq. (2.1)
(where the mass attenuation is taken to be the unknown and concentration taken to be the known variables).
6 Evaluation
6.1 Data acquisition
Scans of the following three phantoms were taken using a version 5 MARS spectral CT scanner. The MARS camera within this scanner contained a single Medipix3RX detector with a 2 mm thick
CZT sensor layer. The energy response of the detector was calibrated using the kVp method [22].
The detector was operated in charge summing mode, where the four charge summing counters were set to 15, 33, 65, and 80 keV; the three single pixel mode counters were set to 60, 70, and 80 keV; and the arbitration counter was set just above the noise floor (approximately 7 keV). Only the arbitration and charge summed counters were used for image processing. The x-ray beam was generated by
a tungsten anode Source Ray SB-120-350 model x-ray tube operated with a current of 18µA and
voltage of 120 kVp. The x-ray beam was pre-attenuated by 1.8 mm aluminium equivalent intrinsic
filtration. No extrinsic filtration was used. Scans were taken with a source to object distance of 200 mm and a object to detector distance of 50 mm. Projection data of each phantom was collected sequentially over five vertical translations of the detector module. 720 open-beam images were collected for each camera position to be used in flat-field normalization. An exposure time of
150 ms was used, equating to a mean open-beam count-rate of approximately 13.4 #/px/ms. The
scanning of the phantom was performed with a helical pitch of 0.98 with 720 frames captured per
rotation. Narrow energy bins were reconstructed using an iterative reconstruction algorithm [30].
2018 JINST 13 P05020
(a) (b)
Figure 1. Example of a MARS-MD calibration using reconstructed images of a known phantom; (a) regions covering each material in the reconstructed images are averaged to estimate the effective linear attenuation for each material; (b) from this the effective mass attenuation for each material is estimated and used as the columns in theM matrix to calibrate the MARS-MD algorithm.
approach using an un-regularized ordered subset expectation maximization optimiser. This has the effect of sharing spatial information between bins, significantly improving the reconstruction quality of those that have fewer photons measured in their subtracted ranges.
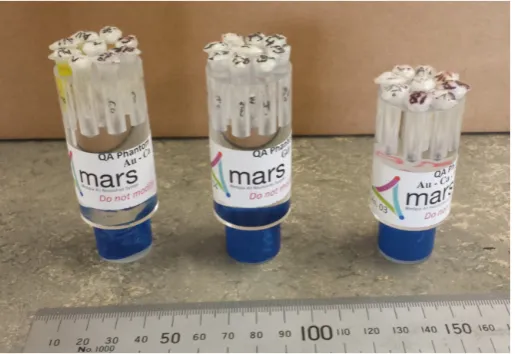
The three phantoms that were scanned are known as the CaAu, GdI, and Multi-Contrast QA
phantoms (figure 2). Each phantom is made from a 31 mm diameter PMMA, with nine 6 mm
capillaries — eight around periphery and one in the centre. 0.2 ml polypropylene Eppendrof tubes
containing solutions of materials are inserted into each capillary. Each tube is sealed with paraffin wax. The Multi-Contrast phantom is used for MD calibration and contains vegetable oil; 2x water; 8 and 2 mg(Au)/ml gold chloride; 8 and 2 mg(Gd)/ml diluted MultiHance; 18 mg(I)/ml diluted Omnipaque 350; and 240 mg(Ca)/ml calcium chloride. The CaAu and GdI phantoms cover the same materials expect at a larger range of concentrations. The CaAu phantom contains water; 8, 4, 2, and 1 mg(Au)/ml gold chloride; and 240, 140, 70, and 35 mg(Ca)/ml calcium chloride. The
GdI phantom contains water; 8, 4, 2, and 1 mg(Gd)/ml diluted MultiHance; and 18, 9, 4.5, and
2.25 mg(I)/ml diluted Omnipaque 350.
6.2 Multi-Contrast phantom
The reconstruction of a single slice in the middle of the Multi-Contrast phantom is shown in figure3.
This was processed using three different material decomposition algorithms (figure4), including
the two MARS-MD variants and an unmodified non-negative linear least squares (LSQ). Each MD decomposed five energy bins into six material channels. The MD calibration was calculated from an average 11 slices (including the slice used for MD analysis) with material regions selected to
cover the majority of each capillary in a similar way as shown in figure1a.
2018 JINST 13 P05020
Figure 2. CaAu, GdI, and Multi-Contrast QA phantoms (left to right).
materials per voxel, there is less crossover of signal between material channels as compared to the non-negative LSQ results. A small amount of degradation of the decompositions are observed in the bottom left quadrant of the phantom, which result from minor beam hardening artefacts in the lower energy bins.
The most striking difference between the two MARS-MD variants is how the PMMA signal is split over different material channels. The PMMA has been mostly identified as a combination of gadolinium and water in the Segmentation variant. In this case, the higher signal density of the PMMA has enabled it to be grouped under the dense material category of the segmentation. This makes PMMA appear in the water channel, unlike the other two algorithms where it appears in the lipid channel. The lipid-water volume constraint used in the Segmentation variant also has a tendency of forcing PMMA signal into the water channel under situations where it processed in the soft tissue category. Despite the Angular Rejection variant not describing PMMA with a gadolinium component in this example, we have observed that it can happen when using different data acquisition parameters.
6.3 Concentration phantoms
Two phantoms containing four concentrations each of gold, gadolinium, iodine, and calcium solu-tions were used to assess the quantitative results of the two MARS-MD variants. The concentrasolu-tions in these phantoms were chosen to cover ranges of both good and poor detectability with the current MARS system. The decomposition of a single slice of these phantoms (excluding the lipid and
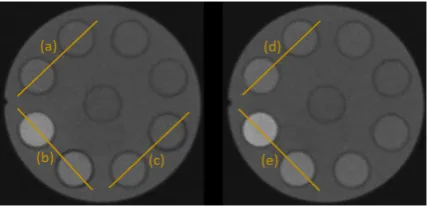
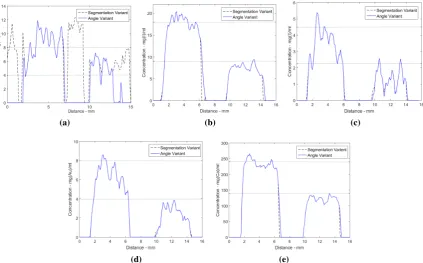
water channels) is shown in figure 5. Line profiles presenting the MD estimated concentrations
in selected capillaries is shown in figures6and7. The two lowest concentrations of gadolinium,
ma-2018 JINST 13 P05020
Figure 3. Reconstruction of Multi-Contrast phantom with subtracted energy bins displayed with a window of[−700,1000]Hounsfield units. From the indent on the right hand side moving clockwise the capillaries contain 8 mg(Au)/ml, 2 mg(Au)/ml, 8 mg(Gd)/ml, 2 mg(Gd)/ml, 18 mg(I)/ml, 240 mg(Ca)/ml, water, and lipid. The central capillary contains water.
2018 JINST 13 P05020
terials from its initial segmentation procedure. This is most clearly demonstrated by the 18 mg(I)/ml capillary in figure7b.
The lowest two concentrations of calcium (figure5) are mostly identified as gold.
Misiden-tification such as this is not uncommon at low concentrations. It is also common observe low
concentrations of gold misidentified as calcium when using different imaging parameters [23].
Most of the predicted concentrations shown in the line profile diagrams (figure7) is a small
underestimate when compared to the expected concentrations (horizontal dotted lines). Small deviations are expected in image space decomposition for a variety of reasons. For example — despite using narrow energy bins, beam hardening artefacts will still be present. In addition, the extent of the beam hardening will be different in each energy bin. It therefore is not surprising that we have observed that the size of this underestimation changes with modifications to energy bins and x-ray spectrum.
(a) (b)
Figure 5. Material decomposition of concentration phantoms using (a) Segmentation variant and (b) Angular Rejection variant of MARS-MD showing gold, gadolinium, calcium, and iodine channels fused with the highest energy bin.
Figure 6. Positions of line profiles displayed in figure7for GdI (left) and CaAu (right) phantoms. Profiles of low concentration capillaries with high levels of misidentification have been excluded.
7 Discussion
2018 JINST 13 P05020
(a) (b) (c)
(d) (e)
Figure 7. Select line profiles of material decomposed concentration phantoms. Horizontal dotted lines indicate real concentrations of given materials. The profiles cover the following capillaries: (a) 8 mg(Gd)/ml and 4 mg(Gd)/ml; (b) 18 mg(I)/ml and 9 mg(I)/ml; (c) 4.5 mg(I)/ml and 2.25 mg(I)/ml; (d) 8 mg(Au)/ml and 4 mg(Au)/ml; and (e) 240 mg(Ca)/ml and 140 mg(Ca)/ml. In this example, most MD results are slightly less than expected yet still close to their desired concentrations.
domain MD route. A more pragmatic approach to the MD problem in spectral CT would be to construct an initial approximation of the decomposed volume using a fast filtered back projection (or similarly fast) reconstruction paired with an image space material decomposition, the results of which are then used for the initial guess in a joint-reconstruction decomposition.
The MARS-MD heuristic has a combinatorial approach to solving the MD problem. The typical issues associated with scalability have been minimized by only considering a small subset of material combinations. For the subsets used in the variants above the number of combinations per
voxel scales linearly with the number of materials used in the decomposition (2N−3 combinations
forN ≥ 2 materials). This approach also provides an easy framework to reject solutions in lieu of
others for unique reasons, such as unrealistic material concentrations.
A key feature of the above MARS-MD algorithms is that they target solutions that are sparse
in the material domain. Although this type of constraint has been used in other techniques [15,31],
2018 JINST 13 P05020
described above, in this sense, do not facilitate either the identification of multiple high contrast materials within a single voxel nor the combination of high contrast materials and lipid.
One of the challenges of post-reconstruction MD is the question about how to calibrate them for a wide variety of applications and/or scan samples. Here we have calibrated directly from experimental phantom data. The validity of calibrations for each scan however are dependent on the degree of beam hardening within the sample. This in-turn depends on the size and composi-tion of each scan sample — which will be different. Numerous practices have been followed in within the MARS research team’s pre-clinical work to minimize this bias. The phantoms used for calibration are of a similar size and effective density to the samples generally scanned. Sometimes additional calibration vials have been included alongside initial samples to test the validity of the MD calibration and to correct it if necessary.
It is also worth adding additional context around the choice of energy thresholds used in our phantom example — i.e. setting the second to last energy threshold to 65 keV whereas one may expect it to be closer to the K-edge of gadolinium (50 keV). Several techniques exist for determining optimal energy thresholds however these generally depend on the composition and size of the
object being scanned [32–34]. A popular alternative is to choose the threshold positions just below
the K-edge energies for the materials of interest. In principle this alternative is a good rule of thumb, however it becomes less applicable when discriminating between a large number of high Z materials using a detector with coupled broad energy bins (such as the Medipix). If we set the above threshold closer to the K-edge of gadolinium then it is expected that the resolution of the gold K-edge to decrease (therefore decreasing the decomposition sensitivity to gold). Since the relative size of the K-edge discontinuity in a material’s mass attenuation gets smaller with increasing Z, the choice of threshold position has a greater impact on K-edge resolution with higher Z materials. Note that the choice of threshold that we have made here is not necessarialy optimal in a global sense. However it provides opportunity for interesting discussion on some of the intuition behind picking energy thresholds when trying to discriminate between many materials at once.
Lastly, the quality of results produced by any MD technique is highly dependent on the infor-mation measured from the spectral domain. What counts as good or sufficient spectral inforinfor-mation can depend on things such as the decomposition bases that are used; what and how many energy bins are used; and even the degree of beam hardening caused by the sample. In other words, a set of optimal acquisition parameter for one application may not be optimal for other applications. We have given reference to a diverse range of applications using our methodology for this reason. This problem of spectral CT scan protocol optimality is currently an area of active research.
8 Conclusion
2018 JINST 13 P05020
AcknowledgmentsThe authors would like to acknowledge the Medipix2 and Medipix3 collaborations; the University of Canterbury and University of Otago for supporting this work; and the MARS clinical research teams and partners. Development of the MARS spectral CT scanners are through projects funded by the Ministry of Business and Innovation as Employment (MBIE), New Zealand under the contract numbers UOCX0805 and UOCX1404.
References
[1] T.G. Flohr et al.,First performance evaluation of a dual-source CT (DSCT) system,Eur. Radiol.16 (2006) 256.
[2] W.A. Kalender, W.H. Perman, J.R. Vetter and E. Klotz,Evaluation of a prototype dual energy computed tomographic apparatus. I. Phantom studies,Med. Phys.13(1986) 334.
[3] D. Xu et al.,Dual energy CT via fast kVp switching spectrum estimation,Proc. SPIE7258(2009) 72583T.
[4] T.P. Szczykutowicz and G. Chen,Dual energy CT using slow kVp switching acquisition and prior image constrained compressed sensing,Phys. Med. Biol.55(2010) 6411.
[5] R. Carmi, G. Naveh and A. Altman,Material separation with dual-layer CT,IEEE Nucl. Sci. Symp. Conf. Rec.4(2005) 1876.
[6] Y. Yao, H. Bornefalk, S.S. Hsieh, M. Danielsson and N.J. Pelc,Utilization of in-depth photon counting detectors towards x-ray spectral imaging: The benefits from the depth information, in proceedings of the2014 IEEE 11th International Symposium on Biomedical Imaging (ISBI), Beijing, China, 29 April–2 May 2014, pp. 1156–1159 [https://doi.org/10.1109/ISBI.2014.6868080].
[7] P.J. Bones, A.P.H. Butler, J.P. Ronaldson and A.M.T. Opie,Development of a CT scanner based on the Medipix family of detectors,Proc. SPIE7804(2010) 780412.
[8] M. Persson et al.,Energy-resolved CT imaging with a photon-counting silicon-strip detector,Phys. Med. Biol.59(2014) 6709.
[9] A. Sarno et al.,Imaging performance of phase-contrast breast computed tomography with synchrotron radiation and a CdTe photon-counting detector,Physica Med.32(2016) 681.
[10] P.M. Shikhaliev,Soft tissue imaging with photon counting spectroscopic CT,Phys. Med. Biol.60 (2015) 2453.
[11] T. Koenig et al.,Charge summing in spectroscopic X-ray detectors with high-Z sensors,IEEE Trans. Nucl. Sci.60(2013) 4713.
[12] R.E. Alvarez and A. Macovski,Energy-selective reconstructions in X-ray computerised tomography, Phys. Med. Biol.21(1976) 733.
[13] D.R. White,An analysis of the Z-dependence of photon and electron interactions,Phys. Med. Biol.22 (1977) 219.
2018 JINST 13 P05020
[15] H.Q. Le and S. Molloi,Least squares parameter estimation methods for material decomposition withenergy discriminating detectors,Med. Phys.38(2011) 245.
[16] E. Roessl and R. Proksa,K-edge imaging in x-ray computed tomography using multi-bin photon counting detectors,Phys. Med. Biol.52(2007) 4679.
[17] X. Liu, L. Yu, A.N. Primak and C.H. McCollough,Quantitative imaging of element composition and mass fraction using dual-energy CT: Three-material decomposition,Med. Phys.36(2009) 1602.
[18] M. Firsching, J. Giersch, D. Niederlöhner and G. Anton,A method for stoichiometric material reconstruction with spectroscopic x-ray pixel detectors,IEEE Nucl. Sci. Symp. Conf. Rec.7(2004) 4116.
[19] H. Bornefalk,XCOM intrinsic dimensionality for low-Z elements at diagnostic energies,Med. Phys. 39(2012) 654.
[20] R. Aamir et al.,MARS spectral molecular imaging of lamb tissue: data collection and image analysis, 2014JINST9P02005[arXiv:1311.4528].
[21] K. Rajendran et al.,Quantitative imaging of excised osteoarthritic cartilage using spectral CT,Eur. Radiol.27(2017) 384.
[22] R. Panta, M. Walsh, S. Bell, N. Anderson, A.P.H. Butler and P.H. Butler,Energy Calibration of the Pixels of Spectral X-ray Detectors,IEEE Trans. Med. Imaging34(2014) 697.
[23] M. Moghiseh et al.,Discrimination of Multiple High-Z Materials by Multi- Energy Spectral CT: A Phantom Study,JSM Biomed. Imaging Data Pap.3(2016) 1007.
[24] J.P. Ronaldson et al.,Toward quantifying the composition of soft tissues by spectral CT with Medipix3, Med. Phys.39(2012) 6847.
[25] H.J. Vinegar and S.L. Wellington,Tomographic imaging of three-phase flow experiments,Rev. Sci. Instrum.58(1987) 96.
[26] R. Zhang, J. Thibault, C.A. Bouman, K.D. Sauer and J. Hsieh,Model-based iterative reconstruction for dual-energy x-ray CT using a joint quadratic likelihood model,IEEE Trans. Med. Imaging33 (2014) 117.
[27] D.P. Clark, G.A. Johnson and C.T. Badea,Robust material decomposition for spectral CT,Proc. SPIE
9038(2014) 90381A.
[28] C.J. Bateman et al.,Segmentation enhances material analysis in multi-energy CT: A simulation study, in proceedings of the2013 28th International Conference on Image and Vision Computing New Zealand (IVCNZ 2013), Wellington, New Zealand, 27–29 November 2013, pp. 190–195 [https://doi.org/10.1109/IVCNZ.2013.6727014].
[29] R. Zainon, P. Ronaldson, A.P.H. Butler and P.H. Butler,Establishing a linear basis for quantifying material composition using spectral CT, in proceedings of the2011 International Conference on Biomedical Engineering and Biotechnology (BEB2011), Shanghai, China, 28–30 October 2011.
[30] N. de Ruiter, P.H. Butler, A.P.H. Butler, S. Bell, A. Chernoglazov and M. Walsh,MARS imaging and reconstruction challenges, in proceedings of the14th International Meeting on Fully
Three-Dimensional Image Reconstruction in Radiology and Nuclear Medicine, Xi’an, Shaanxi, China, 18–23 June 2017, pp. 852–857 [https://doi.org/10.12059/Fully3D.2017-11-3111007].
2018 JINST 13 P05020
[32] P. He, B. Wei, W. Cong and G. Wang,Optimization of K-edge imaging with spectral CT,Med. Phys.39(2012) 6572.
[33] B. Meng, W. Cong, Y. Xi, B. Man and G. Wang,Energy Window Optimization for X-ray K-edge Tomographic Imaging,IEEE Trans. Biomed. Eng.63(2016) 1623.

![Figure 3. Reconstruction of Multi-Contrast phantom with subtracted energy bins displayed with a windowcontain 8 mg(Au)/ml, 2 mg(Au)/ml, 8 mg(Gd)/ml, 2 mg(Gd)/ml, 18 mg(I)/ml, 240 mg(Ca)/ml, water, andof [−700, 1000] Hounsfield units](https://thumb-us.123doks.com/thumbv2/123dok_us/9550490.1483951/10.595.85.515.421.643/figure-reconstruction-contrast-phantom-subtracted-displayed-windowcontain-hounseld.webp)