Energy Based Feature Extraction for
Classification of Respiratory Signals Using
Modified Threshold Based Algorithm
A.BHAVANI SANKAR1
Assistant Professor, Department of ECE, Anjalai Ammal- Mahalingam Engineering College Kovilvenni-614 403, Tamilnadu, India
D.KUMAR2
Dean/Research, Periyar Maniyammai University Vallam, Tamilnadu, India
K.SEETHALAKSHMI3
Senior Lecturer, Department of ECE, Anjalai Ammal- Mahalingam Engineering College Kovilvenni-614 403, Tamilnadu, India
Abstract:
In this work, we carried out a detailed study of various features of respiratory signal. Respiratory signals contains potentially precise information that could assist clinicians in making appropriate and timely decisions during sleeping disorder and labour. The extraction and detection of the sleep apnea from composite abdominal signals with powerful and advance methodologies is becoming a very important requirement in apnea patient monitoring. The method we proposed in this work is based on the extraction of four main features of respiratory signal. The automatic signal classification starts by extracting signal features from 30 seconds respiratory data through autoregressive modeling (AR) and other techniques. Four features are: signal energy, zero crossing frequency, dominant frequency estimated by AR and strength of dominant frequency based on AR. These features are then compared to threshold values and introduced to a series of conditions to determine the signal category for each specific epoch.
Keywords: Sleep Apnea, Motion Artifact, Energy Index, Respiration rate, Dominant frequency, Strength of Dominant frequency.
1. Introduction
Sleep Apnea is a common health problem in today’s society. Increased sleepiness during daytime has been identified as an important cause of accidents in transportation and factory plants. It is therefore a major health interest to continuously monitor and report the sleepiness level of high risk persons such as pilots, truck drivers or shift workers. Continuously updated information about the people’s “need for sleep” could help these people better schedule their breaks and sleep times.
efficient algorithm should adopt itself to any kind of signals; it should not have any static rules for classifying the given input signal.
Our proposed work shows a method for classifying the respiratory signal using a MATLAB coding. The capability of classifying respiratory signals and detecting apnea episodes are of crucial importance for clinical purposes. It describes an automatic classification algorithm using features derived from the autoregressive modeling and modified threshold crossing schemes that was used to classify respiratory signals into the following categories: (1) normal respiration, (2) respiration with artifacts and (3)sleepapnea. This classification is capable of detecting fatigue of the human by identifying sleep apnea, early detection of sleep troubles and disorders in groups at risk, reduces the risks of being affected by serious heart diseases in future. The main contribution of this paper is the analysis of signals those are necessary for classification of the respiratory signals which yields not only the classification but also the analysis of various ailments.
Results in [1] indicate that respiratory signals alone are sufficient and perform even better than the combined respiratory and ECG signals. Respiratory signals are convenient to measure because they do not require electrodes on the skin, and people may wear the sensors for periods of several days and weeks. An apnea detection method based on spectral analysis was discussed in detail in [2]. In [3] the possibility of recognizing obstructive sleep apnea based on beat-by-beat features in ECG recordings was studied. It was also explored the application of time- varying autoregressive models and KNN linear classifier. A classification scheme of respiratory signal based on fuzzy logic was proposed in [4]. The paper [5] proposes an implementation of automatic classification of respiratory signals using a Field Programmable Gate Array (FPGA). The main novelty in [6] is that the phase difference between the two respiration signals is considered in order to determine the presence and grade of obstructive apnea. The work in [7] shows that the interval between zero crossings gives a good estimation of its frequency with reduced computational effort. The utilization of a second order autoregressive (AR) model to extract the dominant frequency and quantify its strength was discussed in [8].The reliability of respiratory signal extraction methods from electrocardiogram (ECG) data is investigated in [9]. A fuzzy inference system (FIS) was developed in [10] to detect obstructive sleep apnea by analyzing the respiratory airflow signal in adults.
2. Sleep Apnea
Sleep apnea is a common sleeping disorder. When a person has sleep apnea, he or she stops breathing for short periods of time [3]. In most cases this lasts from 10 seconds to 1 minute or more while asleep. Then the person begins breathing again. A person may stop breathing only a few times or hundreds of times in the course of the night. If apnea is kept untreated it will lead to increase the risk for High blood pressure, Heart attack, Obesity and Diabetes, Increase the risk for worsen Heart failure, Make irregular heartbeats more likely, and Increase the chance of having work-related or driving accidents. Sleep apnea can be treated by focusing on reducing airway blockage and increasing the amount of oxygen in the body. The first step is often a serious attempt at losing weight. It is also crucial to avoid alcohol and sleeping pills.
If these measures do not help, the person may need a continuous positive airway pressure (CPAP). The individual wears a mask over the nostrils or mouth that pumps in pressurized air. This increases the amount of oxygen entering the lungs. It also relieves the symptoms of obstruction. The technique can be used with or without supplemental oxygen. Dental appliances may be used to reposition the tongue and lower jaw. Uvulopalatopharyngoplasty is a type of surgery that removes excess tissue at the back of the throat. If all other methods fail, a tracheostromy may be done. This involves cutting a small hole in the neck through which the person can breathe. Medicines may be needed to increase respiratory function while the person sleeps. Antidepressants may be prescribed. These reduce the amount of time a person spends in deep sleep.
3. Classification of Sleep apnea
There are three classifications of sleep apnea, including:
CENTRAL APNEA, in which the brain isn't signaling the muscles to breathe or the muscles don't receive or can't respond to the signal to breathe
MIXED APNEA, this is a combination of obstructive and central apnea.
The most common kind of sleep apnea is called Obstructive Sleep Apnea Syndrome [2]. Sleep apnea means "cessation of breath." It is characterized by repetitive episodes of upper airway obstruction that occur during sleep, usually associated with a reduction in blood oxygen saturation. In other words, the airway becomes obstructed at several possible sites. The upper airway can be obstructed by excess tissue in the airway, large tonsils, and a large tongue and usually includes the airway muscles relaxing and collapsing when asleep. Another site of obstruction can be the nasal passages. Sometimes the structure of the jaw and airway can be a factor in sleep apnea.
A sleep test, called polysomnography is usually done to diagnose sleep apnea. There are two kinds of polysomnograms. An overnight polysomnography test involves monitoring brain waves, muscle tension, eye movement, respiration, oxygen level in the blood and audio monitoring. The second kind of polysomnography test is a home monitoring test. A Sleep Technologist hooks you up to all the electrodes and instructs you on how to record your sleep with a computerized polysomnograph that you take home and return in the morning. They are painless tests that are usually covered by insurance.
The positive effects of sleep deprivation on depressed people are used in psychiatry to treat a multitude of depression types without medication and are the most rapid antidepressant available today a lifestyle device. The developed algorithm could also be a primary sleep disorder prevention system that would be more powerful than only passive prevention methods and less expensive determination method.
4. Need for Respiratory signal
The traditional methods for assessment of sleep related breathing disorders are sleep studies with the recordings of ECG, EEG, EMG and respiratory effort. Sleep apnea detection with ECG recordings requires more number of electrodes on the skin and people may wear it continuously for effective monitoring. EEG measurement can also be used for the detection of sleep apnea but the brain signals are always random in nature. For the complete detection, we need more number of samples for analysis. Also, the mathematical modeling of EMG signals is very complex for sleep apnea detection. From the results in [1], the respiratory signals alone are sufficient and perform even better than ECG, EEG and EMG. In our paper, we consider only the respiratory signal for the detection of sleep apnea since it is more convenient and do not require more number of electrodes on the skin. The human respiratory signal as shown in Fig.1 is classified into three major classifications namely,
a) Normal respirations. b) Motion artifacts. c) Sleep apnea.
4.1 Normal Respiration:
The normal respiration is characterized by the presence of a certain rhythm and the presence of some energy level in the signal.
4.2 Sleep apnea:
Apnea is easily classified as the absence of energy (ventilation activity) as well as a lack of rhythm. The respiration rate was below a critical level.
4.3 Motion artifact:
Motion Artifact is generally characterized by a sudden increase in the amplitude of the signal and by a sudden variation in the rhythm of the heart usually has the higher energy when compared to the normal respiration. Motion artifacts are transient baseline changes caused by changes in the skin impedance. This type of interference represents an abrupt shift in base line due to movement of the patient while the respiratory signal is being recorded
5. Feature Extraction
This classification algorithm extracts several features of respiratory signals and utilized for disease identification. The feature extraction plays a vital role since the classification is completely based on the values of the extracted features. The fundamental features of respiratory signal provide the numerical value which is compared with the threshold values and the classification results will be produced.
The fundamental features of respiratory signals [8] are 1. Energy Index (EI)
2. Respiration frequency estimated by a modified Zero crossing scheme (FZX) 3. Dominant frequency estimated by AR modeling (FAR)
4. Strength of the dominant frequency estimated by AR modeling (STR) 5.1 Energy Index (EI):
Given a continuous-time signal f(t), the energy contained over a finite time interval is defined as follows.
(1)
(2)
Equation (1) defines the energy contained in the signal over time interval from T1 till T2. On the other hand, equation (2) defines the total energy contained in the signal. If the total energy of a signal is a finite non-zero value, then that signal is classified as an energy signal. Typically the signals which are not periodic turn out to be energy signals.
The equation for computing Energy index is
5.2 Respiration Frequency (FZX):
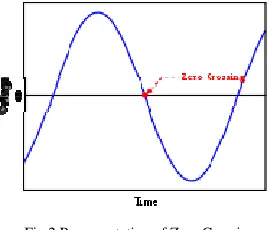
Zero-crossing is a commonly used term in electronics, mathematics, and image processing. In mathematical terms, a "zero-crossing" is a point where the sign of a function changes (e.g. from positive to negative), represented by a crossing of the axis (zero value) in the graph of the function as shown Fig.2.
Fig.2 Representation of Zero Crossing
Counting zero-crossings is a method used in speech processing to estimate the fundamental frequency of speech. The interval between zero crossings gives a good estimation of its frequency [7]. Similarly, Respiration frequency (FZX) was determined by counting the number of times that x(n) crosses a baseline which is defined as the square root of EI.
(4) The average respiratory rates in breaths per minute by age are given in Table 1.
Table 1: Average Respiratory rates by Age
Age Respiratory rate
(breaths per minute) Newborns 44
Infants 20-40
Preschool children 20-30
Older children 16-25
Adults 12-20 Adults during strenuous exercise 35-45
Athletes 60-70(Peak)
5.3 Dominant Frequency (FAR):
In order to obtain the features FAR and STR, coefficients of a second order AR model have to be estimated. The respiration signal can be modeled as a second order autoregressive model [4] as the following,
x(n)= x(n-1)+ x(n-2) + e(n) (5)
Where e(n) is the prediction error and {a1, a2} are AR model coefficients. Autoregressive (AR) spectral estimation techniques are known to provide better resolution than classical periodogram methods when short segments of data are selected for analysis. In our study, we adopted the Burg's method to compute AR coefficients. The major advantage of Burg method for estimating the parameters of the AR model are high frequency resolution, stable AR model and it is computationally efficient.
Using the second order autoregressive model coefficients, one can determine the dominant frequency and signal regularity strength as the following,
5.4 Strength of Dominant Frequency (STR):
The AR coefficients were used to determine STR value as,
(7)
Basically, FAR and STR serve the same purpose as power spectrum usually does, indicating the dominant frequency and its corresponding power level. The classification of the signal is based on derived parameters shown above and thresholds would be properly initialized to allow accurate classification.
The degree of reliability of the respiration rate estimate was determined by STR, which have a value between 0 and 1. For very regular rhythm, STR is very close to 1 (as in the case of normal respiration). If STR is too low, then the rate estimates FAR and FZX are deemed to be unreliable.
6. Implementation of Proposed Algorithm
The classification of the signal is performed by the sequential analysis of the signal in various phases of the program using MATLAB as,
Form the mathematical model of the input respiratory signal using second order auto regressive modeling as x(n)= x(n-1)+ x(n-2) + e(n)
Determine the various parameters of the derived mathematical model with the help of burgs algorithm.
Extract the four fundamental features of human respiratory signals with the help of the provided mathematical equations.
Compare the derived values with the optimum threshold values of the four fundamental features of the respiratory signal.
Produce the classified results of the respiratory signals.
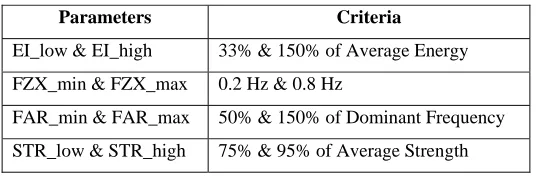
The criteria for determining the threshold values [1] are given in Table 2. Table 2: Criteria for Threshold Values
Parameters Criteria
EI_low & EI_high 33% & 150% of Average Energy FZX_min & FZX_max 0.2 Hz & 0.8 Hz
FAR_min & FAR_max 50% & 150% of Dominant Frequency STR_low & STR_high 75% & 95% of Average Strength
The Classification Algorithm can be stated as follows:
If
EI < EI_low & FZX = 0
Classify as SLEEP APNEA Else if
EI > EI_low & FZX_min <FZX <FZX_max& STR < STR_high & FAR > FAR_min
Classify as NORMAL
Else if
EI > EI_high & STR > STR_high & FZX_max < FZX < FZX_min
Classify as RESPIRATION WITH ARTIFACTS end
7. Simulation Results and Discussion
A Synthetic respiratory signal of 0.5 Hz is used for simulation. The signal was sampled at 16 Hz and the total of 255 data points is taken for analysis as shown in Fig.3.
0 50 100 150 200 -2
-1.5 -1 -0.5 0 0.5 1 1.5 2
The respiratory signal
samples
am
pl
it
u
de
Fig.3 Synthetic Respiratory signal
The threshold values for the features to be extracted from the signal are calculated as follows: 50 Samples of normal, apnoic and artifact respiration signal are synthetically generated with previous knowledge of energy index, respiration rate and dominant frequency of those signals. Criteria for calculating threshold values are applied to the generated data and nominal values for each classification are calculated. The nominal values are given in Table 3. The threshold values used for classification are approximated with the determined nominal values and are given in Table 4.
Table 3: Nominal Values for Classification
Sample EL EH SL SH FAR Min
Table 4: Approximated Threshold Values
Parameters Threshold
EI_low & EI_high 0.4 & 2 FZX_min & FZX_max 0.2 & 0.8 FAR_min & FAR_max 0 & 0.2 STR_low & STR_high 0 & 1
Respiration data was first manually scored for comparison. The epochs were then processed with the automatic classification algorithm and compared to manual classification. The respiratory signal after the removal of sleep apnea is as shown in Fig.4.
0 20 40 60 80 100 120 140 160 180 -4
-3 -2 -1 0 1 2 3 4
Fig. 4 Respiratory Signal without Sleep apnea
The classified results provided in Table 5 shows that the proposed algorithm is capable of classifying with the accuracy of 100% in case of normal and sleep apnoic signals. Few disagreements may be encountered with the detection of motion artifacts. The results obtained indicate that this algorithm can be an effective approach in respiration devices being developed to monitor infants at risk for SIDS and to accurately compute respiration rate on a regular base for selected patients.
Table 5: Simulation Result
Episode Manual Simulation
Normal 106 106
Artifact 58 58
Sleep apnea 61 61
8. Conclusion
This work can be developed and implemented in real time application for detecting sleep apnea. To develop this project in real time, we have to design a processor and the algorithm should be improved by adding calibration procedures and is adjusted to run on FPGA [5]. The electrical signals which are analog in nature should be converted into digital by analog to digital converter (ADC) and is given to the FPGA kit. Then the processor will process and detect the appropriate signal. LCD or PC monitor can be used to display the name of the signal.
References
[1] Walter Karlen, Claudio Mattiussi, and Dario Floreano: Sleep and Wake Classification with ECG and Respiratory Effort Signals, IEEE
Transactions on Biomedical Circuits and Systems, Vol. 3, No. 2, April 2009.
[2] Lorena S. Correa, Eric Laciar, Vicente Mut, Abel Torres,and Raimon Jané : Sleep Apnea Detection based on Spectral Analysis of
Three ECG - Derived Respiratory Signals, 31st Annual International Conference of the IEEE, EMBS, Minneapolis, Minnesota, USA,
September 2009.
[3]. Martin O. Mendez, Davide D. Ruini, Omar P. Villantieri, Matteo Matteucci ,Thomas Penzel, Sergio Cerutti ,Anna M. Bianchi :
Detection of Sleep Apnea from surface ECG based on features extracted by an Autoregressive Model, Proceedings of the 29th Annual
International Conference of the IEEE , EMBS, August 23-26, 2007.
[4] Maria I. Restrepo, Susmita Bhandari, and Taikang Ning,: Classification of Respiration Episodes using Fuzzy Logic, IEEE 2006
[5] Bozidar Marinkovic, Matthew Gillette, and Taikang Ning: FPGA Implementation of Respiration Signal Classification Using a
Soft-Core Processor, IEEE 2005
[6] Peter Varady, Szabolcs Bongar, and Zoltan Benyo: Detection of Airway Obstructions and Sleep Apnea by Analyzing the Phase
Relation of Respiration Movement Signals, IEEE Transactions on Instrumentation and Measurement, Vol. 52, No. 1, February 2003.
[7] Vladimir Friedman: A Zero Crossing Algorithm for the Estimation of the Frequency of a Single Sinusoid in White Noise, IEEE
Transactions on Signal Processing, Vol. 42, No. 6, June 1994.
[8] Taikang Ning and Joseph D. Bronzino: Automatic Classification of Respiratory Signals, IEEE Engineering in Medicine and Biology
Society, 11th
Annual International Conference, 1989.
[9] R. Ruangsuwana, G. Velikic, M. Bocko: Methods to Extract Respiration Information from ECG Signals, IEEE 2010.