1
An ASABE Meeting Presentation
DOI: 10.13031/aim.
2016
2461508
Paper Number: 16
2461508
Phase Doppler Flux Comparisons
Roten, Rory
1; Post, Scott
1; Hewitt, Andrew
21
Lincoln Agritech, Ltd., Lincoln University, Engineering Dr., Lincoln, Christchurch, 7640, New Zealand
2
University of Queensland, St Lucia, QLD, Australia
Written for presentation at the
2016 ASABE Annual International Meeting
Sponsored by ASABE
Orlando, Florida
July 17-20, 2016
ABSTRACT. The movement of droplets in time and space (i.e. flux) is essential to know when measuring and/or predicted spray drift via agricultural application. A study was performed to assess the flux measurements of a phase Doppler system against the standard string derived flux in a wind tunnel. The primary objective of the study was to compare flux from a new phase Doppler system against 1.7 mm cotton and 2.0 mm nylon strings at varying wind speeds (5, 15, 30, 45, and 60 km/h) and spray exposures times (5, 10, 15, 30, and 60 s) with an overarching hypothesis that the active, phase Doppler would be able to accurately measure the flux regardless of exposure and spray mass whereas the static string samplers will be limited to an undefined maximum retention. The phase Doppler did measure as linearly as expected, however strings did not reach a point in which they loss mass; conversely, they appear to be overloading. These findings are believed to be among many variables which influence the high variance of past mass balance works reported in the literature.
Keywords. Phase Doppler, flux, spray drift, droplets, string sampler.
Introduction
A series of studies have been orchestrated to assess the potential of an in-field phase Doppler interferometer (PDI) to quantify spray mass in the near source/sprayer zone with an overarching hypothesis that the lack of accounted spray in previous mass balance studies may be a culprit to the sampling in this region. Many samplers have been tested and results have greatly varied which is partially due to specific collection efficiencies, human error/handling, and physical properties and life of the tracer.
The first phase of these studies concluded that traversing through the diameter of a conical spray plume could accurately account for mass in controlled laboratory environments (Roten, Post, Werner, Hewitt, & Safa, 2016). Next phases will be to compare flux derived data from the PDI against different string types which are standard practice in drift and mass balance field trials, and finally determine the feasibility of using the PDI in the field as a potential replacement. If the PDI methodology should work, live, in-field, active data acquisition could reduce time post processing samples as well as provide immediate information regarding droplet spectrum, velocities, and flux.
It is the purpose of this paper to conclude the initial findings, add to previously reported data, present on-going field assessment, and to discuss future objectives of using this in-field PDI.
Materials and Methods
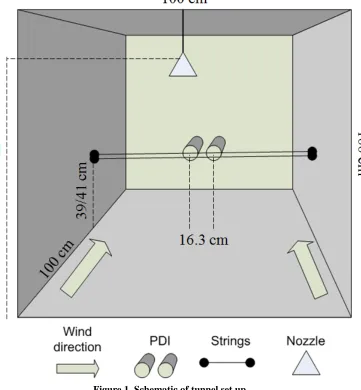
Wind tunnel assessment of strings versus PDI at high air velocities and long exposure times
Figure 1. Schematic of tunnel set up.
Sampling procedures – PDI vs. Strings
Treatment matrix included wind speeds of approximately 1.39, 4.17, 8.33, 12.5, and 16.67 m/s (5, 15, 30, 45, and 60 km/h, respectively) and spray exposure times of 5, 10, 15, 30, and 60 s. Wind speeds were tested at the point of sampling using a hand held anemometer (Kestrel 4500, Kestrel Meters, 2241 Cole Street, Birmingham, MI, USA).
For spray flux by way of static, string collectors, a spray solution which contained water and 1% v/v pyranine was added. After the given treatment was complete, samples were immediately harvested which consisted of the middle 16.3 cm (the distance between the two PDI uprights) and placed into individual re-sealable bags which were stored in a freezer until processing. The phase Doppler voltage was set at 250 V for all measurements which was validated beforehand to provide most reliable data based upon the density and volume of the spray. All samplers were replicated six times in total: three consecutive replications per day for two days. Consecutive replications were essential in the repeatability of the study as it is impractical to set the wind tunnel to exact setting.
Absorption vs. Adsorption
Two small studies to assess the physical differences of the two string collectors were performed. The first test was conducted in the wind tunnel where three cotton and three nylon strings were affixed alternatively, 2 cm apart in the center of the tunnel working section. The tunnel was set at 15 km/h wind speed and strings were exposed to the same pyranine spray for 90 s, a time in which saturation and loss of mass was apparent. Unlike the primary objective, strings for this purpose were left in the tunnel until dry (~20 minutes). The center, 16.3 cm were harvested, bagged and stored as previously mentioned. The second test placed three, 16.3 cm cotton and nylon string sections directly in a container of the pyranine solution. Strings were left for 5 minutes. At harvest, strings were individually removed from the solution with forceps and carefully bagged so that any droplets adhering to the string remained. Both studies were repeated in time.
data were separated by wind speed and exposure time and means separated using Tukey’s HSD (honest significance difference) with a 95% confidence level using R (version 3.2.0, R foundation for Statistical Computing, Vienna, Austria). R-square values were generated using SigmaPlot (version 13.0, Systat Software Inc., San Jose, California, USA).
On-going, in-field investigation of PDI versus strings
A study was conducted 19 May 2016 in Lincoln, New Zealand. Strings tested consisted of 2.0 mm nylon, 1.0 mm monofilament, and 1.8 mm cotton, all vertically suspended for 3.5 m on towers and towers were positioned at 1, 2, 3, 4, and 5 m from spray edge. An axial fan air-blast sprayer containing a solution of 0.2 g/l PTSA sprayed a 10 m swath at an application volume of 11.5 l/min. Strings were left to dry and harvest from lowest concentration to highest to avoid contamination. PDI measurements were taken with a vertical traverse as well as setting the PDI at incremental heights: 0 (bottom nozzle), 0.5, 1.0, 1.5, and 2.0 m. To avoid waste of dye, PDI and String measurements were taken at different times.
Results and discussion
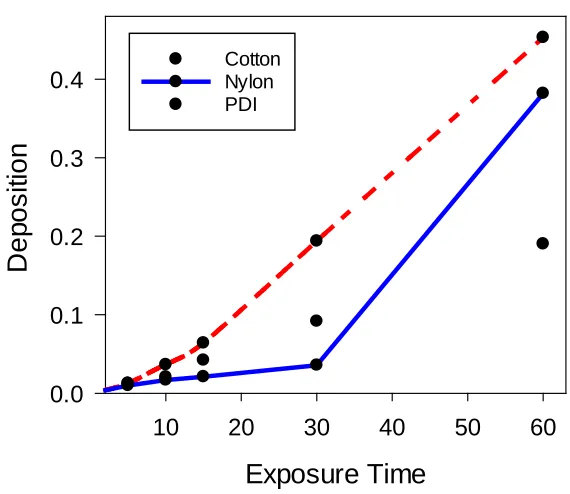
PDI versus string, expandedPDI data were removed for the 5 km/h treatment for this aspect of the study due to lack of data. There were few statistical differences between wind speed at the given exposed time, per sampler; therefore data were pooled by wind speed per sampler at each time interval for Figure 2, which is solely for illustration to express the overall trends of the samplers. From this, the initial hypothesis that the PDI will not become saturated and express a linear trend is confirmed. However, a point of saturation, plateau or decline was not observed with either string type as hypothesized. Instead, exponential accumulation with the nylon was observed beyond 30 s exposure time. Cotton strings performed with linearity though appear to be overloading. Statistically, both string types compared reasonably well with the PDI deposition data up to 30 km/h (Table 2). However, cotton and nylon samples exhibited maximum errors of 25% and 33% (respectively) while the maximum PDI error was only 1%. This would entail that in areas of high concentration/spray volume that measurements using strings samplers and therefore could be culprits of unaccounted spray mass which would support our hypothesis. A previous, similar study was reported (Roten et al. 2015) where no statistical differences were observed up to 4.5 m/s between PDI and 2 mm nylon strings. Data from both experiments support that in lower flux situations, all samplers exhibit little difference.
Exposure Time
10
20
30
40
50
60
D
ep
os
it
ion
0.0
0.1
0.2
0.3
0.4
Cotton Nylon PDIFigure 2. Deposition comparisons for cotton and nylon strings against phase Doppler against all exposure times (s).
Absorption versus Adsorption
substantially more than the nylon, 1,970 µg/l ± 113 compared to 238 µg/l ± 30, respectively. Surprisingly however, when the strings were exposed to saturation in the wind tunnel, the adhesion of the nylon strings out performed that of the absorption ability of the cotton, 1003 µg/l ± 174 compared to 566 µg/l ± 23, respectively. Cotton in a neutral position is likely to be the culprit behind this: when this string was mounted in the tunnel, it was apparent that the string got moderately stretched and therefore not as permeable.
Figure 3. Illustration of saturation and droplet accumulation on nylon (upper) and cotton (lower) strings.
In-field investigation of PDI versus strings
Traversing through the spray plume did not perform as expected due to turbulence and erratic behavior of spray mass. Therefore these data were dropped and the static positions are reported. As can be seen from Figure 4, the PDI was able to detect mass from 1 to 5 m away from the sprayer; however string data have yet to be processed to correlate these procedures. A common limitation for all phase Doppler measures is the sampling frequency whereas >10,000 counts are needed for statistical validity (Dullenkopf et al., 1998; Nuyttens, Baetens, De Schampheleire, & Sonck, 2007; Parkin, 1993; Tratnig & Brenn, 2010). The current experiment only observed 2 to 491 counts. Next phases will include the current methods as well as the same incremental heights and distances with the sprayer static.
Figure 4. PDI flux measurements by incremental height and distance 1, 2, 3, 4, and 5 m from spray source.
0.0 0.5 1.0 1.5 2.0 2.5 3.0
0 0.005 0.01 0.015
Ver
tic
al
H
ei
gh
t (
m
)
Liquid Spray Flux (ml/cm2/s)
References
Dullenkopf, K., Willmann, M., Wittig, S., Schöne, F., Stieglmeier, M., Tropea, C., & Mundo, C. (1998). Comparative Mass Flux Measurements in Sprays using a Patternator and the Phase-Doppler Technique. Particle & Particle
Systems Characterization, 15(2), 81-89.
doi:10.1002/(SICI)1521-4117(199804)15:2<81::AID-PPSC81>3.0.CO;2-A
Nuyttens, D., Baetens, K., De Schampheleire, M., & Sonck, B. (2007). Effect of nozzle type, size and pressure on spray
droplet characteristics. Biosystems Engineering, 97(3), 333-345.
doi:http://dx.doi.org/10.1016/j.biosystemseng.2007.03.001
Parkin, C. S. (1993). Methods for measuring spray droplet sizes Application Technology for Crop Protection (pp. 57-84). Roten, R. L., Post, S. L., Werner, A., Hewitt, A. J., & Safa, M. (2016). Volumetric validation of mass balance using a
computational phase Doppler approach for disc core nozzles. Crop Protection, 79, 128-134. doi:http://dx.doi.org/10.1016/j.cropro.2015.10.018
Roten, R.L., Ferguson, J.C., Connell, R.J., Dorr, G.J., Hewitt, A.J. (2015) Preliminary investigation of Phase Doppler derived flux measurements in a wind tunnel for the sampling of orchard spray drift. Suprofruit, Lindau, Germany.
Tratnig, A., & Brenn, G. (2010). Drop size spectra in sprays from pressure-swirl atomizers. International Journal of