www.pharmascholars.com
157
Research Article
CODEN: IJPNL6
PRODUCTION, OPTIMIZATION AND CHARACTERIZATION OF
ANTIMICROBIAL COMPOUND FROM
ASPERGILLUS
SP
Daljit Singh Arora
a*, Harpreet kaur
a, Jemimah Gesare Onsare
aand Vishal Sharma
ba
Microbial Technology Laboratory, Department of Microbiology, Guru Nanak Dev University,
Amritsar-143005, India
b
Department of Pharmaceutical Sciences, Guru Nanak Dev University, Amritsar-143005, India.
*Corresponding author e-mail:
[email protected]
ABSTRACT
Fungihave been reported to be active producers of secondary metabolites. In this study, a fungal isolate (Aspergillus
sp) isolated from soil has been evaluated for its antimicrobial activity. The activity was studied under various physio-chemical parameters, such as pH, temperature, incubation period, carbon and nitrogen sources. The best antimicrobial activity was observed in the production medium having pH 5-7, on fifth day of incubation at 25 ºC when grown as static culture. Starch was the most promising carbon source, while yeast extract and soyabean meal acted as best nitrogen sources. Butanolic extract was comparable to standard antibiotics in contrast to aqueous
extract. Response surface analysis showed that the antimicrobial activity was enhanced by 1.25 folds in S.aureus,
1.28 folds (S.epidermidis), 1.6 folds (K.pneumoniae 1), 1.37 folds (C.albicans), 1.38 folds (MRSA). Characterization
of the purified compound responsible for antimicrobial activity was carried out by various analytical procedures i.e. TLC, HPLC, NMR and IR. MIC of the butanolic extract ranged from (0.016mg/ml-18mg/ml) while purified
compound exhibited lower MIC value of 6µg/ml, 20 µg/ml and 20 µg/ml respectively for S.epidermidis, C.albicans
and MRSA. VCC (Viable cell count) studies revealed E.coli to be the most sensitive and demonstrated 100% killing
at 0 hr. Butanolic extract (crude) and the purified compound were found to be neither cytotoxic nor mutagenic.
Key words: Aspergillus, Antimicrobial, Minimum inhibitory concentration, Viable cell count, Bioactive compound, Resistance.
INTRODUCTION
Microbial populations are the most promising sources of natural secondary metabolites. Fungi produce a wide range of such products with therapeutic value as antibiotics, along with many other bioactive compounds of pharmaceutical and agricultural use.
Many Aspergilli have been reported to be the active
producers of different secondary metabolites with various bioactivities such as antiviral, antimicrobial, tumor suppressing, antihypercholesterolemic and
immunosuppressant activities [1]. Soil holds an
enormous biodiversity that can be screened for various bioactive metabolites. Number of fungi showing different biological activities have been listed in the literature, still a lot remains untapped from diverse soil habitats. Further, bacterial
resistance is spreading throughout the world, revealing the steadily decreasing potencies of
prevalent antibiotics [2]. Strains of methicllin resistant
Staphylococcus aureus have increased to an alarming
number leading to many infectious diseases, so there is a need to explore and expand the spectrum of suitable organisms yielding novel antimicrobials. Keeping this in mind, the present study was designed to screen the fungi from soil collected from different areas of Punjab (30˚ 4’ N 75˚ 5’ E) for their antimicrobial activity. One such promising isolate, was perused further for optimization of various physiochemical parameters to enhance the production of antimicrobial agent/s. Minimum inhibitory concentration and viable cell count has been carried out to check the bacteriostatic or bactericidal nature
of the butanolic extract of Aspergillus sp. Purification
International Journal of Pharmacy
www.pharmascholars.com
158
of the compound was carried out by various analytical techniques and toxicity testing was done by AMES mutagencity test and MTT assay.
MATERIALS AND METHODS
Fungal isolation and extract preparation: The
organism used for study was isolated from soil and
maintained by standard procedures. It was identified by National Fungal Culture Collection of India, Agharkar Research Institute, Pune, India and found close to be Aspergillus wentii gr, where it has been deposited with vide accession no (NFCCI 2565). The GenBank accession no of the sequence reported in this paper is KF039712. The isolate was grown in YPDS medium and the filtrate obtained was used for testing antimicrobial activity [3].
Test organisms: The reference strains of bacteria and two yeasts, used for testing their sensitivity to fungal extracts, were obtained from Microbial Type Culture
Collection (MTCC), Institute of Microbial
Technology (IMTECH), Chandigarh, India and the
clinical isolate methicillin resistant Staphylococcus
aureus (MRSA) was obtained from Post graduate
Institute of Medical Education and Research, (PGIMER), Chandigarh, India. Reference strains
included Gram positive bacteria –Enterococcus
faecalis (MTCC439), Staphylococcus aureus
(MTCC740), Staphylococcus epidermidis
(MTCC435). Gram negative bacteria Escherichia
coli (MTCC119), Klebsiella pneumoniae 1
(MTCC109), Klebsiella pneumoniae 2 (MTCC530)
Pseudomonas aeruginosa (MTCC741) , Salmonella
typhimurium1 (MTCC-98), Salmonella typhimurium2
(MTCC1251), Shigella flexneri (MTCC1457) and
two yeast strains viz Candida albicans (MTCC227),
Candida tropicalis (MTCC230) .The bacterial
cultures were maintained on nutrient agar slants,
except Enterococcus faecalis which was maintained
on Trypticase soya agar . Candida albicans and
Candida tropicalis were respectively maintained on
yeast malt agar and Sabouraud agar.
Inoculum preparation: A loopful of isolated bacterial and yeast colonies were inoculated into 5ml of their respective medium and incubated at 37˚C and 25˚C respectively for 4h. This was used as inoculum after adjusting the turbidity as per Mc Farland turbidity standard. This turbidity is equivalent to
approximately 1 to 2 × 10⁸ colony forming units per
ml (CFU/ml). The inoculum thus prepared was used further for further testing [3].
Determination of fungal biomass: The dry weight of the fungal mycelium was measured after repeated
washing of the mycelium with distilled water and drying overnight at 70˚C to a constant weight.
Screening the fungal extract for antimicrobial activity: The fungal extract was tested against different microbial cultures grown on their respective media by agar well diffusion assay. The plates were incubated at 37˚C and 25˚C for 24h and diameter of
resultant zone of inhibition was measured.
Experiments were run in duplicate for each combination of extract and microbial strains.
Optimizing the physiochemical parameters and
media components: To optimize various
physiochemical and nutritional conditions, the aqueous extract obtained after growing the fungi under various physiochemical parameters, were tested for their respective antimicrobial activity by
agar well diffusion method along with
thermostability studies of the fungal extract [3].
Effect of different carbon and nitrogen sources: To study the effect of different carbon and nitrogen sources ,total carbon sources i.e. dextrose and starch in YPDS medium were replaced by a single carbon source (dextrose, starch, sucrose, lactose or maltose) at a concentration of 1%, Similarly, to work out the effect of nitrogen sources in the YPDS medium, yeast extract and peptone were replaced with one or the other nitrogen rich sources (sodium nitrate, yeast extract, soybean meal, potassium nitrate, ammonium
chloride, ammonium sulphate, ammonium
dihydrogen phosphate, ammonium nitrate, peptone, malt extract, urea and casein) at a concentration of 1%.
Fractionation of extracts: The fungal extract obtained was extracted with different solvents viz diethyl ether, chloroform, butanol, hexane and ethyl acetate as described previously [3].
Comparison of antimicrobial activity of butanolic extract with some standard antibiotics: In order to compare the effectiveness of the extract, their activity was compared with some standard antibiotics by agar diffusion method.
www.pharmascholars.com
159
extract it was 0, 0.4% and 0.8% .The experimental
design included 17 flasks with five replicates having all the three variables at their central coded values. The mathematical relationship of response G (for
each parameter) and independent variable X (X1,
dextrose; X2, Starch; X3, Yeast extract) was
calculated by the following quadratic model equation
[4].
G = β0 + β1X1 + β2X2 + β3X3 + β11X1 2
+ β22X2 2
+
β33X32 + β12X1X2 + β13X1X3 + β23X2X3
Where, G is the predicted response; β0, intercept; β1,
β2, and β3, linear coefficients; β11, β22 and β33,
squared coefficients and β12, β13 and β23 interaction
coefficients. MINITAΒ statistical software was used to obtain optimal working conditions and generate response surface graphs. Statistical analysis of experimental data was also performed using this software.
Minimum inhibitory concentration (MIC):
Minimum inhibitory concentration of the butanolic
extract was worked out by agar dilution method [5],
with final concentrations ranged from (0.016mg- 18mg/ml). The experiment was performed in duplicate and repeated three times.
Microbicidal activity: Microbicidal activity of the
butanolic extract of Aspergillus sp was measured by
viable cell count studies [6], with a stock solution of (100mg/ml). The mean number of colonies were determined and compared with that of control in which the butanolic extract was replaced with DMSO.
Extraction and purification of active components from butanolic extract of Aspergillus sp: For the
extraction and purification of active
group/component from Aspergillus sp, 3 litres of the
culture broth was extracted with equal volume of butanol (1:1) .The organic layer was separated and treated with Na2SO4 and then evaporated to dryness
in vaccuo and the resulting solids (3g) were subjected to column chromatography using silica gel (100-200 mesh size, column 18mm×300mm) packed and pre-equilibrated with hexane. The column was first eluted with equilibration solvent i.e. hexane (2 bed volumes) followed by linear gradients of Hexane : Butanol (100:0, 90:10, 80:20, 70:30, 60:40, 50:50, 40:60, 30:70, 20:80, 10:90, 0:100) at a flow rate of 1ml/min. A total of 65 fractions were collected and the fraction size kept to 20ml. Each fraction after concentration was subjected to thin layer chromatography and agar disc diffusion assay. Butanol: Hexane (9:1) was used as screening system to develop the chromatograms which were observed under UV light (254 and
365nm) and in iodine chamber. Fractions which
showed similar TLC pattern were pooled,
concentrated and again loaded to silica gel (100-200 mesh size), column (10mm×300mm) and pre-equilibrated with hexane (2 bed volumes). The column after elution with hexane was eluted with linear gradients of Butanol: Hexane (as above) and fraction size reduced to 5ml. The collected fractions were tested for antimicrobial activity, thin layer chromatography and HPLC.
HPLC Analysis: The purified fraction was subjected to high pressure liquid chromatography (HPLC) using Dionex P680 HPLC. Acetonitrile (75% aqueous solution) was used as mobile phase at a flow rate 0.3ml/min and injection volume was 20µl at a column temperature of 25 ºC. The detections were monitored at different wavelengths (225,250,275 and
300nm). NMR spectroscopy (H1 and C13) was
outsourced from Punjab University, Chandigarh and the data were recorded on 400 MHz Bruker. IR spectrum of the purified compound was recorded on
varian 660-IR Fourier Transform Infra-Red
Spectrometer. UV spectrum was measured on
Shimadzu UV mini 1240 UV-visible
spectrophotometer.
Safety evaluation: Butanolic extract of the fungus and the purified compound were subjected to Ames
test to evaluate their mutagenicity [7] by using
S.typhimurium (MTCC 1251, IMTECH,
Chandigarh), while their toxicity was determined by MTT (3-(4, 5-di methylthiazole-2yl)-2, 5-di phenyl tetrazolium bromide) assay. The absorbance was measured at 570 nm using an automated microplate
reader (Biorad 680-XR1 Japan). The wells with
untreated cells served as control [8].
RESULTS
On the basis of colony characteristics and microscopic morphology, the isolated fungus was identified as Aspergillus sp. close to A. wentii gr. (HT-113) by Agharkar Research Institute, Pune. The purified amplified internal transcribed spacer (ITS) region was sequenced by single primer analysis (SPA) services (Genei, Bangalore, India). The ITS sequence was deposited with NCBI gene bank with access No (KF039712). The fungus grown on Yeast extract glucose agar medium at 25˚C for 8 days. The aqueous extract of the selected fungal isolate showed antimicrobial activity against four bacteria and one
yeast. MRSA was the most sensitive organism with a
inhibition zone of 27mm followed by C. albicans
(26mm) S.epidermidis (25mm), S.aureus (24mm) and
www.pharmascholars.com
160
Effect of incubation period and other growth conditions: Maximum biomass (8.34mg/ml) and antimicrobial activity against most of the organisms was found on day 5 which remained more or less
stable upto day 9. MRSA was the most sensitive
organism with inhibition zone of 28mm, followed by
C. albicans, S. aureus, S. epidermidis and K.
pneumoniae 1. Further experiments were carried out
for 5 days incubation period. The antimicrobial activity was better expressed under stationary conditions as compared to shake flask cultures. With increase in revolutions per minute (RPM), fungus showed a reasonable decline in its biomass as well as
antimicrobial activity against all the five
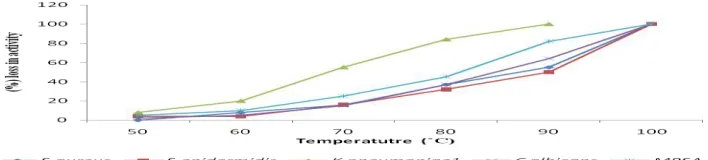
microorganisms. Thus, further experimentation was carried out under static conditions only. Maximum antimicrobial activity and fungal biomass was recorded at 25˚C while the fungus was not able to grow above 30˚C. The antimicrobial activity was completely lost on heating the aqueous extract at 100˚C for 1hr whereas up to 60˚C it suffered a moderate loss in activity (4-20 %) and with a further loss in activity at 80˚C. (Fig.1). Relatively low antimicrobial activity was expressed at pH 3- 4 which increased from pH-5 and remained more or less stable upto pH 7 and declined, subsequently indicating the pH optima between pH 5-7.
Effect of carbon and nitrogen sources: Starch was the best carbon source and the order of antimicrobial activity for different carbon sources was starch > dextrose > lactose > maltose>sucrose .Maximum biomass was recorded in the presence of maltose, however, the antimicrobial activity exhibited by both maltose and sucrose was not statistically significant at 5% confidence level. Analysis by fischer’s LSD procedure indicated starch containing media to be the best amongst the other the carbon sources tested. (Fig.2). similarly, yeast extract was the best among organic and inorganic nitrogen sources. Soybean meal and peptone were also good sources of nitrogen for bioactivity while fungal biomass was maximum in the former medium. The fungus was not able to grow in the presence of urea. However, other nitrogen sources showed variable biomass without supporting any antimicrobial activity.
Effect of media components and their concentration
In experimental setup I, the maximum antimicrobial activity was observed at 1% dextrose which declined appreciably at 4% and showed no activity at all at 6% against any bacteria except the yeast strain which showed only a moderate decline up to 10% dextrose. Similarly, in set up II, maximum biomass was obtained at the highest concentration of starch i.e. 10% while the best antimicrobial activity was
observed at 1% starch which declined with further increase in the concentration. In the third set of experiment, 1% peptone gave the best antimicrobial activity which was more or less stable upto 2%. Similarly, when the fungus, was grown in setup (IV), the antimicrobial activity was maximum at 1% yeast extract and decreased with increase in its concentration. Biomass of the fungus increased with increase in concentration of nitrogen sources. Thus, to work out the combined effect of carbon and nitrogen sources, these were respectively tested at 1% concentration.
Box-Behnken design for statistical optimization of carbon and nitrogen sources
Fitting the model
The data obtained from quadratic model equation was found to be significant. It was verified by F value and the analysis of variance (ANOVA) by fitting the data of all independent observations in response surface
quadratic model. The results for model F-value
implies that the model is significant which indicate it to be suitable to represent adequately the real
relationship among the parameters used. R2 value for
all the responses ranged between 90 -95.1%, which showed suitable fitting of the model in the designed experiments. The final predictive equations for each
response S.aureus (G1), S.epidermidis (G2), K.
pneumoniae1 (G3), C. albicans (G4), MRSA (G5)
obtained are as follows (G1 )
25+2.75X1+6.125X2+0.125X3-2X12-1.25X22-6.75X32
-0.25X1X2+0.25X1X3-1X2X3
(G2 )
26+2.75X1+6.125X2+0.125X3-1.80X12-1.05X22
-6.55X32-0.25X1X2+0.25X1X3-1X2X3
(G3)
16.6+1X1+4.375X2+0.875X3-0.05X1
2
+1.20X2
2
-2.80X32+0.25X1X2-0.25X1X3-1.5X2X3
(G4)
30+2.75X1+7.25X2-0.25X3-0.75X12-1.75X22-7.75X32
-0.50X1X2-0.0X1X3-0.50X2X3
(G5)
29.2+2.625X1+7.75X2-0.375X3-0.60X12-1.35X22
-7.1X32-0.75X1X2-0.0X1X3-0.75X2X3
The optimized values for factors were validated by repeating the experiment in triplicates
1) (G1) Linear effect of starch (X2) and squared
effect of yeast extract(X32) was highly
significant with P value ≤ 0.005 similarly linear (X1) and squared effect(X12) of dextrose
www.pharmascholars.com
161
2) (G2) Similarly linear effect of starch (X2) and
squared effect of yeast extract (X3 2
) was highly significant with P value ≤ 0.005. Linear effect of
dextrose (X1) and squared effect of starch (X22)
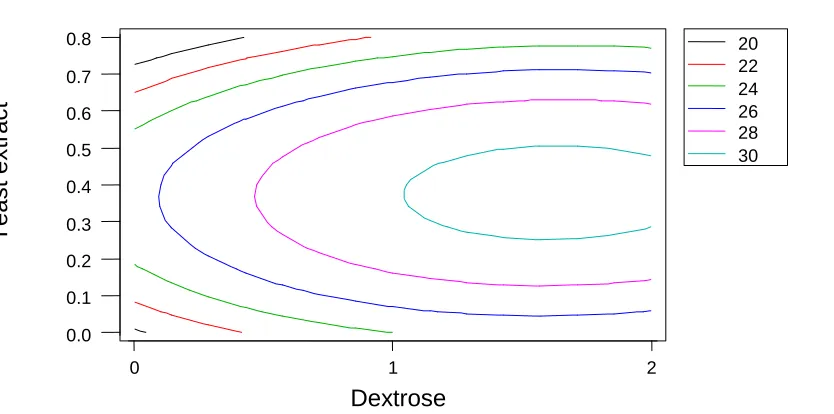
was significant with P value ≤ 0.05 and ≤ 0.5 respectively. Highest activity was found with Dextrose 1%-2%, Starch 2% and yeast extract 0.4% (Fig.3b).
3) (G3) Linear effect of starch (X2) was highly
significant with P value ≤ 0.005.Squred effect of
yeast extract (X3
2
) and starch (X2
2
) was also significant with P value ≤ 0.05 and ≤0.5 respectively. Linear effect of dextrose (X1) and
yeast extract (X3)significant with and P value
≤0.5 respectively. The response surface graph showed highest activity at 2% Starch, 2% Dextrose and Yeast extract 0.4% (Fig.3c). 4) (G4) Linear effect of starch (X2) and squared
effect of yeast extract (X32) was highly
significant with P value ≤ 0.005. Linear effect of
dextrose (X1) and squared effect of starch (X22)
was significant with P value ≤ 0.05 and ≤0.5
respectively. The response surface graph of (G4)
showed highest activity at Starch 2%, Dextrose
2%, Yeast extract 0.4% (Fig.3d).
5) (G5)Linear effect of starch (X2) and squared
effect of yeast extract (X3
2
) was highly significant with P value ≤ 0.005.Similarly linear
effect of dextrose (X1) and squared effect of
starch (X22) was significant with P value ≤ 0.05
and ≤ 0.5, respectively. Thus the highest activity was expressed at Starch 2%, Dextrose 2% and Yeast extract 0.4%. (Fig.3e).
Validation of Results
Thus from the overall assessment 2% Dextrose, 2% starch and 0.4% yeast extract and (1%) peptone in YPDS medium may be regarded as the optimized conditions for antimicrobial activity The F value and
R2 value showed that the model correlated well with
measured data and was statistically significant. To confirm the adequacy of the model the verification experiments using optimum medium composition as described above were carried out in triplicates. The results showed the antimicrobial activity was
enhanced by 1.25 folds in S.aureus, 1.28 folds
(S.epidermidis), 1.6 folds (K.pneumoniae 1), 1.37
folds (C.albicans), 1.38 folds (MRSA).
Solvent extraction and antibacterial activity:
Antimicrobial activity of different solvents indicated that chloroform, ethyl acetate, petroleum ether, hexane and aqueous extract were not significantly different at 5% confidence level with an inhibition zone range of 11mm to 30mm. Butanol demonstrated to be the best extractant with inhibition
zone range of 14mm to 43mm for all test organisms (Fig 4). DMSO was used as negative control and it,
did not show any activity. S.aureus, S.epidermidis
and K. pneumoniae1 were the most sensitive and the
inhibitory zone ranged from 24 to 43mm. Similarly,
methicillin resistant. Saureus gave a maximum zone
of inhibition (29mm). Hexane extract was least effective and inhibited only three microorganisms i.e.
K.pneumoniae 2, MRSA and C. albicans.
K.pneumoniae 2 which was found resistant to
aqueous extract was found to be sensitive to chloroform , butanol, petroleum ether and hexane extract. As, butanol was found to be the best organic solvent responsible for antimicrobial activity in terms of zone size as well as number of sensitive microorganisms (Fig 4.), so it was used for further studies.
Comparison of antimicrobial activity of butanolic extract of Aspergillus sp with some standard antibiotics: Butanolic extract of Aspergillus sp
exhibited better activity against S.aureus, K.
pneumoniae 1, MRSA and C. albicans, better than
even standard antibiotics. E. faecalis which was
resistant to most of the antibiotics was sensitive to butanolic extract with an inhibition zone of 27mm.
E.coli resistant to co-trimaxazole and ampicillin gave
22mm zone of inhibition. MRSA was resistant to
many antibiotics but was sensitive to the butanolic extract. (Table 1)
MIC of butanolic extract of Aspergillus sp: The MIC values were strain dependent. MIC of butanolic
extract ranged from 0.016mg-18mg/ml.
K.pneumoniae 1 and S.epidermidis were found to be
most sensitive and inhibited at (0.016mg/ml)
followed by S aureus (0.1mg/ml), C.albicans
(0.5mg/ml), E. faecalis and MRSA (1mg/ml)
S.typhimurium 2 and E.coli (5mg/ml), Sh.flexneri
(6mg/ml) while P.aeruginosa and S.typhimurium 1
gave the highest MIC values (18mg/ml).
Viable cell count: On the basis of MIC of butanolic extract obtained for different organisms they were subjected to viable cell count studies. Complete
killing of E.coli was observed at 0 hr. S.epidermidis,
S.typhimurium 2 and MRSA were killed at 4hrs while
S.aureus took 6hrs for complete killing.
S.typhimurium 1 took the longest time and showed
99.5% killing at 12 hr while the residual cells restarted their growth after 12 hrs (Fig.5).
www.pharmascholars.com
162
to TLC and the active fractions (fraction no 40-50)
were effective against S.epidermidis ,K.pneumoniae1,
MRSA , C.albicans, S.typhimurium 2 with inhibition
zone ranging from 18 -25mm . The fractions having
the same Rf values (0.8 cm) were pooled and again
loaded on to column. In the second column with total
55 fractions, fraction no 20 to 29, having same Rf
values (0.7cm) showed antimicrobial activity (18 to 20mm) were again pooled and concentrated for further checking their activity and TLC. One single band was observed on TLC under UV-225 and iodine
chamber with Rf value (0.7cm) (Fig.6a, 6b). The
active fraction was subjected to HPLC analysis and the single peak of the compound indicates its purity (Fig.7). The retention time for the compound was 8.924 min which were further analyzed for NMR, and IR. MIC of the compound obtained was found to
be 6 µg/ml with S.epidermidis, 20 µg/ml with
C.albicans and 20 µg/ml with MRSA. The UV
spectrum of the fraction demonstrated maximum
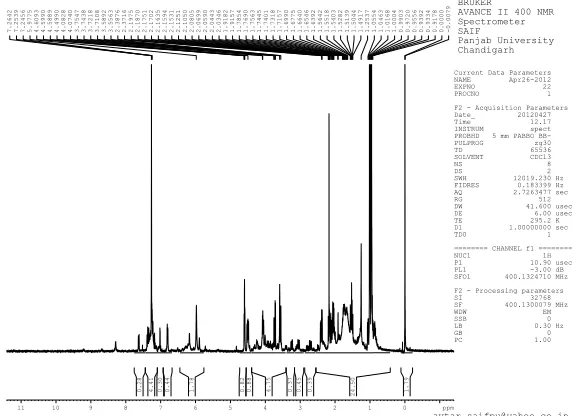
absorbance at 210nm (Fig.8). 1H NMR of the
isolated compound showed peaks in the range of
7.9-6.8ppm that correspond to aromatic groups. 1H NMR
showed some resonance at alkenic region indicating the presence of some alkenic proton in unknown compound. In addition aliphatic region was also observed from 2.3-1.5ppm. The presence of –OH group is indicated from the broad peak observed at
8.6ppm. (Fig. 9). 13C NMR also showed the peak at δ
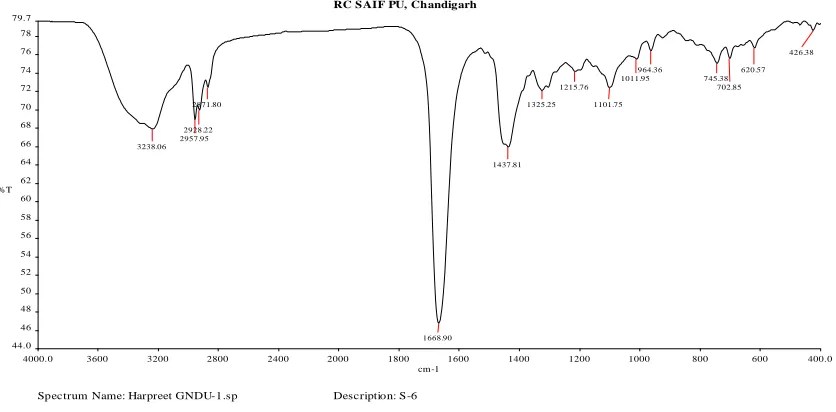
170.9 which may be due to (C=O) group which was further confirmed by its IR spectrum that showed
carbonyl stretching at 1668 cm-1 (Fig.10). 13C NMR
of the compound showed the presence of both aliphatic and aromatic region which ranged from 68.05-21.44 and 165.2-127.5 respectively. The IR spectrum of the compound showed band at 3238.06
cm-1 indicating the presence of –OH group. The
bands corresponding to C=O, C-O and C=C were
observed at 1668.9, 1437.8 and 2928.2 cm-1
respectively. Similarly the bands ranging from
1325.2- 964.3 cm-1, confirmed the presence of methyl
or methylene group (Fig.11).
Toxicity testing: The numbers of revert ant colonies in the positive control were numerous, whereas the bacteria incubated with the butanolic extract and
purified compound isolated from Aspergillus sp did
not show any revert ant colonies. The glucose minimal agar media plates layered with top agar containing excess of biotin and no histidine also served as control as no colonies were observed. Since, reduction of [3-(4,5-dimethylthiazol-2-yl)-2,5-diphenyl tetrazolium bromide (MTT) can only occur in metabolically active cells, where MTT is converted to insoluble formazan crystals that are dissolved in DMSO and the absorbance of purple
colored solutions directly represents the viability of the cells. In the present studies, 95.4% and 96% of the viable cells were observed in butanolic extract and purified compound respectively showing the extracts to be noncytotoxic.
DISCUSSION
Natural products isolated from different fungi play an important role in human medicine. Each fungal species make its unique set of secondary metabolites, to complement its own biological traits, and a large
number of compounds await discovery in Aspergillus
as a whole. In the present study, Aspergillus sp was explored for its potential antimicrobial activity. Optimization studies revealed 5 days incubation period to be optimal for maximum production of antimicrobial activity which is in consonance with
earlier studies [9]. The subsequent decline in the
antimicrobial activity may be attributed to depletion of nutrients in the medium required for the growth. However, the time course for production of antimicrobial agent differs according to the strain and cultivation conditions; for instance, the maximum antimicrobial agent production was achieved after 4
days of incubation of Cladosporium sp [10]. Maximum
biomass and antimicrobial activity were best expressed under static culture conditions in
consonance with earlier studies [11-13]. Fungal growth
at different temperatures revealed 25˚C to be the optimum for growth and metabolite production
similar to earlier observations [14-16]. Low
temperature may slow down the metabolic activity and high temperature may kill the organism and inactivate the responsible antimicrobial compound
[17]. The antimicrobial activity and biomass
production was optimally best between pH 6-9. This may be due to better metabolite production under such pH conditions. The pH is related to permeability characteristics of the cell wall and membrane and thus has got effect on either ion uptake or loss to the nutrient medium and may also be governing the
extracellular release of requisite metabolites [17].
These observations corroborate the previous studies
on Aspergillus fumigatus and Varicosporina
ramulosa[18-19]. Rubini et al. [20] reported the growth
and antimicrobial agent production at neutral pH. One percent starch was optimum for antibiotic production which decreased with increase in its concentration while the biomass increased. This might be due to its suppressive effect on production of secondary metabolites and is in consonance with
other studies [21]. Other carbon sources that can
readily serve as growth substrates, often repress secondary metabolites. During formulation of
www.pharmascholars.com
163
oligosaccharides are often found to be better than
monosaccharide for antibiotic production [22]. In
consonance with earlier studies [17, 23-25] yeast extract (2%) was found to be the best nitrogen source for antimicrobial as well as biomass production. Thermostability studies revealed the compound responsible for antimicrobial activity to be quite stable at 50˚C. The application of statistical
experiment designs in fermentation process
development can result in improvement of product yield and reduce process variability. Moreover, it is an efficient way to generate useful information with limited experimentation, thereby cutting the process development time and cost. Response surface
methodology resulted in enhancement in
antimicrobial activity ranging from 1.25 to 1.6 folds. A good agreement between the predicted and experimental results verified the validity of the model and the improvement of antimicrobial activity indicated the RSM to be a powerful tool for determining the exact optimal values of the individual factors and the maximum response value. These results are comparable with the antimicrobial activity of other microorganisms such as bacteria,
actinomycetes and fungi [26]. Butanolic extract
demonstrated the maximum antimicrobial activity
including methicillin resistant S.aureus and also
including those resistant to aqueous extract. Our observations with butanol extract are in consonance
with earlier studies [16]. MIC of butanolic extract
ranged from (0.016mg/ml- 18mg/ml) and also supported the data obtained by agar well diffusion
assay. S.epidermidis and K.pneumoniae
1(0.016mg/ml) were found to be the most sensitive while S.typhimurium 1 and P. aeruginosa were least sensitive with highest MIC values of 18mg/ml. It got credence from viable cell count studies in which
S.typhimurium 1 took the longest time of 12hrs for
99.5% killing and again started growing after 12hrs
of incubation. E.coli was found to be killed instantly
at 0hr. The importance of the study was further highlighted where the butanolic extract showed higher or comparable activity than standard antibiotics. Resistant strains like MRSA, found to be resistant to some of the antibiotics was sensitive to
butanolic extract of Aspergillus sp. This might be due
to effective elution of broad spectrum antimicrobial compound. Purification of the compound resulted in one single band as observed on TLC, with HPLC, single peak was detected at retention time 8.924 min. UV –Vis spectra also showed one peak with maximum absorbance at 210nm and purified compound when tested by disc diffusion method, showed a good zone of inhibition against different microorganisms with a MIC value of 6µg/ml, 20
µg/ml and 20 µg/ml respectively for S.epidermidis,
C.albicans and MRSA respectively. These results are
also comparable with earlier MIC studies [27-28]. This
also proved the purity of the compound as MIC of the butanolic extract was higher than the purified compound. The present study get further importance as the purified compound did not show any cytotoxicity or mutagenicity thus validating it as potential antimicrobial agent. The above study
suggests Aspergillus sp as a potential candidate
offering a better scope for the production and
purification of broad spectrum antimicrobial
compound. These findings will facilitate the further studies to gain better understanding and production of bioactive metabolites by fungi and will be helpful in
their biotechnological mass production in near future.
ACKNOWLEDGMENTS
Harpreet Kaur is thankful to University Grants Commission for Maulana Azad National Fellowship [F.40-50(M/S)/2009(SA-III/MANF)].
www.pharmascholars.com
164
Figure 2. Effect of different carbon sources on antimicrobial activity.
Figure 3a. Contour Plot of
Staphylococcus aureus
20 22 24 26 28 30
2 1
0 0.8
0.7
0.6
0.5
0.4
0.3
0.2
0.1
0.0
Dextrose
Hold values: starch: 2.0
Y
e
a
st
e
x
tract
www.pharmascholars.com
165
Figure 3b. Contour Plot of
Staphylococcus epidermidis
Figure 3c. Contour Plot of
Klebsiella pneumoniae
1
13 15 17 19 21 23
2 1
0 0.8
0.7
0.6
0.5
0.4
0.3
0.2
0.1
0.0
Starch
Y
e
a
st
e
xtrac
t
Hold values: Dextrose: 2.0
22 24 26 28 30 32
2 1
0 0.8
0.7
0.6
0.5
0.4
0.3
0.2
0.1
0.0
Dextrose
Hold values: starch: 2.0
Y
e
a
st
e
xtrac
www.pharmascholars.com
166
Figure 3d. Contour Plot of
Candida albicans
Figure 3e. Contour Plot of
MRSA
21 26 31 36
2 1
0 0.8
0.7
0.6
0.5
0.4
0.3
0.2
0.1
0.0
Starch
Hold values: Dextrose: 2.0
Y
e
a
st
e
xtrac
t
27 29 31 33 35 37
2 1
0 0.8
0.7
0.6
0.5
0.4
0.3
0.2
0.1
0.0
Dextrose
Hold values: starch: 2.0
Y
e
a
st
e
xtrac
www.pharmascholars.com
167
Aqs-Aqueous extract, Chl-Chloroform extract, But- Butanol extract, EA-Ethyl acetate extract,
PE-Petroleum ether extract, Hex-Hexane extract.
Figure 4. Effect of different solvent extracts on antimicrobial activity of
Aspergillus
sp.
Figure 5. Viable cell count studies on butanolic extract of
Aspergillus
sp
Figure 6 (a). TLC showing different bands of butanolic extract of
Aspegillus
sp
www.pharmascholars.com
168
Figure 7. HPLC showing single peak of active band after purification from column
chromatography
Figure 8. UV spectrum of the purified compound.
11 10 9 8 7 6 5 4 3 2 1 0 ppm
-0.0079 0.0000 0.9178 0.9334 0.9392 0.9556 0.9720 0.9903 1.0004 1.0168 1.0463 1.0554 1.2537 1.4917 1.5044 1.5139 1.5282 1.5403 1.5518 1.5642 1.6392 1.6546 1.6640 1.6775 1.6990 1.7157 1.7318 1.7401 1.7445 1.7563 1.7690 1.7854 1.9157 1.9182 2.0346 2.0443 2.0590 2.0699 2.0805 2.1050 2.1251 2.1531 2.1594 2.1635 2.1702 2.1751 2.1870 2.1975 2.3716 2.3876 3.5563 3.5892 3.7108 3.7218 3.7438 3.7547 4.0740 4.0828 4.4990 4.5889 4.5990 4.6093 5.9775 7.2456 7.2539 7.2642 1.79 24.50 0.39 0.45 0.37 4.75 0.88 0.82 1.78 0.44 0.30 4.41 0.28
Current Data Parameters NAME Apr26-2012 EXPNO 22 PROCNO 1 F2 - Acquisition Parameters Date_ 20120427 Time 12.17 INSTRUM spect PROBHD 5 mm PABBO BB-PULPROG zg30 TD 65536 SOLVENT CDCl3 NS 8 DS 2 SWH 12019.230 Hz FIDRES 0.183399 Hz AQ 2.7263477 sec RG 512 DW 41.600 usec DE 6.00 usec TE 295.2 K D1 1.00000000 sec TD0 1 ======== CHANNEL f1 ======== NUC1 1H P1 10.90 usec PL1 -3.00 dB SFO1 400.1324710 MHz F2 - Processing parameters SI 32768 SF 400.1300079 MHz WDW EM SSB 0 LB 0.30 Hz GB 0 PC 1.00
HARPREET-6 BRUKER AVANCE II 400 NMR Spectrometer SAIF
Panjab University Chandigarh
www.pharmascholars.com
169
190 180 170 160 150 140 130 120 110 100 90 80 70 60 50 40 30 20 10 ppm
12.14 21.30 21.44 22.75 22.98 23.26 24.55 24.62 28.09 36.68 37.32 37.67 38.48 38.53 40.12 42.05 45.52 53.44 54.36 56.11 56.19 57.39 59.01 67.77 68.05 68.16 68.34 76.74 77.06 77.37 127.53 128.73 128.89 129.19 129.24 129.92 135.25 135.82 165.25 166.46 169.94 170.56 170.92
Current Data Parameters NAME Apr26-2012 EXPNO 13 PROCNO 1
F2 - Acquisition Parameters Date_ 20120427 Time 13.47 INSTRUM spect PROBHD 5 mm PABBO BB-PULPROG zgpg30 TD 65536 SOLVENT CDCl3 NS 400 DS 4 SWH 24038.461 Hz FIDRES 0.366798 Hz AQ 1.3631988 sec RG 1030 DW 20.800 usec DE 6.00 usec TE 295.9 K D1 2.00000000 sec d11 0.03000000 sec DELTA 1.89999998 sec TD0 1
======== CHANNEL f1 ======== NUC1 13C P1 9.60 usec PL1 -2.00 dB SFO1 100.6228298 MHz
======== CHANNEL f2 ======== CPDPRG2 waltz16 NUC2 1H PCPD2 80.00 usec PL2 -3.00 dB PL12 14.31 dB PL13 18.00 dB SFO2 400.1316005 MHz
F2 - Processing parameters SI 32768 SF 100.6127690 MHz WDW EM SSB 0 LB 1.00 Hz GB 0 PC 1.40
HARPREET-8 BRUKER
AVANCE II 400 NMR Spectrometer SAIF
Panjab University Chandigarh
Figure.10.
13C NMR spectrum of the purified compound
Figure 11. IR spectrum of the purified compound
RC SAIF PU, ChandigarhSpectrum Name: Harpreet GNDU-1.sp Description: S-6
Date Created: fri apr 27 14:56:14 2012 India Standard Time (GMT+5:30)
4000.0 3600 3200 2800 2400 2000 1800 1600 1400 1200 1000 800 600 400.0
www.pharmascholars.com
170
Table 1 Comparison of antimicrobial activity of butanolic extract of
Aspergillus
sp with some
standard antibiotics
a T-30µg-Tetracycline; M-5 µg- Methicillin; K-30 µg-Kenamycin; P-10 µg-Penicillin; Co-25 µg Co-Trimaxazole;
A-10 µg Ampicillin; Imp-10 µg Imipenem; Pt-10 µg Piperacillin/Tazobactam; C- 30 µg Chloramphenicol; G-10 µg Gentamycin; Cfx-30 µg Cefixime
b Organisms: SA (Staphylococcus aureus); SE (Staphylococcus epidermidis); SF(Shigella flexneri); ST1(
Salmonella typhimurium 1); ST2 (Salmonella typhimurium 2); EC (E.coli); KP1( Klebsiella pneumoniae 1); PA
(Pseudomonas aeruginosa); EF( Enetrococcus faecalis); CA (Candida albicans); MRSA( Methicillin resistant
Staphylococcus aureus) c Butanolic extract
Standard antibioticsa
b
c
M Cfx PN K G Co A Imp Pt C TZone of inhibition (mm)
SA 42±0.57 26±1 20±0 28±0.57 25±0.57 25±0.57 21±0 30±0 15±1 31±0 24±0.57 19±1
SE 39±0.57 35±1.5 19±0 32±0.57 22±0.57 16±0.57 19±0.57 20±0 18±0 27±0 20±0.57 17±1
SF 20±1 19±1.5 25±0 - 17±0 20±0 25±0.57 - 24±0 21±0 30±0.57 23±1
ST1 14±0 - 23±0 - 20±0 20±0 21±1 19±0.57 22±0.57 26±0.57 22±0 20±0
ST2 20±1.15 18±0.57 20±0.57 - 25±0.57 27±1 29±1 - 22±0.57 24±0.57 34±0.57 20±0.57
EC 22±0.57 17±0.57 21±0 - 21±0.57 23±1 - - 21±1 20±0.57 34±0.57 13±1
KP 1 46±1 30±1.5 - - 33±1 32±0.57 35±0.57 - 23±1 25±0.57 31±0.57 24±1.5
PA 16±0 - - - - 17±0.57 - - 29±1 17±1.5 - -
EF 27±1 20±1 - - - - 25±0.57 - - 15±1.5 20±0.57 13±0.57
CA 30±0.57 - 18±0.57 - 20±0 18±0.57 - - 16±0 24±1 21±0.57 -
www.pharmascholars.com
171
REFERENCES
1. Fawzy GA, Al –Taweel AM, Melake NA. Columinaris. J Phar Sci Res, 2011; 3(1): 980-87. 2. Gould IM. Int J Antimicrob Agents, 2008; 32(1): S2-S9.
3. Arora DS, Kaur H. Res J Biotech,2011; 6(2): 49-56.
4. Box GEP, Behnken DW. Technomet,1960; 2(4): 455-75.
5. Kaur GJ, Arora DS. BMC Compl Alternative Med, 2009; doi: 1186/1472-6882 9-30. 6. Arora DS, Kaur J. Int J Antimicrob Agents, 1999; 12 (3): 257-62.
7. Maron D, Ames B. Mutat Res, 1983; 113 (3-4):173-215. 8. Arora DS, Chandra P. ISRN Pharmacol, 2011; 2011:1-11.
9. Kanosh AL, Khattab OH, Zainab M, Abd-Elrazek, Motaurea HM. J App Sci Res, 2010; 6 (6):580-88.
10.Miao L, Qian P. Aquat MicrobEcol, 2005;38(3): 231-38.
11.Takahashi J A, Monteiro de Castro MC, Souza GG, Lucas EMF, Bracarense Abreu LM, Marriel IE, Oliveira
MS, Floreano M B, Oliveira T S. J Med Mycol, 2008; 18(4): 198-104.
12.Khaddor M, Saidi R, Aidoun A, Lamarti A, Tantaoui-Elaraki A , Ezziyyani M, Castillo MEC, BadocA. Afr
J Biotechnol, 2007; 6(20): 2314-18.
13 Wang FW, Jiao RH, Cheng AB, Tan SH, Song YC. World J Microbiol Biotechnol, 2007; 23: 79-83.
14.Kobayashi M, Kanasaki R, Ezaki M, Sakamoto K, Takase S, Fujie A, Hino M, Hori Y. J Antibiot, 2004;
57(12):780-87
15.Huang Y, Wang J, Li G, Zheng Z, Su W. FEMS Immunol Med Microbiol, 2001; 31(2): 163-67.
16. Petit P, Lucas EMF, Breu LMA, Flenning LHP, Takahashi JA. Electron J Biotechn, 2009; 12(4):1-9.
17.Arora DS, Chandra P. Braz J Microbiol, 2010; 41(3):765-77.
18. Furtado NAJC, Fonseca MJV, Bastos JK.Braz J Microbiol, 2005; 36(4): 357-62.
19. Mabrouk AM, Kheiralla ZH, Hamed ER, Youssry AA, Abd El Aty AA. Malaysian J Microbiol, 2008; 4(1): 14-24.
20.Rubini MR, Rute TSR, Pomella AW, Cristina S M, Arajo LW, Santo DRD, Azevedo JL. Int J Biol Sci, 2005; 1(1):24-33.
21.Valan Arasu M, Duraipandiyan V, Agastian P , Ignacimuthu S.J Med Mycol, 2008;18(3):147-53.
22. Martin J F, Demain AL. Microbiol. Rev, 1980;44(2): 230-51.
23. Kumar SN, Siji JV, Ramya R, Nambisan B, Mohandas C. J Microbiol Biotechnol Food Sci, 2012; 1(6): 1424-38.
24. Arora DS, Chandra P. Curr Biotechnol, 2012; 1(1): 2-10.
25. Radu S, Kqueen CY. Malays J Med. Sci,2002; 9(2): 23-33.
26. Zhengyan G, Ling S, Zhiqin J, Wenjun W. Int J Mol Sci, 2012; 13(4): 5230–41.
27. Yang SW, Chan TM, Terracciano J, Loebennerg D, Patel M , Gullo V, Chu M. J Antibiot, 2006; 59(3): 190-92.