False Positives Reduction in Top-down Protein
Informatics using Support Vector Machines
Huijuan Guo
Department of Computer Science and Engineering Taiyuan Normal University, Taiyuan, 030012, China
Email: [email protected]
Abstract— The scarce but consistent chance of getting false positive matches [1], [2] in protein database search [3] has always casted a shadow over the reliability of results. The situation can be helped by viewing the protein data from a descriptive and the probabilistic framework, together. Using the conventional approach as the first stage, top down protein data is descriptively searched for proteins and the results are scored and ranked, using a top down protein search engine. We then suggest applying Support Vector Machine, (SVM) as a second stage probabilistic scoring system, to the first stage protein database search results so as to further enhance protein classification. For SVM scoring, features are extracted from the top down data and a feature table is constructed. An SVM using Radial Basis Function is trained with this feature table. Later classification is performed on the test data using this SVM. The classification can then be viewed together with the previously calculated search engine score and a reordering of top ranked proteins may be done.
Index Terms— False positive, protein, SVM
I. INTRODUCTION
The human genome revolution has almost faded into a sea of proteins. The euphoria accompanying the se-quencing of human genome has concluded with a new mission; to understand the gene products i.e. “Proteins”. There is a consensus amongst the genomics and pro-teomics community that to understand the full biological picture, a whole proteome analysis is pertinent [4]. This new direction has brought proteins into the microscopes and mass spectrometers etc. of the leading life-science researchers. Since proteins are a much more diverse and dynamic entity than the genes, a whole range of new tools and techniques is needed. Also, differently from genes, the physical structure of the protein is also of great significance in understanding the system dynamics. Therefore, the proteomics research arena has settled into two major areas, the protein sequence and the protein structure studies; with sporadic attempts of out reaching and overlapping from a few ambitious scientists. This work takes the route of protein sequence sciences.The main issues in this field are protein sequencing and iden-tification of constituent proteins in a sample etc. For that a protein sample is first separated from its environment and charged up. Then it is analyzed for its molecular weight using a mass spectrometer [5], where it can also be fragmented as a result of destabilization caused by shots of high speed electrons onto its molecular surface. The
resultant fragments (peptides) can also be sequenced using their molecular weights [6]. The data output from the mass spectrometer is preprocessed for noise reduction and mono-isotopic peak extraction. The eventual contents of this data include the mono-isotopic molecular weight list of the protein and its fragments. These molecular weights are input into a protein search engine, which descriptively searches (counting the ion matches) for the proteins in the protein databases and scores the matches. The protein with the highest score is predicted to be the protein in question. We take this identification procedure one step further by incorporating SVM classification as a part of a probabilistic framework, which will be fused with the descriptive framework to perform a more accurate prediction on the proteomics molecular weight data. To compare the performance of the two approaches, we use the Matthew’s Correlation Coefficient [7].
This paper is constructed as follows. Background is introduced in section II. Section III mainly discusses our SVM classification methods for this problem. In section IV , we list our experiments and results. Conclusions are section V.
II. BACKGROUND
A. Protein/Fragment Sequence and Molecular Weight
Figure 1. Stage A: A protein is ionized by an electron. Stage B: The protein is sebsequently fragmented by further electron strikes. Stage C: An assortment of ions are generated.
weight and charge state. This unique method of revolution inside a mass spectrometer can be used to measure its molecular weight. After this measurement, the protein may again be shot-at using the techniques mentioned above. However, this time, a charged protein breaks down into its constituents vis-a-viz A, B, C, X, Y and Z ions [10], [11]. The molecular weights of these product ions can also be measured in turn by using their ionization state and velocity. This process is illustrated by Figure 1.
B. The Role of Protein Search Engine
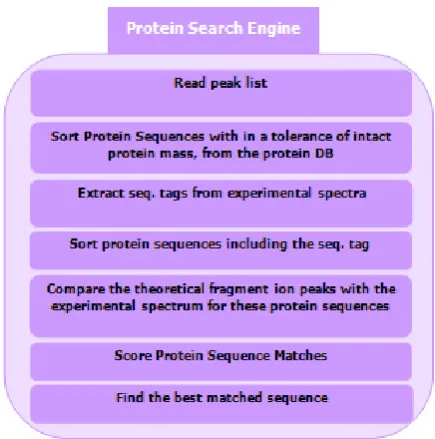
The molecular weights of various ions types measured by a mass spectrometer are supplied to a protein search engine. Such softwares search the protein databases pro-vided by European Bioinformatics Institute [12] and rank the proteins for their matches. The proceedings inside a protein search engine are summarized in Figure 2. However, as a result of this process there is a chance that two closely related or similarly constituted proteins can end up having an equal rank or worse yet, a false positive may be reported.
C. The Scoring and Ranking Systems
There are numerous scoring and ranking systems for such a problem. Already, such systems use information like intensity, ions types, sequence tags, matching ratios, complementary ions and so on. However, there has been no perfect solution for classifying the proteins. A different point of view can be offered by a composite method containing a search engine and machine learning methods e.g. ”The Support Vector Machine”. Such a proposed pipeline is shown in Figure 3.
III. METHODS
A. Framework of proposed algorithm
As the initial step, a ranked list of proteins is taken from a protein search engine. The effect of the search
Figure 2. The process of matching ions with protein in a protein database
Figure 3. The pipeline of the algorithm
engine can be represented by the equation:
RS= (
Nmatch∑
i=1
)×Nmatch/Lpep (1)
where Nmatch is the number of the predicted fragment ions matching the peaks in the experimental spectrum, Ii is the intensity value of the ith matched peak and
Lpep is the peptide length. In the second step, an SVM-based classification (or scoring) function gives a signed decision value according to the features constructed from the matching matrix (see section 3.2).
B. Matching Matrix and Training Data
As a first step, a matching matrix between a peptide and a spectrum is constructed.
Definition 1: Let A , B as Protein A and Protein B’s feature information matrix. Then a boolean matching matrix for each Protein can be obtained by normalization. Formally, the matching matrix(DM) between Protein A and Protein B is defined as follows,
IonT ype 1 2 · · · max{n, r}
a 1 0 · · · 0
b 1 1 · · · −1
· · · · · · · · · ·
y 1 −1 · · · −1
m×max{n,r}
In (DM), matrices A and B are defined as follows:
A= (aij)=
P roteinA 1 2 · · · n
a pa1 pa2 · · · pan
b pb1 pb2 · · · pbn · · · · · · ·
y py1 py2 · · · pyn
m×n
B=(bij)=
P roteinB 1 2 · · · r
a pba1 pba2 · · · pbar
b pbb1 pbb2 · · · pbbr · · · · · · ·
y pby1 pby2 · · · pbyr
m×r
Note 1: • Ifr > n or r < n, here, we should add necessary zero padding into A or B.
• Ifdi.= 0, then theithrow should be removed from the matrix DM
• If d.j = 0, then the jth column should be removed from the matrix DM
The matching matrix is anm×max{n, r}array, wherem
denotes the number of different ion types under consid-eration,max{n, r}is the length of a peptide, the column indexes(1,2,· · ·, max{n, r})represent the cleavage sites of a peptide, the row indexes(a, b,· · ·, y)denote various ion types and the element pmax{n,r}(t ∈ {a, b,· · ·, y}) holds the information of the corresponding matched peak, or keeps null.
Up to now, we have converted the multidimensional feature matrix into the 2 dimension feature which is suitable for SVM training according to the matrix DM.
X ={(a11, b11),(a12, b12),· · ·,(aij, bij),(a11, b11)}
Y ={d11, d12,· · ·, dij, dm,max{n,r}}
(i= 1,2,· · ·, m),(j= 1,2,· · ·, max{n, r})
C. Support Vector Machines
Support vector machines are developed by Vapnik and his coworkers based on the statistical learning theory. The principle of structural risk minimization establishes the basis of the good generalization performance of SVMs. For a binary classification problem, the input to the SVM training algorithm is a set of nsamples denoted as
D={(X1, y1),(X2, y2),· · ·,(Xn, yn)} (2)
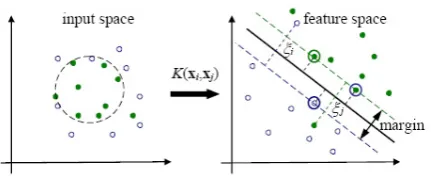
whereXi∈Rd is the ithsample and yi ∈ {−1,1} is its class label. The objective of SVMs is to find an optimal separating hyperplane that maximizes the margin between two classes in a high dimensional feature space into which the input vectors are mapped by a kernel function, as shown in Figure 5. The kernel function implicitly calculates a dot product in the feature space with all necessary computations performed in the input space. One advantage of it is that it can get linearly non-separable
Figure 4. A linear separating hyperplane (the solid line in the right coordinates) in the feature space corresponding to a non-linear boundary (the dashed line in the left coordinates) in the input space. The data points in circles are support vectors (SVs).
samples in the input space to be linearly separable in the feature space.
The decision function of the SVM classifier is
f(x) = ∑
i∈SV s
yiαiK(X, Xi) +b (3)
where the coefficientsαiare solved in the interval[0,C] by a convex quadratic programming. C is a tradeoff between maximizing the margin and minimizing the em-pirical risks and can be specified for positive and negative samples respectively in the case of unbalanced datasets. The radial basis function(RBF) kernel K(Xi, Xj) =
exp(−∥Xi −Xj∥) is popular for practical use due to its approximate behaviors to other kernels under certain conditions and the less number of parameters to be tuned.
D. Performance Measurement
The performance of typical protein classification al-gorithms is measured by using Mathew’s Correlation Coefficient. Let tp, f p, tn andf n denote the number of true positives, false positives, true negatives and false neg-atives respectively. The Matthews correlation coefficient (MCC)uses these four values to measure the performance of algorithm:
M CC= √ (tp×tn)−(f p×f n)
(tp+f p)×(f p+tn)×(tn+f n)×(f n+tp)
(4) The MCC maps the comparison ranks in the interval [-1,1], with 1 indicating completely correct classification, -1 indicating completely incorrect classification and 0 indicating no correlations between predictions and the true class labels. The most important property of MCC is that it is superior to the typical ”search accuracy” which is defined as the proportion of correctly classified proteins, especially when datasets are unrelated, because the accu-racy is dominated by the majority class and thus can be misleading. Therefore the MCC is usually employed in the cross-validation training process of SVMs.
Sensitivity (SEN = tp/(tp + f n)) and precision
IV. EXPERIMENTS
A. Datasets
The Fourier Transform-Ion Cyclotron [13]–[16] M-S/MS [17] spectra was used for determining the data modelling parameters for our experiment’s spectrum data. Using the estimated quality parameters, spectra were then generated using an in-house digester ”Theoretical Spectrum Generator.exe”. These in-silico spectra were then divided into two datasets, A and B, according to the different concentration of two mixtures of 16200 puri-fied proteins with known sequences.All the spectra were searched using SLIM search engine against a database combining the human proteins with the 16200 protein-s; then the peptide identification results were validated manually. Consequently, there are about 9000 spectra identified correctly with their peptide terminus consistent with the in silico spectra. Out of 7200 (16200 - 9000) miclassified proteins, we extracted 5 random datasets. One such dataset is also attached with this paper. This data was then used in training the SVM and a comparison was made for performance with a UNIPROT [18]protein. An abridged version of this database is also provided as an attachment.
B. Background Noise Reduction and Intensity Normaliza-tion
In the selected data, we reduced the noise and eliminat-ed the diversities of total ion currents of different spectra. Along with noise reduction, intensity normalization was also performed. All the peaks lower than 10 percent in-tensity of the highest peak are removed and the intensities of the remaining peaks were normalized using:
IN i= 100× √
IOi ∑
jIOj
(5)
where IN i is the normalized intensity and IOi is the original intensity.
C. Protein Database and Search Parameters
The protein database searched by SLIM protein search engine is the full UNIPROT protein database. The search parameters used in our algorithm and SLIM is: maximum number of Modifications: 0; tolerance of fragment ions: 0.2 Da; tolerance of precursor: 100 Da; ion types: b, b+ +, b0, y, y+ +, y0; and no enzyme. For SVM, we have used an abridged database. This is so because we just need to correctly classify a spectra in a small number of proteins which were reported as candidates in the SLIM search engine results, for that protein.
D. Feature Selection
From a set of 19 short listed features, the best 6 features are extracted from each match between a spectrum and its corresponding candidate peptides. These best 6 features are selected by calculating the information gain ratio on through cross validation, as listed in Table 1. The full
FEATURES GAIN RATIO C−ion 0.012±0.001 Z−ion 0.018±0.006 A−ion 0.031±0.004 X−ion 0.025±0.003 B−ion 0.056±0.001 Y −ion 0.085±0.014
TABLE I.
THE TOP6FEATURES SELECTED BY INFORMATION GAIN RATIO
Our Algorithm SLIM
Classification Rank Classification Rank Inseparable 0 Incorrect 2
Correct 1 Incorrect 2
Incorrect 2 Incorrect 3 Incorrect 2 Incorrect 2 Inseparable 0 Incorrect 2
TABLE II. RESULTSANALYSIS
Note 2: We found out that there is a chance that the proteins are homologs of each other. Such proteins have different IDs in the database but their sequence is the same. Usually these proteins are only different in their 3-D structure. Therefore the SLIM search engine cannot distinguish between the two proteins. Our SVM abstraction also has the same shortfall, as it is also solely relying on the sequence information. We have found out that there is a group in Bio & Brain Engineering Department which is working on protein structure classification using SVM. We plan to ask for collaboration, and if we are successful, it will help us publish internationally.
list of 19 features and their information gain values are provided with this paper.
These 6 feature values are then scaled into the interval [0,1].
E. Results
V. CONCLUSIONS
We propose an idea to use SVM in tandem with protein search engines in order to reduce the false positive classifications. We used a large dataset from SLIM search engine and extracted the false matches, and later used this extracted data for training SVM. Before that, we also analyzed the large dataset for preparing a possible feature list, calculating their information gain and then selecting a sub set, which was subsequently used in filtering data and testing with SVM.
Our preliminary results show that SVM has a small yet certain effect on classification. Till now, we could not ascertain however, which size of feature table, out of a maximum of 19, would be the best suited for the best ”general” case. An initial investigation was done involving this question, by manually curating protein data. Due to the lack of sufficiently varying (in terms of features) data and the unexpectedly tedious nature of ion extraction, rigorous testing could not performed so as to evaluate a robust benchmark coefficient e.g Matthew’s Correlation Coefficient. However, we could see roughly a 1 in 10 false positive data showed correct classification by LIBSVM.
ACKNOWLEDGMENT
We thank Safee Ullah Chaudhary and Fei Hao for numerous discussions concerning this work, and the re-viewers for their detailed comments.
REFERENCES
[1] J. C. Benjamin, L. B. Jonathan, and L. S. James, “Potential for False Positive Identifications from Large Databases through Tandem Mass Spectrometry”,Journal of Proteome Research, 3(5), pp 1082-1085, 2004.
[2] J. Zhang, J. Li, H. Xie, Y. Zhu, F. He, “A new strategy to filter out false positive identifications of peptides in SEQUEST database search”, Proteomics, Nov 7 (22):40, pp.36-44, 2007.
[3] A typical Protein Database search engine, http://proteindbs.rnet.missouri.edu/ results Proteomics ISSN 1615-9853, vol. 7, no22, pp.4036-4044, 2007. [4] A human proteome project with a beginning and an end,
Ian Humphery-Smith.
[5] C. G. Ida, K. Oliver, “Application of Mass Spectrometry in Proteomics”,Bioscience Report, 25, pp.1-2,2005.
[6] O. D. Sparkman, “Mass spectrometry desk reference”, Pitts-burgh: Global View, 2000.
[7] B. W. Matthews, “Comparison of the predicted and observed secondary structure of T4 phage lysozyme”,Biochim. Bio-phys. Acta., 405, pp.442-451, 1975
[8] Introduction to Proteins,
www.childrenshospital.org/cfapps/research/data admin /Site602/mainpageS602P1.html
[9] R. A. Zubarev, N. L. Kelleher, and F. W. McLafferty, “Electron Capture Dissociation of Multiply Charged Protein Cations - a Nonergodic Process” J. Am. Chem. Soc. 120, pp.3265-3266, 1998.
[10] K. Breuker, H. B. Oh, B. A. Cerda, D. M. Horn, F. W. McLafferty, “Hydrogen atom loss in electron-capture dissociation: a Fourier transform-ion cyclotron resonance study with single isotopomeric ubiquitin ions”, Euro. J. Mass Spect, 8, pp.177-180, 2002.
[11] F. W. McLafferty, D. M. Horn, K. Breuker, Y. Ge, M. A. Lewis, B. Cerda, R. A. Zubarev, and B. K. Carpenter, “Electron capture dissociation of gaseous multiply charged ions by fourier-transform ion cyclotron resonance”,J. Am. Soc. Mass Spectom., 12, pp.245-249, 2001.
[12] European Bioinformatics Institute, http://www.ebi.ac.uk/ [13] D. P.Little, J. P. Speir, P. B. OConnor, F. W.
McLaf-ferty, “Infrared multiphoton dissociation of large multiply charged ions for biomolecule sequencing”,Anal. Chem., 66, pp.2809-2815, 1994.
[14] E.Mortz, P. B. OConnor, P.Roepstorff, N. L.Kelleher, T. D. Wood, F. W. McLafferty, M. Mann, “Sequence tag identification of intact proteins by matching tandem mass spectral data against sequence data bases”,Proc. Natl. Acad. Sci., USA 93, pp.8264- 8267, 1996.
[15] S. A. McLuckey, J. L. Jr. Stephenson, “Ion/ion chemistry of high-mass multiply charged ions”,Mass Spectrom. Rev.
, 17, pp.369-407, 1998.
[16] G. Mitulovic, K. Mechtler, “HPLC techniques for pro-teomics analysis-a short overview of latest developments”,
Brief Funct. Genomic Proteomic, 5(4), pp.249-60, 2006. [17] D. F. Hunt, J. R. Yates, J. Shabanowitz, S. Winston, C. H.
Hauer, “Protein sequencing by tandem mass spectrometry”,
Proc. Nat. Acad. Sci.,USA 83, pp.6233-6237, 1986. [18] Uniprot database, http://www.uniprot.org/