Implementation of Lean Manufacturing Tools for
Improving Productivity: A Case Study
Brijbhushan Onkar Singh Bhatia
PG Student Associate Professor
Department of Mechanical Engineering Department of Mechanical Engineering Green Hills Engineering College Green Hills Engineering College
Vikas Ucharia Assistant Professor
Department of Mechanical Engineering Green Hills Engineering College
Abstract
Present research focuses on the quality improvement at Himachal Pradesh based manufacturing unit a precision machining company for two and three wheeler components. The objective of present research focuses on current Quality Management System (QMS) implemented and to identify the current quality problems that the company faces and to study. Present research is divided into two parts Ethnographic and Qualitative research design. Recommendations and solutions to the problem faced will be suggested to the heads and supervisors, to improve the current quality system, as well as increase efficiency and reduce non conformities. This research only focuses on problem faced in the production section of the company. In the ethnographic part study is focused on plunging of workers and qualitative part research is focused on various causes of rejection. Lean manufacturing tools is considered as the pilot project to solve the problem. Various tools were used such as Multiple activity charts, Pareto chart, PDCA cycles, cause and effect diagram and control chart. With the help of lean tools, plunging of workers come to zero, better working environment is provided to workers, rejection has reduced o 12000ppm from 29000ppm and reduced the loss of organization from 4.02% to 2.79%. Retention of worker saves the training cost. Tool life also increased. Keywords: Ethnographic, Lean Tools, Pareto, PDCA, Qualitative Research
_______________________________________________________________________________________________________
I.
I
NTRODUCTIONDynamic and technological world requires organization to be competitive and pioneer with its products or services. Companies are forced to rethink their manufacturing and management approaches to lower costs, waste reduction, improve productivity and at the same time increase quality. It is true that the number of tools, techniques and technologies are available to improve operational performance is growing fast and 5s is also among the pilot tools of industrial engineering to remain competitive in business. 5s requires less effort, capital, and time to make quality products with less number of defects. It is a lean system to manage and manufacture products. Fields et al. recommended that 5S training be imparted to the management, supervisors, and workers and a change management team be formed which can help to bring the necessary change.
The 5S system is a lean system used for organizing and managing manufacturing operations so that they require less human effort, space, capital, and time to make products with fewer defects.
All these benefits result in greater productivity, better quality, less cost, workplace safety, and high morale. 5Ss lays the foundation for the company’s overall lean production system, and lack of a robust 5S system will make other lean tools ineffective. Implementing 5Ss alone may not bring the desired results, unless it is followed by educating the target work group on the corporate objective and soliciting its support and participation.
Worker teams who participate in a Lean Manufacturing project are trained in the use of statistical and problem solving tools as well as project management techniques to define, measure, analyze, and make improvement in the operation of organization by eliminating defects and variability in its processes. The main concept of lean manufacturing is that defects in a given process can be measured and quantified.
Aim is to investigate the possible causes of rejection and non-conformities. On the basis of various graphs of trends study is divided into two parts
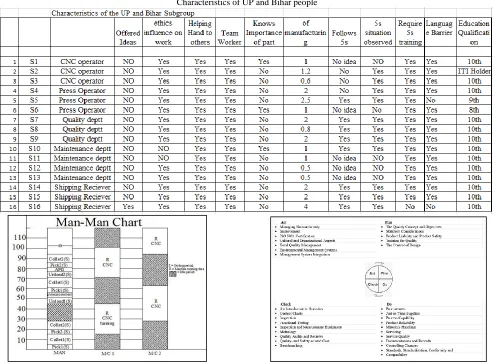
Ethnographic Research is focused on the worker class. The aim of ethnography is to understand, another way of life from the native point of view” (Spradley, 1980, p. 3). The most important component of ethnography concerns the meaning of actions and events of the people we are trying to understand. This ethnographic study was conducted over a period of six months. It helps in describing how the Indian Sub-Continent group works, and it explores their beliefs, behaviors, and cultural norms.
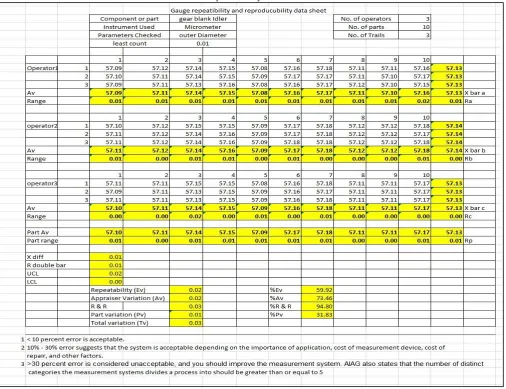
Qualitative research is a research design utilized and concentrated on rejection of gear blank of kick Idler of two wheelers (Bajaj). After forging, CNC turning is the pilot operation using CCGT insert (tool tip) with FANUC control CNC machine. Measurement is done with the help of special design gauges, plug gauge and air pressure plug gauge (APG). Tool life is also decided by occurrence of rejection or change after 2200 parts, which is actually for meant for 1500 parts. Air pressure is set between the ranges of 30-50 bars without any fixed value.
Table – 2
Fig. 3: Cause & Effect Diagram Fig. 4: Pareto chart for rejection
The fishbone diagram is a tool for analyzing the business process and its effectiveness, which shows the possible causes of a specificevent or a problemas shown in Fig. 3.
Fig. 4 shows the Pareto analysis for the various parameters of gear blank idler, which were responsible for the rejections. Various parameters were along x-axis and no. of rejections is along y-axis. Rejection for outer diameter is maximum, which is 66% of total.
For presenting these simple statistics related to process median 160 specimen of said component are measured for outer diameter. 20 pieces are measured in the interval of one hour in a single shift.
Table – 3
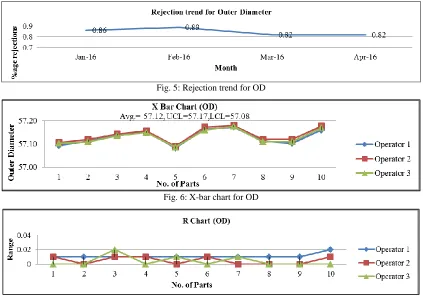
Fig. 5: Rejection trend for OD
Fig. 6: X-bar chart for OD
Fig. 7: Range chart for OD
Results of control charts for OD are same, as shown in Fig. 6 and Fig. 7. This concludes that to achieve repeatability, training and sustainability are must.
Daily Availability Calculation
Availability takes into account down time loss.
Firstly, daily average availability has been calculated for the existing machine in the floor. Actual capacity time for 8 hours shift = 480 min.
Total downtime (sum of loss time) = 110 min.
Planned downtime = Total downtime – (breakdown time + set up) = 110 - 60 = 50 min.
Planned run time = 420 min.
Operating time = Planned run time – Planned downtime = 420 - 160 = 260 min.
Therefore, Availability = Operating time *100% Planned run time = 260 *100% = 61.90% 420
Performance Rate
The performance only concerns the gross operating time. A property of the gross operating time is that the speed exceeds zero at any time. There are no down time losses in the gross operational time. The performance factor is a measure for the speed losses. Performance Rate = Planned run time – Planned Down time *100%
Planned run time
= 420-50 *100% = 88.09% 420
Quality Rate
During the net operational time, no down time or speed losses occur. It is not certain that the total produced output is conform quality specifications. To gain insight into this, the quality factor is defined:
=971000 *100% = 97.1% 1000000
Rate of expected OEE = availability (100 %) * performance rate * quality rate = 61.90 * .88 * .971 = 52.89
When compared with world class standards, the values of OEE are far below it.
Operator Issues
All operators’s related issues were taken to Worker Union and after their consent it was decided to take strict action against the negligence.
For new operator coming in area, training sessions & supervision by skilled operators was made compulsory. Warning letters were issued for negligence from operators.
New & updated work instructions were put on machine boards.
Head were requested to provide tea breaks, sanitary facilities, water facilities and fans for better efficiency. Table - 4
Total major cost for manufacturing
Total Major cost for 36000 parts = Rs.1, 38,600
Minor Cost: - It comprises of Holding Cost, Carrying Cost, Setup Cost, Material Cost, Light Cost, etc. Minor Cost =Total processing cost – major cost = 4 - 3.85 = 15paisa
Total processed cost of 35000 parts =35000×4 = Rs. 1, 40,000 %age loss to company = (140000/347533) × 100 = 4.02%
Table – 5
Total major cost after new practices (lean tools)
Total Major cost for 12000 parts = Rs 1,39,920
Total processed cost of 12000 parts =12000×12 = Rs 1,44,000 %age loss to company = (1,44,000/1,16,60,000) × 100 = 1.23%
ACKNOWLEDGMENT
I pay my sincere thanks to my guide Mr. Onkar Singh Bhatia, for helping and providing needful guidance in my research work. I express my thanks to my Institution Green Hills Engineering College, Solan, HP for providing me with a good motivation, environment and facilities like Internet, books, computers and all that as my source to complete this research work.
REFERENCES
[1] Agrahari, R.S. Dangle, P.A. and Chandratre, K.V, “Implementation of 5S methodology in The Small Scale Industry: A Case Study”, International Journal of Scientific & Technology Research, Vol. 4, Iss.4, 2015.
[2] Aomar, R.A, “Analysis of Lean Construction practices at Abu Dhabi construction industry”, Lean Construction Journal, pp. 105-121, 2012.
[3] Arunagiri, P. and Gnanavelbabu, A, “Identification of High Impact Lean Production Tools in Automobile Industries Using Weighted Average Method”, Elsevier, 2014.
[4] Baghban, A.A. Younespour, S. Jambarsang, S. Yousefi, M. Zayeri, F. and Jalilian, F.A, “How to test normality distribution for a variable: a real example and a simulation study”, Journal of Paramedical Science, Vol.4, No.1, 2013.
[5] Chakrabortty, R.K. Biswas, T.K. and Ahmed, I, “Reducing process variability by using DMAIC Model: A Case study in BANGLADESH”, International Journal for Quality Research 7(1) 127-140, 2013.
[6] Chandra, P.V, “Approach to Lean Leadership through Creating a Lean Culture”, International Journal of Engineering Science and Innovative Technology, Vol. 2, Iss.4, 2013.
[7] Chitre, A. R, “Implementing 5S Methodology for Lab Management in the Quality Assurance Lab of a Flexible Packaging Converter”, American Psychological Association, 6th edition, 2010.
[8] Chowdury, M. L. R. and Hoque, M.A, “Evaluation of Total Productive Maintenance Implementation in a Selected Semi-Automated Manufacturing Industry”, International Journal of Modern Engineering Research, Vol. 4, Iss.8, 2014.
[9] Deshpande, S.P. Damle, V.V. Patel, M. L. And Kholamkar, A. B, “Implementation of 5s Technique in a Manufacturing Organization: A Case Study”, International Journal of Research in Engineering and Technology, Vol. 04, Iss.01, 2015.
[10] Dighe, S.B. and Kakirde, A, “Lean Manufacturing Implementation Using Value Stream Mapping: A Case Study of Pumps Manufacturing Company”, International Journal of Science and Research, Vol. 3 Iss.6, 2014.
[11] Falkowski, P. And Kitowski, P, “The 5S Methodology as a Tool for Improving Organization of Production”, PhD Interdisciplinary Journal, vol.4, pp.127-133, 2013.
[12] Ghodrati, A. and Zulkifli, N, “The Impact of 5S Implementation on Industrial Organizations’ Performance” International Journal of Business and Management Invention, Vol.2, Iss.3, pp.43-49, 2013.
[13] Gupta, N, “A Study of Employee Retention with Special Reference to Indian Tourism Industry”, European Academic Research, Vol. I, Iss.6, 2013. [14] Hassan, M.K , “Applying Lean Six Sigma for Waste Reduction in a Manufacturing Environment”, American Journal of Industrial Engineering, Vol. 1, No.
2, pp. 28-35, 2013.
[15] Hossain, M, “A Study to Reduce the Lead Time of a Bakery Factory by Using Lean Tools: A Case Study”, International Journal of Scientific and Research Publications, Vol. 5, Iss.11, 2015.
[16] Jagtap, N.S. Ugale, V.D. Kadam, M.M. Kamble, S.S. and Salve, A.V , “Setup Time Reduction of Machine Using SMED Techniques and Lean Manufacturing”, Vol. 1, Iss.2, 2015.
[17] Joshi, R.R. Patil, R. Naik, G.R. and Kharade, M.V. “Through-Put Time Reduction by Lean Manufacturing”, IOSR Journal of Mechanical and Civil Engineering, ISSN: 2278-1684, pp. 40-45.
[18] Juhari, N. H. B. Abidin, N. and Omar, M. W, “Factors influencing employees’ motivation in implementing 5s system”, Elixir International Journal, Vol. 39, pp 4836- 4847, 2011.
[19] Kariuki, B.M, “Role of Lean Manufacturing on Organization Competitiveness”, Vol.3, No.10, 2013.
[20] Koripadu, M. and Subbaiah, K.V , “Problem Solving Management Using Six Sigma Tools & Techniques, International Journal of Scientific & Technology Research, Vol. 3, Iss.2, 2014.
[21] Kovacs, G , “Productivity improvement by Lean Manufacturing Philosophy”, Vol. 6.No. 1, pp. 9-16, 2012.
[22] Lingareddy, H. Reddy, G.S. and Jagadeshwar, K, “5s as a Tool and Strategy for Improvising the Work Place”, International Journal of Advanced Engineering Technology,Vol. 4, Iss.2, pp 28-30, 2013.
[23] Mahale, R. and Gaitonde, V.N, “Implementing the concept of paint before assembly to the typical assembly line”, International Journal of Innovative Research in Advanced Engineering, Vol. 1 Iss.9, 2014.
[24] Mayatra, M. Chauhan, N.D. and Trivedi, P. “A literature review on implementation of Lean Manufacturing Techniques”, International Journal of Advance Research, Ideas and Innovations in Technology, Vol. 1, Iss.4.