ISSN (e): 2250-3021, ISSN (p): 2278-8719
Vol. 09, Issue 6 (June. 2019), ||S (II) || PP 07-12
Economic Acceptance Sampling Plan Based on Truncated Life
Tests for Generalized Exponential Distribution
Sandeep Kumar
Department of Statistics, Hindu College, University of Delhi, Delhi-110007, India
Corresponding Author:Sandeep Kumar
Abstract: -
In this paper, an economic acceptance sampling plan has been developed for the truncated life time distribution. Here, it is assumed that the quality of a product cannot be treated as constant so it vary with the time and denoted as random variable. This random variable (or quality) follows a life time distribution known as generalized exponential distribution. We are keen interested in the average life (or median life) of the product to obtain the ratio of true average life and specified average life (σ/σ0) with a predetermined time (t).The optimalcost model has been introduced to analyses SASP to find the various values of TC based on ATI. The purpose of this study is to find various measures for the given ratio (t/σ0) so that we may obtain a best suitable (n, c, t) plan.
The OC values and AOQ, ATI, and TC values are presented through table 1 & 2. Some of the results has been discussed to explain table values.
Keywords:
- Average Total Inspection, Generalized Exponential Distribution, Operating Characteristic, Producer’s Risk, Total Cost, Truncated Life Test.--- --- Date of Submission: 02-06-2019 Date of acceptance: 17-06-2019 --- ---
I.
INTRODUCTION
Single acceptance sampling plan is an easy and important field of statistical quality control. It was discovered during second world war and later introduce by Dodge and Romig in the field of statistical quality control. Sometimes, we are bound to use sampling techniques rather than complete enumeration like testing of bullets, bombs, crackers, blood tests etc. Dodge emphasized that a sample should be collect randomly from the lot on the basis of sample information, we must take a decision regarding disposition of lot, whether to accept or reject. So, acceptance sampling plan lies between complete enumeration and no inspection at all. Survival of any product is based on its quality. The quality of the product can be achieved through statistical quality control. Acceptance sampling plan is an important tool to maintain the quality in product control methods. Quality is a variable characteristic and cannot be treated as constant. So the quality may be treated as random variable when it does so, life of the product is also a random variable. When the life testing follows any life time distribution, we measure the average life of the product, this testing has two stages one is time (t) and another is acceptance number (c). The life testing experiment will be truncated if the numbers of failures is in increased than the specified numbers of failures before the specified experiment time or no failure is recorded before time. The formulation of acceptance sampling plan is based on parametric model for life time distribution such that (n, c, t) and other parameter say σ0, where σ0 is the specified average (mean/median) life of the distribution and it behaves like quality parameter for the lifetime distribution under certain assumptions.It was first discussed by Epstein, B.(1954) truncated life tests for exponential distribution. Acceptance sampling plan for gamma, normal, log-normal distributions were discussed and provide tables by Gupta, S.S. and Groll, P.A.(1961) and Gupta, S.S.(1962). Important discussion is provided by Goode, H.P. and Kao, J.H.K.(1961) on sampling plans based on the weibull distribution. Later, Gupta, R.D. and Kundu, D.(1999) & (2007) and Balakrishnan, N., Leiva,V., and Lopez,J.(2007) truncated life tests based on generalized exponential distribution and generalized Birnbaum- Saunders distribution respectively. On the basis of these studies, it is observed that more effective life time distribution is generalized exponential distribution respectively. In many cases median is a suitable parameter to take as average life rather than mean. Generalized exponential is one of the case, where mean is not an appropriate parameter it is suggested by Gupta, S.S.(1962) that median provides better result instead of mean. It is observed that generalized exponential is a skewed distribution so it is more suitable to take median as the quality parameter.
P = Shape parameter σ = Scale parameter α = Producer’s risk β = Consumer’s risk p = Failure Probability
L (p) = Probability of acceptance P* = Minimum probability σo = Specified life
Tc = Total cost Ci = Inspection cost
Cf = Internal failure cost
Co = Cost of an outgoing defective
Dd = Defective items defected
Dn = Defective items not defected
ATI = Average total inspection
1.3 GENERALIZED EXPONENTIAL DISTRIBUTION
The single acceptance sampling plan is very popular among the industry engineers due to its simplicity. A vast literature is available about the application of acceptance sampling plans in manufacturing the industry. Aslam, M. and Shabaz, M. Q. (2007) have studied economic reliability test plans using the generalized exponential distributions. Epstein, B. (1954) has studied truncated life tests in the exponential case. Gupta, R. D. and Kundu, D. (2003) have studied closeness between the gamma and generalized exponential distributions. Gupta, R.D. and Kundu, D. (2004) again studied discriminating between gamma and the generalized exponential distributions.
Ramaswamy, A.R. et al. (2012) proposed an extension of acceptance sampling plan based on generalized exponential distribution. A random variable T is said to have a generalized exponential distribution with parameters γ and σ, if its probability density function (pdf) is given by:
f T (t) =
e– t / σ (1 – e– t / σ) γ–1 ………(1)
t > 0 , γ > 0 , σ ≥ 0
The corresponding cumulative density function (CDF) of the generalize exponential distribution is given by F (t, σ) = (1 – e– t / α)γ ………..(2)
Where σ is a scale parameter and γ is shape parameter. The shape parameter is known because if shape parameter is unknown then it is not easy to design an acceptance sampling plan. The scale parameter is characteristic parameter (or quality parameter).
In the present study is assumed that the probability distribution of a lifetime random variable is generalized experimental distribution with known shape parameters. The problem considered that of finding the minimum cost necessary to assure a certain average life when the life test is terminated at preassigned time (t) and when the observed number of failures does not exceed a given acceptance number.
For the protection of the consumer specification, average life of the product to test with a preassigned high probability. The acceptance of the lot is depends at the end of time t if the number of failure items does not exceed the given acceptance number c. The life test is terminated at the end of time t or (c + 1)th failure is observed whichever is earlier .
II.
DESIGNED OF THE PROPOSED PLAN
It is known that single acceptance sampling plan is easy to understand and conventional plan. Most popular practice in life testing is to terminate a life test by a predetermined time (t) and observe the number of failure items. The decision is to establish with the specified mean life occurs with a given minimum probability p*. To accept the lot if the average life of sample items reach to the given time (t) and number of failure items does not exceeds the acceptance number (c) . But test may be terminate before time (t) if the number of failure items exceed the acceptance number.
We proposed a following SASP based on a truncated life test: (1) Draw the sample size of (n) and put them on test.
(2) Accept the lot if there are no more than c failures i.e. (r ≤ c) (3) Maximum duration time t.
(4) A ratio o
t
We fix the consumer’s risk the probability of accepting a bad lot not to exceed 1 – p*. For a fixed p* our sampling plan (n, c, t / σ0) is characterize there, we considered a large size lot. To ensure that σ > σ0 must
satisfy.
L (p) =
c
i 0
ni pi (1 – p)
n – i ≤ 1 – p* ……….(3)
Where p* (0, 1) and p = F (t, σ0) is a monotonically increasing function of
o
t
and known as theprobability of a failure observed during the time t.
If the number of failure items with in the time t is at most c , then from the above inequality with the confirmation of probability p* that F(t , σ) ≤ F(t , σ0) which implies σ0 ≤ σ .
The minimum samples sizes that may satisfy above inequality for
t / σ0 = 0.628 , 0.942 , 1.257 , 1.571 , 2.356 , 3.141 , 3.927 , 4.712 with probability
p* = 0.75 , 0.90 , 0.95 , 0.99
The values of
o
t
and p* are taken in this work same as the corresponding values of Baklizi & E.I. Masri (2004) for Birnbaum Saunders models, Kantam et al . (2001) for log logistic model and Gupta & Groll (1961) for gamma distribution.The ratio
o
of the true average life σ to the specified life σ0 is called the quality level of a product. Both
the risks are associated with SASP. If a product is accepted as good item on sample basis information, it is a right decision.
To test, the Null hypothesis H0: μ < μ0
Alternative hypothesis H1: μ < μ0
Both producer and consumer desires protection forward quality of a product as well as the decision of rejection and acceptance of the lot.
Pa (p1) = P (X ≤ c / n, p1) = 1 – α
Pa (p2) = P (X ≤ c / n, p2) = β
or
Pa (p1) = L (p / σ / σ0 = r1) ≥ 1 – α ………..(4)
Pa (p2) = L (p / σ / σ0 = r2) ≤ β ………..(5)
Larger mean life ratio represents the higher quality of the product. Generally r2 =1 is adopted. p1 and p2 are
failure probabilities of the producer’s and consumer’s respectively. .
Pa (p1) =
c
i 0
ni
i
p
1 (1 – p1)n–i ………(6)Pa (p2) =
c
i 0
ni
i
p
2 (1 – p2)n–i ………....(7)III.
OPERATING CHARECTERSTIC FUNCTION OF SAMPLING PLAN
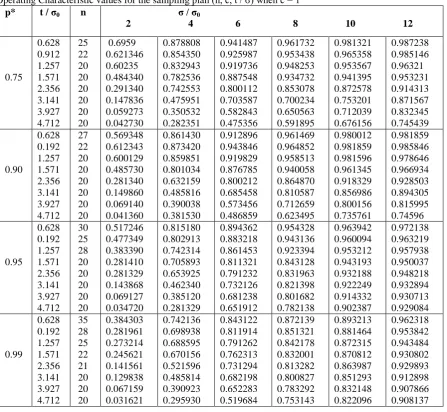
The probability of accepting a lot may be attained through operating characteristics of the sampling plan (n, c, t /σ0). We found that operating characteristic function is an increasing function of σ. We can find the
desired value of OC function from the table 1.
Probability of acceptance for sample first using r = 2 for the generalized exponential distribution that is placed in table 1. Let us assume the average life is at least 1000 hours with confidence 0.95. Let the acceptance number c = 1 with sample size n = 20.
IV.
4. ATI BASED TOTAL COST MODEL
Average Outgoing Quality (AOQ) =
N
n
N
p
pP
a(
)(
)
……….(8)
Average Total Inspection (ATI) = n + [1 – Pa (p)] (N – n) ………..(9) An economic sampling plan for total cost is as follows:
Min. Tc = Ci ATI + Cf Dd + Co. Dn ……….(10)
Subject to 1 – Pa (AQL) ≤ α
Pa (LTPD) ≤ β
Where Dd = n p + [1 – Pa (p)] (N – n) p
Dn = Pa (p) (N – n) p
Dd denote the defective items detected and Dn defective items not defected respectively.
The following are the various costs involved in the model: Ci = Inspection cost Cf = Failure cost before sale Co = Failure cost post sale
V.
TABLES
TABLE 1
Operating Characteristic values for the sampling plan (n, c, t / σ) when c = 1 p* t / σ0 n σ / σ0
2 4 6 8 10 12
TABLE 2
OC, AOQ, ATI and Total Cost values for the sampling plan (n, c, t / σ) when c = 1 P t / σ0 n Dd Dn Pa AOQ ATI TC
0.75 0.628 0.192 1.257 1.571 2.356 3.141 3.927 4.712 25 22 20 20 20 20 20 20 2.54 2.23 2.10 1.95 1.90 1.82 1.25 0.98 1.42 2.12 3.21 3.45 4.26 5.43 6.23 8.42 0.1514 0.1781 0.2081 0.2426 0.3698 0.4740 0.4852 0.5603 0.0014 0.0021 0.0032 0.0034 0.0042 0.0054 0.0062 0.0084 840.78 852.48 837.20 807.02 734.98 651.91 542.58 462.39 942.69 939.78 921.32 885.46 825.39 798.20 723.39 685.32 0.90 0.628 0.192 1.257 1.571 2.356 3.141 3.927 4.712 27 22 20 20 20 20 20 20 2.72 2.21 2.09 1.91 1.85 1.78 1.69 1.64 1.32 2.23 2.90 3.12 3.82 4.15 5.02 6.25 0.1829 0.2131 0.2620 0.3102 0.3529 0.4241 0.5237 0.6325 0.0013 0.0022 0.0029 0.0031 0.0038 0.0041 0.0050 0.0062 838.71 849.32 825.36 810.02 770.02 725.61 715.29 623.32 935.38 932.46 915.37 898.56 866.32 835.25 822.39 785.63 0.95 0.628 0.192 1.257 1.571 2.356 3.141 3.927 4.712 30 25 23 20 20 20 20 20 2.81 2.69 2.23 1.82 1.65 1.53 1.39 1.27 1.25 2.32 2.62 3.06 3.46 3.95 4.25 5.62 0.1935 0.2643 0.3295 0.3942 0.4642 0.5932 0.6843 0.7523 0.0012 0.0023 0.0026 0.0030 0.0034 0.0039 0.0042 0.0056 825.64 810.29 778.35 745.39 676.25 630.35 615.23 585.31 918.35 898.56 868.32 855.64 799.33 788.57 762.64 745.69 0.99 0.628 0.192 1.257 1.571 2.356 3.141 3.927 4.712 35 28 25 22 21 20 20 20 2.92 2.92 2.34 2.13 1.86 1.73 1.64 1.52 1.02 2.05 2.95 3.46 3.96 4.65 5.95 6.86 0.2013 0.2842 0.3675 0.4038 0.4945 0.6238 0.7239 0.8432 0.0010 0.0020 0.0029 0.0035 0.0040 0.0046 0.0060 0.0068 810.21 775.36 735.45 686.39 653.46 625.32 598.63 578.53 898.56 869.23 826.93 801.23 775.63 745.45 735.23 726.36 VI.
DISCUSSION
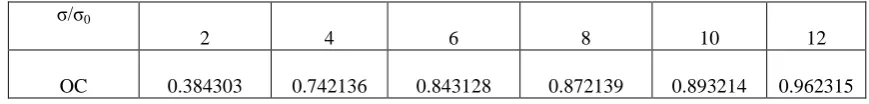
The OC function values for the proposed life testing sampling plan for the time truncated acceptance sampling plan are calculated from table 1 for various given values of (t/σ0 ) and P* with acceptance number c=1
are as follows:
σ/σ0
2 4 6 8 10 12
OC 0.384303 0.742136 0.843128 0.872139 0.893214 0.962315
This shows that if the true average life is twice the specified average life (σ/σ0=2) the producer’s risk is
about to 0.615697, and the producer’s risk is almost equal to zero when the ratio is greater than or equal to 6 times i.e. (σ/σ0 ≥ 6).
From the TABLE 2, we can get the values of AOQ, ATI and TC for the various choices of the ratio of predetermined time (t) and specified average life (σ0) such that (t/σ0) increases then the TC decreases. The
producer’s risk may not exceed 0.05. Thus for c=1, t/σ0 =1.571, n= 20, Dd =1.82, Dn=3.06, AOQ=0.0030, ATI=
745.39 and TC= 855.64.
VII.
CONCLUSION
International organization of Scientific Research
12 | Page
decreases with increase of ratio
t . The total cost provides a help to take a good decision so, it may be
concluded as the proposed sampling plan can be easy to operate for practitioners. This work may be extended for double sampling plan.
ACKNOWLEDGEMENTS
An acknowledgement section may be presented after the conclusion, if desired.REFERENCES
[1]. Epstein, B. (1954). “Truncated life test in the exponential case”, Annals of Mathematical Statistics, vol. 25, 555-564.
[2]. Gupta, S.S. and Groll, P.A. (1961). “Gamma distribution in acceptance sampling based on life tests”,
Journal of the American statistical Association, vol. 56, 942-970.
[3]. Gupta, S.S. (1962).“Life tests plans for normal and log-normal distributions”, Technometrics, vol.4, 151-160.
[4]. Goode, H.P. and Kao, J.H.K. (1961).“Sampling plan based on the weibull distribution”, Proceedings of
the seventh national symposium on Reliability and Quality Control, Philadelphia, 24-40.
[5]. Gupta, R.D. and Kundu,, D. (1999). “Generalized Exponential Distribution”, Australian and NewZealand of Statistics, vol. 41, 173-188.
[6]. Gupta, R.D. and Kundu, D. (2007). “Generalized Exponential Distribution: existing methods and recent developments”, Journal of the Statistical Planning and Inference, vol. 137, 3537-3547.
[7]. Balakrishnan, N., Leiva, V. and Lopez, J., (2007). “Acceptance Sampling Plans from Truncated life test based on generalized Birnbaum-Saunders distribution”, Communication in Statistics- Simulation and
Computation, vol. 36, 643-656.
[8]. Aslam, M. and Shabaz, M.Q., (2007). “Economic Reliability test plans using the generalized exponential distribution”, Journal of Statistics, vol. 14, 52-59.
[9]. Ramaswamy, A.S. and Anburajan,, P., (2012).“Double acceptance sampling based on truncated life tests in generalized exponential distribution.” Applied Mathematical Sciences, 6(64), 3199-3207.
[10]. Baklizi, A., Masari, E.L. and A.E.K., (2004). “Acceptance Sampling plans based on truncated life tests in the Birnbaum Saunders model”, Risk Analysis, Vol.24, 1453-1457.
[11]. Kantham, R.R.L., Rosaiah, k. and Srinivas Rao, G.(2001).“Acceptance sampling plan based on life tests: log-logistic model”, Journal of Applied Statistics, vol.28, 121-128.
[12]. Kumar, S. (2018). “Cost Optimization using Acceptance Sampling Plan: A Statistical Analysis with Single Sample”, Int. j. curr. Microbiol. App.Sci. 7(02), 3759-3768.