20 | P a g e
EARTHEN NALA BUND AS A WATER CONSERVATION STRUCTURE
Digvijay SarukP.G. Student, Department of Civil Engineering, V.I.I.T., Pune, Maharashtra, India [email protected]
Dr. S. N. Londhe
Professor Department of Civil Engineering, V.I.I.T., Pune, Maharashtra, India [email protected]
Abstract - Water is the most important natural resources and is vital for the agriculture and economical development. In Maharashtra state, nearly 82% area of state depends on rainfall and 50% area is drought prone, uncertain, insufficient and irregular rainfall pattern adversely affects agriculture. Drought occur frequently resulting shortage of water for drinking and irrigation. Rainfall is the important source in agricultural activities. Watershed management is one of the very important program that Government of Maharashtra has decided to implement with a view to fulfill the need of the people in rural. To develop agriculture from water resource development and to solve serious drinking water problem is the need of the time. Hence, to solve these problems, different treatments adopted such as area treatment and drainage line treatment. Earthen Nala Bund is a drainage line treatment. Due to construction of ENB, water gets stored. It will percolate water which will increase surrounding water level in wells and bore well.
Keywords: Watershed, Watershed management, Earthen Nala Bund, Jalyukta Shivar Abhiyan.
I. INTRODUCTION
Integrated watershed management program is the strategy adopted in the India for sustainable development of dry land areas and a recent comprehensive assessment of watershed programs in India. One of the definitions of watershed management is “the process of creating and implementing plans, programs and projects to sustain and enhance watershed functions that affect the plant, animal and human communities within a watershed boundary. In spite of sufficient rainfall, people have to face water scarcity for their use especially supply in summers in most of the areas. This is mainly due to large runoff which is responsible for water loss as well as soil loss of the land. Watershed management involves the judicious use of natural resource with active participation of institutions, organization, peoples, in harmony with the ecosystem. There is an increase on concern about watershed problems and interest in methods of meeting them, around the world. Concern over repeated floods, excessive siltation, accelerated erosion with loss of soil and capacities have resulted have in an interest in measures to correct these situations and prevent their occurrences. For development of agriculture and drinking water resources the basic elements required are land and water. Indian agriculture sector is lot more dependent upon the monsoon. But from last few years, due to inadequate rainfall, people are looking towards the underground
water as alternative sources without regarding to its recharge resulting in deepening of ground water table below the ground surface. Rainfall is the important source in agricultural activities. The monsoons affect most part of India, the amount of rainfall varies from heavy to scanty on different parts. There is great regional and temporal variation in the distribution of rainfall. Over 75% of the annual rainfall is received in the four rainy months - June to September [1]. A watershed is an area from which runoff, resulting from precipitation, flows past a single common outlet point into a large stream, a river, lake or a reservoir as shown in fig. 1. A watershed is made up of its physical and hydrological natural resources as well as human resources. Watershed management implies the proper use of all land and water resource of a watershed for optimum production with minimum hazard to natural resources. A watershed may be only a few hectares as in case of small ponds or hundreds of square kilo-meters as in case of rivers. All watersheds can be divided into smaller sub watersheds. Within a watershed, surface and groundwater are generally connected as water flows across the landscape through waterways or vertically through the various layers of soil. Any activity that affects water quality, quantity, or flow rate in one part of the watershed may affect locations downstream. Understanding this connectivity within a watershed, is helpful when planning or managing activities for the future [2].
Fig. 1. Watershed [2]
21 | P a g e
Maharashtra state, from 3 to 4 year the continuous famine
is occurring. In the recent years, there is dangerous drought as like in 1972. The intensity of rainfall is decreases continuously year
by year and hence there is less availability of water in all over state. Recently lesser amount of water was available in all dams of Maharashtra which was causing drought like situations and resulting shortage of water for drinking, agriculture and irrigation. Hence to solve these problems Government of Maharashtra have managed the water by constructing different structures which are efficient and economical [1].
For planning, designing and execution of watershed development projects, the major work involved is in construction of soil and water conservation structures. Unfortunately, there is inadequate information on methodologies governing various activities of watershed development, in the existing sources of information.
Mainly there are two types of treatment works as given below [3]:
Area Treatment: Treatment to the land is called Area Treatment.
Drainage line treatment: Treatment to the natural water courses (nalas) called Drainage Line Treatment.
Area Treatment
1. Continuous Contour Trenches/ Staggered Contour Trenches
2. Contour Bunding 3. Graded Bunds
4. Land Leveling / Terracing Drainage Line Treatment 1. Vegetative Barrier 2. Loose Boulder Structure 3. Gabion Structure 4. Cement Nala Bund 5. Earthen Nala Bund 6. Underground Bandhara 7. Farm Pond
This is case study of an earthen nala bund as a water conservation structure. Following information are provided by Soil and Water conservation structure in Watershed management program, a reference manual by BAIF [3] and Watershed Development Guide (2003), Agriculture office, Pune, Maharashtra [4].
II. EARTHEN NALA BUND (ENB)
A bund constructed out of local soil across the stream to check soil erosion, to store water and to drain out excess water by using spillway is called as Earthen Nala Bund (ENB). Fig. 2 shows Earthen Nala Bund.
Some guidelines are considered while construction of Earthen nala bund. For more guidelines, refer Soil and Water conservation structure in Watershed management program, a reference manual by BAIF [3] and Watershed Development Guide (2003), Agriculture office, Pune, Maharashtra [4]. Some of them are as follows:
Fig. 2. Earthen Nala Bund [5] A. Types of ENB
According to the size of catchment area, earthen nala bund is classified as follows:
Catchment area in between 10 to 40 ha.
Catchment area in between 40 to 80 ha.
Catchment area in between 80 to 500 ha.
Catchment area in between 500 to 1000 ha.
B. Necessity of ENB
To store water.
Availability of water for surrounding farms.
Availability of water in water scarcity area or drought prone areas.
To cut the velocity of flow of water so as to reduce soil erosion.
C. Points Consider For Site Selection
Narrow valley for least amount of earth fills.
Minimum catchment area should be 10 ha. & maximum 1000 ha.
Slope of water course should not be greater than 3%.
The width of nala bed should be at least 5 m & not exceed 15 m.
Profitable area on downstream side of nala should be minimum 4 ha.
The depth of nala should be minimum 1 m.
Sufficient clayey soil for core wall should be available nearby.
The structure should not lead to water spreads into the nearby agricultural fields.
Foundation strata should be capable of bearing the load of the structure.
One of the banks should have suitable strata and area for the spillway,
a. Depth of excavation of the hard strata should be kept minimum.
b. Soil nearby should not be washed away due to water of spillway.
D. Survey and Mapping
Identification of survey numbers in the catchment area.
Contour survey of the storage area.
22 | P a g e
- But not less than 500 m in the nala on the upstream side.
- On the d/s side up to 50 m. Grid survey: 20 m x 20 m on u/s side. 10 m x 10 m on d/s side.
Cross-section of site at an interval of 5 m.
E. Enclosures
Toposheet with site location, catchment delineation and storage area.
10 years of annual Rainfall data
Counter map
Strange’s table
Part plan of survey number map
Command area
Consent of the concerned farmers
F. Design of components of ENB [4]:
1) Puddle Trench: Table 1 shows the sizes of Puddle Trench.
TABLE 1. SIZE OF PUDDLE TRENCH [4]
Catchment area Sizes
10 Ha. to 40 Ha. Width = 2m & Depth = 0.6 m
40 Ha. to 500 Ha. Width = 2m & Depth = Up to Hard Strata or 1 m Maximum
2) Gorge Pit: Table 2 shows the sizes of Gorge Pit.
TABLE 2. SIZE OF GORGE PIT [4] Catchment
area Sizes
10 Ha. to 40 Ha. Width = Width of core wall & Depth = 0.75 m 3) Core wall:
Height = Up to highest flood level
Width = 0.6 m
Side slopes = 1:1 4) Spillway:
Length of spillway = Base width at HFL+24Base width at HFL + 10
Slope = 1:1
Maximum length allowed for spillway is 30 m.
If the Hard moorum is not available for foundation then take a 0.6 m width so as to avoid erosion of spillway.
Construct a header wall of height 0.5 m on downstream side of spillway wall.
5) Stone Pitching:
The thickness of the rubble pitching should be kept between 0.20 m to 0.25 m with 0.15 m thick moorum bedding & done up to HFL.
Fig. 3: Top view of ENB [4] Fig. 3 shows the top view of ENB.
G. Additional Data:
1) Height of Bund = Reservoir level + Head over weir + Free Board
2) Reservoir level 3) Top spillway level
4) Flood depth = Minimum 0.6m & maximum 1.5 m 5) Highest Flood Level
6) Free Board = 1
3 * (Reservoir level + Water level at spillway)
7) Top Bund width:
ENB of height 3m, minimum width should be taken as 1m. Then every 1 m height, add 0.3 m width in it.
Maximum width allowed is 2.2 m.
8) Base width of bund = 2 * Slope * Height of bund + Top Bund width
9) Bund Closure: Table 3 shows the sizes of Bund Closure.
TABLE 3. SIZE OF BUND CLOSURE [4]
Catchment area Sizes
10 Ha. to 80 Ha. No height
80 Ha. to 1000 Ha. Height = Free Board – 0.6 m 10) Slope of ENB:
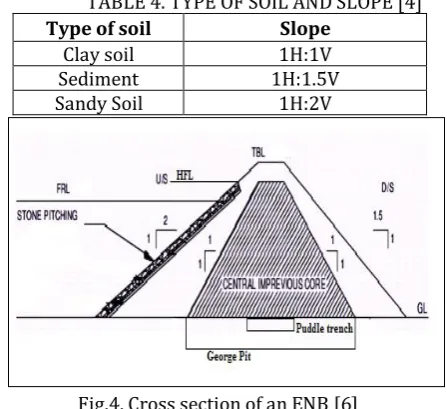
It is depend on the soil used in construction of ENB. Table 4 shows the type of soil and slope.
TABLE 4. TYPE OF SOIL AND SLOPE [4]
Type of soil Slope
Clay soil 1H:1V
Sediment 1H:1.5V
Sandy Soil 1H:2V
Fig.4. Cross section of an ENB [6]
23 | P a g e
Fig.5. Earthen Nala Bund and side channel spillway [7] Fig. 5 Shows ENB and side channel spillway.
III. JALYUKTA SHIVAR ABHIYAN (JSA), GOVT. OF MAHARASHTRA
In Maharashtra state nearly 82% area under Maharashtra is a drought prone area and depends upon on monsoon rain. Water scarcity was declared in 23811 villages in the year 2014-15 and 15747 water scarcity Villages in 2015-16. There is a need to recharge ground water and create decentralized water bodies to overcome the Water Scarcity problem in rain-fed area of the State. Maharashtra government had launched a new program named ‘Jalyukta Shivar Abhiyan in a state on January 26, 2015. The program has aim to make 5000 villages free of water scarcity every year. This Abhiyan aims at initiating permanent measures to make the state drought free by 2019 and to harvest rain water within the village boundary thereby increasing ground water levels [8]. A. Main Objectives of Program
Objectives of this Abhiyan are as given below [8]:
To arrest Maximum runoff in the Village area.
To create decentralized water bodies.
To increase ground water level in Drought prone areas.
To encourage people for Tree Plantation.
To create new structures of Water conservation in the State.
To create awareness and encourage People for efficient use of water for farming.
B. Study Area
JSA is carried out in Pune district. This study is considered of 4 talukas namely Maval, Khed, Ambegaon and Junnar in Pune district. Various works such as Cement Nala Bund (CNB), Recharge shaft, Continuous Contour Trench (CCT), Earthen Nala Bund (ENB), Farm Pond (Shet tale), Percolation Tank, Sediment Removal, Compartment Bunding, Forest Pond (Vantale), Nala deepening and widening are carried out. In order to have better understanding about the issues, with regards to Jalyukta Shivar Abhiyan, thus, the study is primarily a cross-comparison of indicators to provide a general overview of the Impact and Effectiveness of JSA in Maharashtra state. Table 5 shows the number of JSA works carried out division wise. Table 6 shows the work progress and number of works completed in villages in Pune division under JSA.
TABLE 5. DIVISION AND NO. OF JSA WORKS [8]
Division No. of works started in villages
No. of works
Kokan 203 35396
Nashik 941 26764
Pune 903 34026
Aurangabad 1682 65263
Amarawati 1396 25579
Nagpur 1077 15062
Total 6202 170233
TABLE 6. WORK IN PROGRESS AND WORK COMPLETED UNDER JSA [8]
Treatment Works in Progress (No.)
Work Complet ed (No.)
Total (No.)
ENB 402 2491 2893
ENB constructed in different villages in Pune division are shown in fig. 6 to fig. 9. All figures are provided by Jalyukta Shivar Abhiyan, Government of Maharashtra [9].
Fig. 6. ENB at Jaulake (Bk.), Tq. Khed, Dist. Pune [9]
24 | P a g e
Fig. 8. Gadad, Tq. Khed, Dist. Pune [9]
Fig, 9. Vadagaon Pir, Tq. Ambegaon, Dist. Pune [9]
C. Impact of Jalyukta Shivar Abhiyan [8]
1) Increase in Ground Water level: The Water harvesting structures play a key role by storing water and allow sufficient time for water to percolate into ground. Therefore, Increase in ground water table in Drought Prone area in measurable indicator of Successful of JSA as shown in fig. 10.
Fig. 10. Increase in water level in well due to ENB [10]
2) Soil Erosion Reduction: The Soil Erosion was reduced more than 50% in the Jalyukta Shivar Abhiyan Implanted Area Because of compartment bunding, CCT and Deep CCT and Graded Bund.
3) Runoff Reduction: With Regards to Runoff reduction it was observed that the Program is successful in achieving this goal. According to the JSA Beneficiaries this has been possible because of the contour bunding or Field bunding which has also in checking the run-off of Rain water resulting in Soil Moisture Retention.
4) Land-use Pattern: Better Land-use Pattern is one of the important objectives of Watershed Management with increase in surface Water conservation and increase in
Availability of Water in the Watershed regions.
5) Cropping Pattern and Agriculture Productivity: Since water is essential for agricultural Production, with Available water harvesting Structure Farmers are inclined to new cropping Pattern and Agricultural Diversification. 6) Cropping Intensity: The Change in cropping intensity is one of the major indicator to assess impact of the Jalyukta Shivar Abhiyan. Increase in residual moisture content due to contour bunding helping in crop growth and yield. Decrease in Soil Erosion and hence Protection of Fertile top Soil due to contour bunding.
7) Increase in Agriculture Productivity: Result of JSA increase in Agricultural Productivity also Fodder production increased due to this milk Production also increased.
8) Employment Generation: According to the Watershed Guidelines, the Under the Study, Additional employment is generated due to JSA. It was reported that during the implementation of JSA’s Earthen Nala, Bunding, K.T. Weirs Employment have been generated.
IV. CONCLUSIONS
From above study following conclusions are made:
Due to construction of ENB, water gets stored. It will percolate water. Due to this percolated water, more water is available on downstream side of ENB which increases the water level in surrounding wells and bore wells. Therefore, farmers have started taking new crop other than traditional crops and more area was brought under cultivation. Overall watershed management activities carried out in above villages are proved helpful to villages in many ways and can be a good example for other villagers also.
It is found that due to Jalyukta Shivar Abhiyan water losses, soil erosion reduced and recharge of ground water level and water storage capacity also increased under irrigation area. Hence, it will improve productivity and socio-economic conditions of farmers.
Acknowledgment
The authors are thankful to Jalyukta Shivar Abhiyan, Pune division, Govt. of Maharashtra for providing support to conduct study. The authors are also thankful to agriculture department, Pune for providing design guidelines of an Earthen Nala Bund.
References
1) Hangargekar P. A. and Ronge P. M. (2017). A Case Study of Integrated Watershed Management Program at Apsinga Village in Maharashtra, International Research Journal of Engineering and Technology, Vol. 04.
2) Technical Manual for Integrated watershed Management Program May (2011), Gujarat State Watershed Management Agency.
3) www.baif.org.in
4) Watershed Development Guide (2003), Agriculture office, Pune, Maharashtra.
25 | P a g e
6) Patil S. G. and Wayal A. S. (2013). Watershed Management in Rural Area – A Case Study, International Journal of Scientific Engineering and Research, vol. 01.
7) http://www.forests.ap.gov.in
8) Potekar U. P. and Pawar S. K. (2017), Overview on “Jalyukta Shivar Abhiyan” and Micro Irrigation in Maharashtra State, Research Front: An International Peer – Reviewed Multidisciplinary Research Journal, ISSN 2320-6446.
9) mrsac.maharashtra.gov.in/Jalyukta
![Fig. 1. Watershed [2] Need of water goes on increasing day by day and as](https://thumb-us.123doks.com/thumbv2/123dok_us/7799891.1660168/1.595.324.544.516.757/fig-watershed-need-water-goes-increasing-day-day.webp)
![Fig. 2. Earthen Nala Bund [5] A. Types of ENB](https://thumb-us.123doks.com/thumbv2/123dok_us/7799891.1660168/2.595.317.545.71.222/fig-earthen-nala-bund-types-enb.webp)
![Fig. 6. ENB at Jaulake (Bk.), Tq. Khed, Dist. Pune [9]](https://thumb-us.123doks.com/thumbv2/123dok_us/7799891.1660168/4.595.322.546.460.609/fig-enb-jaulake-bk-tq-khed-dist-pune.webp)
![Fig, 9. Vadagaon Pir, Tq. Ambegaon, Dist. Pune [9]](https://thumb-us.123doks.com/thumbv2/123dok_us/7799891.1660168/5.595.44.277.64.365/fig-vadagaon-pir-tq-ambegaon-dist-pune.webp)
