Alteration of Proteomes in First-Generation Cultures of
Bacillus pumilus
Spores Exposed to Outer Space
Abby J. Chiang,a,bGanesh Babu Malli Mohan,cNitin K. Singh,cParag A. Vaishampayan,c Markus Kalkum,a,b Kasthuri Venkateswaranc
aDepartment of Molecular Imaging and Therapy, Beckman Research Institute of City of Hope, Duarte, California, USA
bIrell and Manella Graduate School of Biological Sciences, Beckman Research Institute of City of Hope, Duarte, California, USA
cBiotechnology and Planetary Protection Group, Jet Propulsion Laboratory, California Institute of Technology, Pasadena, California, USA
ABSTRACT Bacillus pumilus SAFR-032 was originally isolated from the Jet Propul-sion Lab Spacecraft Assembly Facility and thoroughly characterized for its enhanced resistance to UV irradiation and oxidative stress. This unusual resistance of SAFR-032 is of particular concern in the context of planetary protection and calls for develop-ment of novel disinfection techniques to prevent extraterrestrial contamination. Pre-viously, spores of SAFR-032 were exposed for 18 months to a variety of space condi-tions on board the International Space Station to investigate their resistance to Mars-like conditions and space travel. Here, proteomic characterization of vegetative SAFR-032 cells from space-surviving spores is presented in comparison to a ground control. Vegetative cells of the first passage were processed and subjected to quan-titative proteomics using tandem mass tags. Approximately 60% of all proteins en-coded by SAFR-032 were identified, and 301 proteins were differentially expressed among the strains. We found that proteins predicted to be involved in carbohydrate transport/metabolism and energy production/conversion had lower abundance than those of the ground control. For three proteins, we showed that the expected meta-bolic activities were decreased, as expected with direct enzymatic assays. This was consistent with a decrease of ATP production in the space-surviving strains. The same space-surviving strains showed increased abundance of proteins related to sur-vival, growth advantage, and stress response. Such alterations in the proteomes pro-vide insights into possible molecular mechanisms ofB. pumilusSAFR-032 to adapt to and resist extreme extraterrestrial environments.
IMPORTANCE Spore-forming bacteria are well known for their resistance to harsh environments and are of concern for spreading contamination to extraterrestrial bodies during future life detection missions. Bacillus pumilushas been regularly iso-lated from spacecraft-associated surfaces and exhibited unusual resistance to ultravi-olet light and other sterilization techniques. A better understanding of the mecha-nisms of microbial survival and enhanced resistance is essential for developing novel disinfection protocols for the purpose of planetary protection. While genomic analy-ses did not reveal the unique characteristics that explain elevated UV resistance of space-exposed B. pumilus, the proteomics study presented here provided intriguing insight on key metabolic changes. The observed proteomics aberrations reveal a complex biological phenomenon that plays a role in bacterial survival and adapta-tion under long-term exposure to outer space. This adaptive ability of microorgan-isms needs to be considered by those tasked with eliminating forward contamina-tion.
KEYWORDS Bacillus pumilusSAFR-032, Mars atmosphere, proteomics, space conditions, tandem mass tag, UV resistance
CitationChiang AJ, Malli Mohan GB, Singh NK, Vaishampayan PA, Kalkum M, Venkateswaran K. 2019. Alteration of proteomes in
first-generation cultures ofBacillus pumilusspores
exposed to outer space. mSystems
4:e00195-19.https://doi.org/10.1128/
mSystems.00195-19.
EditorIleana M. Cristea, Princeton University
Copyright© 2019 Chiang et al. This is an open-access article distributed under the terms
of theCreative Commons Attribution 4.0
International license.
Address correspondence to Markus Kalkum, [email protected], or Kasthuri Venkateswaran, [email protected].
Space travel modifies bacterial spores, alters their proteomes, enhances their resistance to UV radiation, modifies metabolism, and induces adaptation to stress conditions.
Received16 March 2019
Accepted19 May 2019
Published
Molecular Biology and Physiology
11 June 2019
on September 8, 2020 by guest
http://msystems.asm.org/
T
he hardy spores ofBacillusspecies are well known for their resistance to unfavor-able conditions such as UV/gamma radiation, heat, desiccation, chemical disinfec-tion, and starvation (1). In particular, theBacillus pumilusSAFR-032 strain, which was originally isolated from the Jet Propulsion Lab Spacecraft Assembly Facility (JPL-SAF), exhibits unusually high resistance to UV radiation and peroxide treatment compared to other Bacillus species (2, 3). By comparing B. pumilus SAFR-032 with other Bacillus species isolated from SAF or obtained from various sources, spores of B. pumilus SAFR-032 exhibited at least 6-fold more resistance to UV irradiation than others (4). Genomic studies have been carried out to identify candidate genes that may be responsible for the enhanced stress resistance ofB. pumilusSAFR-032. Compared toB. subtilis, several genes involved in spore coat formation and regulation, DNA repair, and peroxide resistance are absent inB. pumilusSAFR-032 (2, 5). However, several unique gene candidates involved in DNA repair and H2O2 neutralization were identified inSAFR-032 only. Nevertheless, the mechanisms that contribute to the survival and elevated resistance of SAFR-032 spores still need to be investigated in more detail to help find a new way to eliminate these spore-forming bacteria associated with space-craft surfaces to prevent extraterrestrial contamination.
One goal of the PROTECT spaceflight experiment during the EXPOSE-E mission was to investigate the molecular mechanisms of resistance of wild-typeBacillusendospores to relevant outer space environments (6). The PROTECT experiment exposed spores of B. pumilusSAFR-032 to different extraterrestrial conditions on board the International Space Station (ISS) for 18 months. The space-exposed conditions included selected conditions of outer space (Space), simulated Martian surface conditions (Mars), and conditions both with and without solar exposure (UV and Dark, respectively). The detailed test parameters of each group (UV-Space, UV-Mars, Space, and Dark-Mars) were reported previously (6, 7). In summary, the exposure included space vacuum (⬃10⫺4Pa), simulated Mars atmosphere (⬃103Pa, 1.6% argon, 0.15% oxygen, 2.7%
nitrogen in CO2), galactic cosmic radiation (140 to 155 mGy), temperature fluctuation
(⫺20°C to⫹59.6°C), and either the full spectrum of solar extraterrestrial electromag-netic radiation (⬎110 nm, 550 MJ/m2) or a simulated Mars UV radiation (⬎200 nm,
400 MJ/m2) (6, 7). After 18 months of exposure in the EXPOSE facility, SAFR-032 spores
from Dark-Space had a 10 to 40% survival rate, and the spores from Dark-Mars had 85 to 100% survival. In contrast, UV exposure resulted in nearly complete destruction of all spores, and only 19 colonies were isolated from test materials that survived the UV-Space and UV-Mars conditions (6). These space-surviving SAFR-032 spores were regrown after returning to Earth and were archived in 50 vials. We refer to this set of isolates as the parent isolates. First-generation cultures of vegetative cells from the parent space-surviving spores were studied. In comparison to the SAFR-032 ground control, the spores retrieved from the UV-Space and UV-Mars conditions showed the highest levels of UVC resistance. Interestingly, the vegetative cells of all space-surviving strains also showed a higher resistance of UVC compared to the ground control, but the vegetative cells of the Dark-Space-exposed conditions had the highest level of resis-tance among all of the space-surviving strains (6).
The objective of the present study was to gain insights into the mechanism of resistance and survival of outer space-exposedB. pumilusSAFR-032 using quantitative proteomics. Vegetative cells that were cultured from the first-generation colonies of space-surviving strains showed a higher radiation resistance than the ground control. It is therefore important to determine the differences in protein abundance under normal, unstressed growth conditions to better understand how the bacteria changed following 18 months of space exposure. Thus, quantitative protein abundances of these first-generation space-surviving strains were compared to the protein abundances in the SAFR-032 ground control. Multiplexed isobaric tandem mass tag (TMT) labeling allowed identification and quantification of the relative abundance of proteins across all strains. In this communication, we present quantitative changes in the bacterial proteome that are related not only to the essential catabolic pathways but also to those
on September 8, 2020 by guest
http://msystems.asm.org/
involved in bacterial survival, growth advantage, and stress response. These changes may contribute to the unique resistance characteristics of space-surviving strains.
RESULTS AND DISCUSSION
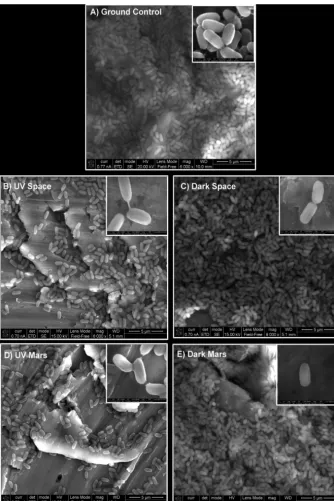
UV resistance of the space-exposedB. pumilusSAFR-032 strains.The scanning electron microscope (SEM) micrographs of the spores exposed to various conditions are shown in Fig. 1. These micrographs were generated directly from the coupons after 18 months of exposure to space or kept on the ground. Even though the starting spore concentrations were equal in all the coupons made, the spore density was less under the UV-exposed conditions (Fig. 1B to D) compared to the ground control (Fig. 1A), as FIG 1 Field emission scanning electron micrographs ofBacillus pumilusSAFR-032 spores on aluminum coupons before and after an 18-month exposure to various space conditions. Intact spore structures are shown in the insets.
on September 8, 2020 by guest
http://msystems.asm.org/
well as in Dark-exposed microorganisms (Fig. 1C to E). UV resistance was determined for 32 isolates that survived under various space conditions and were randomly selected, regrown, and subjected to various exposures to UV at 254 nm (UV254). The UV survival
kinetics (0, 200, and 500 J/m2) of the vegetative cells of the UV-Space (7 strains),
UV-Mars (5 strains), Dark-Space (5 strains), and Dark-Mars (15 strains) conditions are depicted in Fig. 2A (UV survivors) and Fig. 2B (Dark survivors). The results showed that the UV survival was strain specific and was not related to the exposure conditions (UV or Dark or Space or Mars). UV survivability of the selected UV-Space (56T-2), UV-Mars (183T-1), Dark-Space (40T-5), and Dark-Mars (168T-5) strains and the ground control was examined, and the strains were further subjected to UV254exposure from 0 to
900 J/m2(Fig. 2C). The vegetative cells of the ground control did not grow even at
25 J/m2, which was in concordance with UV growth kinetics of vegetative cells reported
in other Bacillus species (8). Vegetative cells of first-generation cultures of space-surviving SAFR-032 strains exhibited only a 3-log reduction in viability at 500 J/m2
(Fig. 2C). In particular, the UV-Space 56T-2 strain grew until after 700 J/m2, and the
Dark-Space 40T-5 strain was the lone UV survivor at a dose as high as 900 J/m2.
Since the genomes of all these SAFR-032 space-surviving strains did not show any variations or single nucleotide polymorphisms compared with the ground control, only the genome of SAFR-032 was deposited (NCBI accession no.CP000813.4) (2, 6). Lack of significant genomic changes emphasizes the importance of proteomic analyses to understand the molecular mechanisms of resistance to extreme irradiation conditions. Proteome analysis overview. The quantitative proteomic differences in the first-generation cultures of archived parent strains of the B. pumilus SAFR-032 ground control and the UV-Space (56T-2), UV-Mars (183T-1), Dark-Space (40T-5), and Dark-Mars (168T-5) strains were identified by using isobaric TMT labeling followed by liquid chromatography-multistage mass spectrometry (LC-MS/MS) analysis on an Orbitrap Fusion Tribid mass spectrometer. The LC-MS/MS spectra were searched against 3,601 proteins reported in NCBI database. In total, 2,146 and 2,225 proteins were identified in each biological replicate, accounting for approximately 60% of all proteins encoded in theB. pumilusSAFR-032 genome. These proteins were then filtered, and only proteins that were identified and quantified in all technical (n⫽3) and biological (n⫽2) replicates were selected for statistical analysis (1,610 proteins) (Fig. 3A and B; see Table S1 in the supplemental material).
The protein abundance levels of four space-surviving strains were first normalized to the unexposedB. pumilusSAFR-032 strain (ground control), and the number of differ-entially abundant proteins of each strain are summarized in Fig. 3C. A total of 301 proteins were either increased or decreased in their abundance, at⬎1.5-fold change in at least one strain, and 70 of these proteins had aPvalue ofⱕ0.05 (one-way analysis of variance [ANOVA]). Heat map hierarchical clustering of proteins showed that the Dark-Space strain 40T-5 did not cluster with other strains, consistent with its unique protein abundance pattern (Fig. 3A). The Dark-Space strain contained the largest number of differentially abundant proteins (n⫽238) compared to the UV-Space (n⫽ 62), UV-Mars (n ⫽ 126), and Dark-Mars (n ⫽ 109) strains (Fig. 3C). Moreover, the Dark-Space strain had more unique proteins with differential abundances (n ⫽117) than the UV-Space (n⫽17), UV-Mars (n⫽21), and Dark-Mars (n⫽9) strains (Table S1). The greatest change in protein abundance for the Dark-Space strain was consistent with its high levels of UV radiation resistance (Fig. 2C), suggesting that its particular proteome may be mechanistically involved in the adaptive stress response.
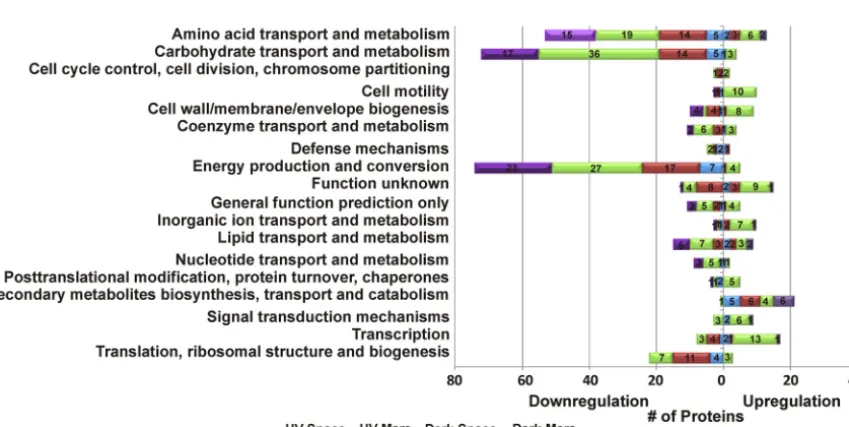
Functional annotations of proteins were derived from the UniProt and the EggNOG version 4.5.1 (9, 10). Clusters of Orthologous Groups (COGs) were used to classify the differential abundance of proteins (Fig. 4; see Table S2 in the supplemental material). A large portion of downregulated proteins in all four space-surviving strains were involved in “carbohydrate transport and metabolism,” “energy production and conver-sion,” “amino acid transport and metabolism,” and “lipid transport and metabolism.” Nevertheless, several proteins that associated with “secondary metabolites
on September 8, 2020 by guest
http://msystems.asm.org/
FIG 2 Measurement of UV254(dosages of 0, 200, and 500 J/m2) resistance from a large collection of ISS
survivors and in-depth measurement of UV254resistance (dosages of 0 to 900 J/m2) of selected strains.
(A) Vegetative cells ofB. pumilusSAFR-032 that survived UV-Space were designated 55 series (2 strains) and 56 series (5 strains). Strains that survived UV-Mars were denoted as 183 series (5 strains). One parental ISS control strain kept on the ground and never flown was used for comparison. (B) Vegetative cells ofB. pumilusSAFR-032 that survived Dark-Space were designated 40 series (5 strains). Strains that survived Dark-Mars were denoted as 167 series (10 strains) and 168 series (6 strains). (C) Quantitative measurement of UV254resistance of selectedB. pumiluscells. Cells with the following designations were
used to measure UV resistance by exposure to UV254at a dosage from 0 to 900 J/m2: Control (kept on
the ground and never flown to space), UV-Space (56T-2), UV-Mars (183T-1), Dark-Space (40T-5), and Dark-Mars (168T-5). Measurements of two dilution series were plated and averaged.
on September 8, 2020 by guest
http://msystems.asm.org/
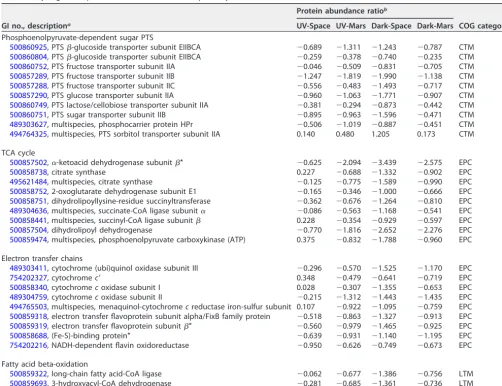
sis, transport, and catabolism,” “transcription,” “cell motility,” and “signal transduction mechanisms” were upregulated and related to the cellular fitness and stress response. Alteration of proteins involved in catabolic pathways.The differential proteome of four space-surviving strains showed a comprehensively downregulated abundance of proteins related to carbohydrate transport and energy production (Fig. 4; Table 1).
FIG 3 Summary ofB. pumilusSAFR-032 proteins identified and quantified in all technical (n⫽3) and biological (n⫽2) replicates. (A) Heat map hierarchical clustering of proteins that have been quantified in each strain. The color key indicated the values that represented the protein abundance ratio (log2) and the number of proteins counted in each value. (B) Venn diagram representing
the overlap of proteins between biological duplicates that were used for the statistical analysis: tandem mass tag (TMT) experiments 1 and 2. (C) Number of proteins up- or downregulated in abundance for each strain compared to the ground control (fold change ofⱖ⫾1.5). The dark blue/red colors represent proteins of differential abundance (Pⱕ0.05, one-way ANOVA).
FIG 4 DysregulatedB. pumilusSAFR-032 proteins, classified according to COG categories (fold change ofⱖ⫾1.5).
on September 8, 2020 by guest
http://msystems.asm.org/
Several proteins associated with phosphoenolpyruvate (PEP)-dependent sugar phos-photransferase system (PTS), including HPr phosphocarrier protein, glucose, fructose, sugar,-glucoside, and lactose/cellobiose PTS transporter were downregulated com-pared to the ground control. Only the abundance of PTS sorbitol transporter IIA was increased in space-surviving strains. Enzymes related to the tricarboxylic acid (TCA) cycle, including␣-ketoacid dehydrogenase, citrate synthase, 2-oxoglutarate dehydro-genase (2-ODH), dihydrolipoyllysine-residue succinyltransferase (DLST), dihydrolipoly dehydrogenase, etc., were also decreased in abundance in space-surviving strains compared to the control. Previously, gene expression levels of bacterial PTS, glucose, and non-glucose catabolism pathways were upregulated in response to limited nutri-ent supply and/or under space conditions (11–13). However, our data showed that the abundance of these proteins in all space-surviving strains that were recultured aero-bically in rich Trypticase soy broth medium on Earth was either decreased or not significantly changed. The bacterial PTS is known to control carbohydrate uptake and is involved in bacterial carbon catabolite repression. By tightly controlling the expres-sion and utilization of nonpreferred carbohydrates like sorbitol and maltose when growing in the presence of preferred carbons such as glucose and fructose, bacteria can optimize their metabolism for energy generation (14). Our data suggest that the space-surviving strains have a preference for using sorbitol as the carbon source, even
TABLE 1Dysregulated proteins involved in catabolic pathways
GI no., descriptiona
Protein abundance ratiob
COG categoryc UV-Space UV-Mars Dark-Space Dark-Mars
Phosphoenolpyruvate-dependent sugar PTS
500860925, PTS-glucoside transporter subunit EIIBCA ⫺0.689 ⫺1.311 ⫺1.243 ⫺0.787 CTM 500860804, PTS-glucoside transporter subunit EIIBCA ⫺0.259 ⫺0.378 ⫺0.740 ⫺0.235 CTM 500860752, PTS fructose transporter subunit IIA ⫺0.046 ⫺0.509 ⫺0.831 ⫺0.705 CTM 500857289, PTS fructose transporter subunit IIB ⫺1.247 ⫺1.819 ⫺1.990 ⫺1.138 CTM 500857288, PTS fructose transporter subunit IIC ⫺0.556 ⫺0.483 ⫺1.493 ⫺0.717 CTM 500857290, PTS glucose transporter subunit IIA ⫺0.960 ⫺1.063 ⫺1.771 ⫺0.907 CTM 500860749, PTS lactose/cellobiose transporter subunit IIA ⫺0.381 ⫺0.294 ⫺0.873 ⫺0.442 CTM 500860751, PTS sugar transporter subunit IIB ⫺0.895 ⫺0.963 ⫺1.596 ⫺0.471 CTM 489303627, multispecies, phosphocarrier protein HPr ⫺0.506 ⫺1.019 ⫺0.887 ⫺0.451 CTM 494764325, multispecies, PTS sorbitol transporter subunit IIA 0.140 0.480 1.205 0.173 CTM
TCA cycle
500857502,␣-ketoacid dehydrogenase subunit* ⫺0.625 ⫺2.094 ⫺3.439 ⫺2.575 EPC
500858738, citrate synthase 0.227 ⫺0.688 ⫺1.332 ⫺0.902 EPC
495621484, multispecies, citrate synthase ⫺0.125 ⫺0.775 ⫺1.589 ⫺0.990 EPC 500858752, 2-oxoglutarate dehydrogenase subunit E1 ⫺0.165 ⫺0.346 ⫺1.000 ⫺0.666 EPC 500858751, dihydrolipoyllysine-residue succinyltransferase ⫺0.362 ⫺0.676 ⫺1.264 ⫺0.810 EPC 489304636, multispecies, succinate-CoA ligase subunit␣ ⫺0.086 ⫺0.563 ⫺1.168 ⫺0.541 EPC 500858441, multispecies, succinyl-CoA ligase subunit 0.228 ⫺0.354 ⫺0.929 ⫺0.597 EPC 500857504, dihydrolipoyl dehydrogenase ⫺0.770 ⫺1.816 ⫺2.652 ⫺2.276 EPC 500859474, multispecies, phosphoenolpyruvate carboxykinase (ATP) 0.375 ⫺0.832 ⫺1.788 ⫺0.960 EPC
Electron transfer chains
489303411, cytochrome (ubi)quinol oxidase subunit III ⫺0.296 ⫺0.570 ⫺1.525 ⫺1.170 EPC
754202327, cytochromec= 0.348 ⫺0.479 ⫺0.641 ⫺0.719 EPC
500858340, cytochromecoxidase subunit I 0.028 ⫺0.307 ⫺1.355 ⫺0.653 EPC 489304759, cytochromecoxidase subunit II ⫺0.215 ⫺1.312 ⫺1.443 ⫺1.435 EPC 494765503, multispecies, menaquinol-cytochromecreductase iron-sulfur subunit 0.107 ⫺0.922 ⫺1.095 ⫺0.759 EPC 500859318, electron transfer flavoprotein subunit alpha/FixB family protein ⫺0.518 ⫺0.863 ⫺1.327 ⫺0.913 EPC 500859319, electron transfer flavoprotein subunit* ⫺0.560 ⫺0.979 ⫺1.465 ⫺0.925 EPC 500858688, (Fe-S)-binding protein* ⫺0.639 ⫺0.931 ⫺1.140 ⫺1.195 EPC 754202216, NADH-dependent flavin oxidoreductase ⫺0.950 ⫺0.626 ⫺0.749 ⫺0.673 EPC
Fatty acid beta-oxidation
500859322, long-chain fatty acid-CoA ligase ⫺0.062 ⫺0.677 ⫺1.386 ⫺0.756 LTM 500859693, 3-hydroxyacyl-CoA dehydrogenase ⫺0.281 ⫺0.685 ⫺1.361 ⫺0.736 LTM
a*,Pⱕ0.05 (one-way ANOVA).
bThe values shown represent protein abundance ratios (log
2) normalized to the ground control.
cCTM, carbohydrate transport and metabolism; EPC, energy production and conversion; LTM, lipid transport and metabolism.
on September 8, 2020 by guest
http://msystems.asm.org/
though they were cultured in a glucose-rich medium. Alternatively, upregulation of the sorbitol transporter may be a stress response similar to what has been reported for other microorganisms (15).
Metabolic shutdown of TCA cycle and electron transport chains has been demon-strated in both bacterial and human cell lines, which were exposed to oxidative stress (16, 17). In particular, decreasing the activity of 2-ODH controls the redox balance by diminishing reactive oxygen species (ROS) and NADH formation (16). The reduction of NADH also further reduces NADH-generated ROS via oxidative phosphorylation (18). In line with our observation, space-surviving strains showed decreased abundance of 2-ODH and its protein complex DLST compared to the ground control. Especially, the Dark-Space strain showed the lowest abundance of 2-ODH and DLST (2- and 2.4-fold lower than the ground control) compared to other strains. Furthermore, space-surviving strains also exhibited reduced abundance of proteins involved in electron transfer activity, including cytochromecoxidase subunit, electron transfer flavoprotein subunit, NADH-dependent flavin oxidoreductase, etc. Particularly flavin is a redox agent and is involved in ROS formation (19). Decreased abundance of flavoproteins in space-surviving strains suggested the reduction of ROS generation. Also, the Dark-Space strain showed the lowest expression of electron transfer flavoprotein subunits alpha and beta (⬃2.6-fold lower than the control) compared to other strains. In addition, beta-oxidation of fatty acid is known to generate acetyl coenzyme A (acetyl-CoA) as well as NADH and reduced flavin adenine dinucleotide (FADH2), which can
further enter the TCA cycle and electron transport chain (20, 21). In line with the reduced protein abundance involved in the TCA cycle and electron transfer chain in space-surviving strains, several fatty acid beta-oxidation proteins such as long-chain fatty acid-CoA ligase and 3-hydroxyacyl-CoA dehydrogenase were also decreased in abundance, particularly in the Dark-Space strain (⬃2.6-fold lower than the control). Collectively, the differential abundance of these proteins in space-surviving strains suggested that the regulation of redox signaling to prevent the generation of oxidants or ROS in cells might contribute to their survival in the extreme environment.
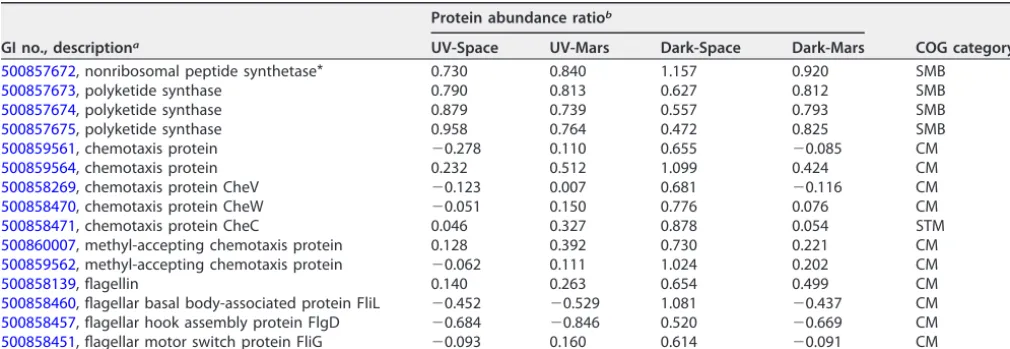
Alteration of proteins contributed to the bacterial competitive growth advan-tage.Living microorganisms are known to have complex but efficient mechanisms to adapt to a variety of environmental stresses for survival. The increased abundance of certain proteins might contribute to the growth advantage of the space-surviving strains. Those include nonribosomal peptide synthetase (NRPS), polyketide synthase (PKS), flagellin, and chemotaxis (Table 2). NRPS and PKS are multifunctional enzymes that synthesize a diverse group of secondary metabolites in bacteria and fungi. These
TABLE 2Dysregulated proteins involved in competitive growth advantage
GI no., descriptiona
Protein abundance ratiob
COG categoryc
UV-Space UV-Mars Dark-Space Dark-Mars
500857672, nonribosomal peptide synthetase* 0.730 0.840 1.157 0.920 SMB
500857673, polyketide synthase 0.790 0.813 0.627 0.812 SMB
500857674, polyketide synthase 0.879 0.739 0.557 0.793 SMB
500857675, polyketide synthase 0.958 0.764 0.472 0.825 SMB
500859561, chemotaxis protein ⫺0.278 0.110 0.655 ⫺0.085 CM
500859564, chemotaxis protein 0.232 0.512 1.099 0.424 CM
500858269, chemotaxis protein CheV ⫺0.123 0.007 0.681 ⫺0.116 CM
500858470, chemotaxis protein CheW ⫺0.051 0.150 0.776 0.076 CM
500858471, chemotaxis protein CheC 0.046 0.327 0.878 0.054 STM
500860007, methyl-accepting chemotaxis protein 0.128 0.392 0.730 0.221 CM 500859562, methyl-accepting chemotaxis protein ⫺0.062 0.111 1.024 0.202 CM
500858139, flagellin 0.140 0.263 0.654 0.499 CM
500858460, flagellar basal body-associated protein FliL ⫺0.452 ⫺0.529 1.081 ⫺0.437 CM 500858457, flagellar hook assembly protein FlgD ⫺0.684 ⫺0.846 0.520 ⫺0.669 CM 500858451, flagellar motor switch protein FliG ⫺0.093 0.160 0.614 ⫺0.091 CM
a*,Pⱕ0.05 (one-way ANOVA).
bThe values shown represent protein abundance ratios (log
2) normalized to the ground control.
cSMB, secondary metabolite biosynthesis, transport and catabolism; CM, cell motility; STM, signal transduction mechanisms.
on September 8, 2020 by guest
http://msystems.asm.org/
secondary metabolites include toxins, antibiotics, siderophores, pigments, or immuno-suppressants that could play an important role in the development, survival, and virulence of microorganisms (22). Even though the secondary metabolites that are produced by NRPS and PKS ofB. pumilusare yet unknown, previous studies demon-strated that the production of secondary metabolites related to antimicrobial, antiviral activity, and biofilm formation were important for the survival and growth ofB. subtilis and other bacilli (23, 24). In addition, both flagellin and chemotaxis proteins are involved in bacterial cell motility and are essential for bacteria to sense their surround-ings and migrate toward more favorable environments. Several studies showed that flagellin and chemotaxis can be essential for bacterial adhesion, invasion, biofilm formation, and virulence (25). Upregulation of flagellin and chemotaxis genes was identified in bacteria that were cultured under limited nutrient and stress conditions (26–28). Notably, the Dark-Space strain expressed the highest abundance of NRPS, flagellin, and chemotaxis proteins (⬃1.5- to 2-fold higher than the control), suggesting that it may have particular secondary metabolites profiles and cell motility ability to enhance its growth advantage.
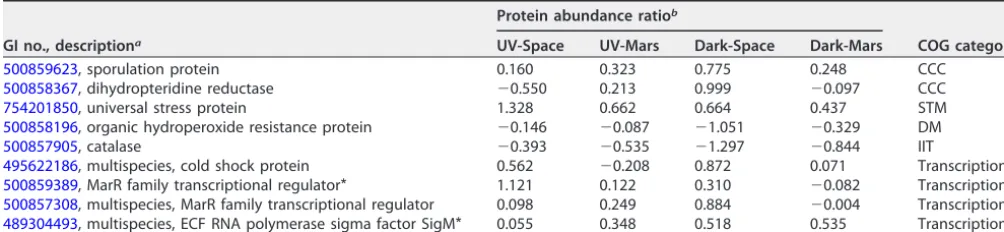
Alteration of enzyme abundance involved in the stress response.Several stress response-related proteins had increased abundance in space-surviving strains com-pared to the ground control, including sporulation protein (Spo0M), universal stress protein (UspA), and stress response transcriptional regulators (Table 3). One major factor that contributes to the resistance and long-term survival ofBacillusmay likely be its spore-forming capability. Enhanced sporulation of space-surviving strains was ob-served compared to the ground control (6). Here, our data showed that Spo0M, an important sporulation regulator that is involved in initiating sporulation and cell division (29), and dihydropteridine reductase or cell division protein DivIB, an essential protein for efficient sporulation under harsh conditions (30), were increased in abun-dance in space-surviving strains, particularly in the Dark-Space strain (⬃1.7- to 2-fold higher than the control). Moreover, the primary function of UspA is to protect bacteria from environmental stresses such as starvation, oxidative stress, chemical stress, etc. (31). UspA cooperates with RecA to protect against DNA damage, and deletion of UspA can result in sensitivity to UV exposure (32). The increased abundance of UspA in space-surviving strains, particularly in the UV-Space (2.5-fold) and Dark-Space (1.6-fold) strains, suggested that UspA might contribute to the enhanced resistance in these strains. In addition, the abundance of other stress response regulatory proteins such as cold shock protein (Csp) and ECF RNA polymerase sigma factor SigM were also increased in space-surviving strains compared to the ground control. The induction of bacterial Csp was shown as a response to the downshift of temperature as well as to other stressors, such as starvation and osmotic stress (33, 34). Furthermore, the expres-sion of SigM is induced in response to acid, heat, salt, superoxide, and cell envelope stresses, and SigM is essential in maintaining bacterial membrane and cell wall integrity (35, 36).
TABLE 3Dysregulated proteins involved in the stress response
GI no., descriptiona
Protein abundance ratiob
COG categoryc
UV-Space UV-Mars Dark-Space Dark-Mars
500859623, sporulation protein 0.160 0.323 0.775 0.248 CCC
500858367, dihydropteridine reductase ⫺0.550 0.213 0.999 ⫺0.097 CCC
754201850, universal stress protein 1.328 0.662 0.664 0.437 STM
500858196, organic hydroperoxide resistance protein ⫺0.146 ⫺0.087 ⫺1.051 ⫺0.329 DM
500857905, catalase ⫺0.393 ⫺0.535 ⫺1.297 ⫺0.844 IIT
495622186, multispecies, cold shock protein 0.562 ⫺0.208 0.872 0.071 Transcription 500859389, MarR family transcriptional regulator* 1.121 0.122 0.310 ⫺0.082 Transcription 500857308, multispecies, MarR family transcriptional regulator 0.098 0.249 0.884 ⫺0.004 Transcription 489304493, multispecies, ECF RNA polymerase sigma factor SigM* 0.055 0.348 0.518 0.535 Transcription
a*,Pⱕ0.05 (one-way ANOVA).
bValues represent protein abundance ratios (log
2) normalized to the ground control.
cCCC, cell cycle control, cell division, chromosome partitioning, transport, and catabolism; UN, function unknown; STM, signal transduction mechanisms; DM, defense mechanism; IIT, inorganic ion transport and metabolism.
on September 8, 2020 by guest
http://msystems.asm.org/
Interestingly, some known stress response proteins such as organic hydroperoxide resistance protein (Ohr), and catalase were downregulated (Table 3), while others, such as superoxide dismutase (SOD), were not significantly changed in the space-surviving strains (see Table S3 in the supplemental material) (37, 38). Decreased abundance of these proteins might be mediated by the stress response regulator MarR. Mar is the multiple antibiotic resistance protein regulator that regulates the expression of genes involved in stress responses, virulence, or degradation or resistance to toxic chemicals (39). Mar repressor (MarR) functions as a negative regulator of the Mar operon. The expression of MarR inhibits the effect of bacterial resistance to antibiotics and synthesis of antioxidants, but this repressive effect can be reversed when bacteria sense cellular stress from the environment (40–42). Since MarR is known to regulate several stress response proteins such as Ohr regulator and SOD (43, 44), increased abundance of MarR, especially in the Dark-Space (⬃1.5-fold) and UV-Space (⬃1.6-fold) strains, might functionally explain the decreased abundance of stress response proteins observed in our study. Since the proteome generated in this study was from the first-generation cells grown on Earth without additional stress exposure, it would be interesting to investigate proteomic changes before and after stresses (e.g., UV exposure), to identify the proteins that are directly in response to the stress conditions. Collectively, increased abundance of stress response proteins in Dark-Space and UV-Space strains might contribute to their resistance to oxidative stress associated with the extreme space environments.
Validation of differences in protein abundance using enzyme activity and ATP assays.Consistent with previous observations in the stress response of bacteria (16, 17, 45), our proteomics analysis showed downregulation of several proteins involved in the TCA cycle and electron transfer chain in space-surviving strains compared to the ground control. To functionally validate the results, we measured the enzymatic activities of key enzymes in the TCA cycle, including citrate synthase (CS), succincyl-CoA ligase (SCL),␣-ketoglutarate dehydrogenase (KGDH or 2-ODH), and the production of ATP. All three enzymatic assays showed increased activity in the ground control strain compared to the space-surviving strains (Fig. 5A to C). In particular the Dark-Space strain showed a significantly lower enzymatic activity compared to that of the ground control which was consistent with its protein profiles. Moreover, the amount of ATP production was significantly reduced in all space-surviving strains compared to that of the ground control (Fig. 5D). The decreased production of ATP in all space-surviving strains was also in agreement with our proteomics analysis in which proteins associated with energy production and conversion pathways had reduced abundance. Taken together, these functional assays demonstrated that the activities of TCA cycles and energy metabolism were decreased in space-surviving strains compared to the ground control, which was consistent with the observed quantitative changes in the pro-teomes.
Conclusions.This study provides the first comprehensive picture of the proteomic changes inB. pumilusSAFR-032 induced by exposure to outer space. It was expected that the abundances of DNA repair proteins and some other stress response proteins were not significantly changed in bacterial cultures without stress exposure. Neverthe-less, these data suggest that the abundance of metabolic enzymes in vegetative B. pumilus SAFR-032 strains has been altered after 18 months of space exposure of its spores even after regrowing them on Earth. The altered protein abundances in the categories of energy metabolism and stress response suggest that the space-surviving strains, in particular the Dark-Space strain, may have evolved to better cope with stressful environments. Future epigenetic studies should be undertaken to clarify the underlying mechanism that caused the observed proteomic alterations. Further multi-omics experiments should be conducted to examine various stressors (e.g., irradiation, oxidative stress conditions, etc.) at different time points to understand the molecular pathways for their resistance in extreme environments.
on September 8, 2020 by guest
http://msystems.asm.org/
MATERIALS AND METHODS
Bacterial culture and selection of UV254resistance.Among the surviving spores under UV-Space (7 strains), UV-Mars (5 strains), Dark-Space (5 strains), and Dark-Mars (15 strains) conditions, 32 strains were regrown after returning to Earth and tested for their UV survival. One strain from each of these four conditions was selected for its highest UV survival for subsequent experimentations. Cells ofB. pumilus SAFR-032 (control and space-surviving strains) were grown in Trypticase soy broth overnight and diluted in phosphate-buffered saline (pH 7.2) to achieve a density of 0.1 at the optical density at 600 nm (OD600).
Initial cell density (106to 109CFU/ml) was estimated by serial dilution plating before each exposure. A
low-pressure handheld mercury arc UV lamp (UVP, Inc.; model UVG-11; [UVC, 254 nm]) was placed at a fixed height over the sample, and the UV flux at the surface of the spore suspension was measured with a UVX digital radiometer (UVP, Inc.). Exposure times necessary to yield fluences from 200 to 4,000 J/m2
at the sample surface were determined (UV flux was 1 J/m2s2). Under aseptic conditions, each cell
suspension was placed into an uncovered 50-mm glass petri dish, within a class II biological safety cabinet fitted with UV lighting (Fisher Scientific), and stirred with a magnetic stir bar (3 to 5 mm in length) while being exposed to UV irradiation. When 10 ml (106CFU/ml) of cell suspension was added to the
50-mm petri dish, the height of the liquid was 3 mm. The liquid spore suspension was stirred gently (100 rpm) to avoid splashing; this setup allowed the cells to be exposed to UVC evenly. From these, sample volumes of 100l were removed at specific time points, serially diluted, and spread atop tryptic soy agar (Difco) plates. After 24 to 48 h of incubation, the resulting CFU were counted, and the surviving fraction was calculated.
Electron microscopy.Field emission scanning electron microscopy (FE-SEM) provides high spatial resolution combined with low electron beam accelerating voltage. The low-beam voltage of the FE scanning electron microscope allows examination of electrical insulators without having to deposit a surface-conducting (carbon or metal) layer to eliminate specimen charging, which can lead to a distorted and often completely unusable image. The deposition of a conducting material to control charging can complicate the analysis. In many situations, a low electron beam voltage intrinsically results in a much sharper image, especially of thin structures composed of elements of low atomic number. A Philips (FEI, Hillsboro, OR) FE-SEM (XL-50) was used to analyze a majority of the samples. Elemental analysis is possible in a scanning electron microscope equipped with an energy-dispersive X-ray (EDX) analyzer. EDX is based on the analysis of the characteristic X rays emitted when an electron beam is incident on FIG 5 Validation of proteomics data through enzymatic assays and ATP determination. (A to C) Citrate synthase (CS), succinyl-CoA ligase (SCL), and␣-ketoglutarate dehydrogenase (KGDH) enzymatic activities were measured by using 25, 5, and 100g total protein from each strain. (D) Amount of ATP in lysate with 10g total protein per strain. Asterisks represent aPvalue ofⱕ0.05 (*),ⱕ0.005 (**), orⱕ0.0001 (****) compared to the ground control as determined by one-way ANOVA with Tukey’s test for multiple
comparisons.
on September 8, 2020 by guest
http://msystems.asm.org/
a sample. The acceleration voltage for analyzing aluminum samples was⬃10 to 20 kV. In the high-vacuum mode, secondary electron images were acquired. Similar settings were maintained when different models or scanning electron microscope instruments were used.
Protein extraction.SelectedB. pumilusSAFR-032 strains that exhibited high UV254resistance and
were exposed to UV-Space (56T-2), UV-Mars (183T-1), Dark-Space (40T-5), or Dark-Mars (168T-5) condi-tions and the ground control were cultured under aerobic condicondi-tions in 300 ml of sterile Trypticase soy broth medium at 100 rpm at 25°C. After 48 h, the bacterial cultures were centrifuged at 4°C. The cell pellets were washed, and decanted pellets were stored at⫺80°C until further processing.
About 1 g of cell pellets was lysed with a buffer consisting of 100 mM triethylammonium bicarbonate (TEAB) with 1:100 Halt protease inhibitor cocktail (Thermo Fisher Scientific, Rockford, IL) and 1 mM phenylmethylsulfonyl fluoride (Sigma-Aldrich, St. Louis, MO). The crude homogenates were subjected to a Precellys 24 homogenizer (Bertin, Rockville, MD) in which each sample was processed inside a 2-ml cryotube with 1.0-mm glass beads three times at 4°C, at 6,500 rpm, for 1 min and 3 times with 15-s pauses in between). The lysed bacterial cells were centrifuged at 17,000⫻g for 15 min. Protein concentrations in the supernatants were measured by Bradford assay (Bio-Rad Laboratories, Inc., Her-cules, CA).
TMT labeling.Samples were processed as described by Romsdahl et al. with modification (46). Two hundred micrograms of proteins from each sample was precipitated in 20% trichloroacetic acid at 4°C. Protein pellets were obtained by centrifugation (17,000 ⫻ g), washed with ice-cold acetone, and resuspended in 25l TEAB (100 mM) and 25l 2,2,2-trifluoroethanol (TFE). Proteins were reduced by adding 1l of tris(2-carboxyethyl)phosphine (TCEP; 500 mM) and incubated for 1 h at 37°C (10 mM final TCEP concentration). Proteins were alkylated in the presence of iodoacetamide (IAA; 30 mM) in the dark for 1 h at room temperature. Mass spectrometry-grade trypsin/lysC (Promega, Madison, WI) at 2.5g per sample was used to digest the peptides overnight at 37°C.
The digested peptides were quantified using the Pierce quantitative colorimetric peptide assay (Thermo Fisher Scientific). Forty micrograms of peptides from each sample was labeled with the Thermo Scientific TMTsixplex (TMT6) isobaric mass tagging kit (ground control with TMT6-126, UV-Space with
TMT6-127, UV-Mars with TMT6-128, Dark-Space with TMT6-129, and Dark-Mars with TMT6-130) according
to the manufacturer’s protocol. The TMT6-131 label was used as a reference that contained 8g of
peptides from each of the five samples. All six labeled-peptide mixtures were combined into a single tube, mixed, and fractionated using the Pierce high-pH reversed-phase peptide fractionation kit (Thermo Fisher Scientific). Eight fractions were dried using a SpeedVac concentrator and resuspended in 1% formic acid prior to LC-MS/MS analysis.
LC-MS/MS analysis.The samples were analyzed on an Orbitrap Fusion Tribrid mass spectrometer with an EASY-nLC 1000 liquid chromatograph, a 75-m by 2-cm Acclaim PepMap100 C18 trapping
column, and a 75-m by 25-cm PepMap rapid-separation liquid chromatography (RSLC) C18analytical
column, and an Easy-Spray ion source (Thermo Fisher Scientific). The column temperature was main-tained at 45°C, and the peptides were eluted at a flow rate of 300 nl/min over a 110-min gradient, from 3 to 30% solvent B (100 min), 30 to 50% solvent B (3 min), 50 to 90% solvent B (2 min), and 90% solvent B (2 min). Solvent A was 0.1% formic acid in water, and solvent B was 0.1% formic acid in acetonitrile. The full MS survey scan (m/z400 to 1,500) was acquired in the Orbitrap at a resolution of 120,000 and with an automatic gain control (AGC) target of 2⫻105. The maximum injection time for MS scans was
50 ms. Monoisotopic precursor ions were selected with charge states 2 to 7 with a⫾10-ppm mass window using a 70-s dynamic exclusion. The MS2scan (m/z400 to 2,000) was performed using the linear
ion trap with the collision-induced dissociation (CID) collision energy set to 35%. The ion trap scan rate was set to “rapid,” with an AGC target of 4⫻103and a maximum injection time of 150 ms. Ten fragment
ions from each MS2experiment were subsequently simultaneously selected for an MS3experiment. The
MS3scan (m/z100 to 500) was performed to generate the TMT reporter ions in the linear ion trap using
HCD at a collision energy setting of 55%, a rapid scan rate, an AGC target of 5⫻103, and a maximum
injection time of 250 ms.
Quantitative proteomics analysis.All MS/MS spectra were analyzed using the Proteome Discoverer (version 2.2.0.388; Thermo Fisher Scientific) with the Sequest-HT searching engines and aBacillus pumilus SAFR-032 database containing 3,601 sequences (NCBI). The search was performed with the following parameters: a maximum of 2 missed cleavage sites, a minimum peptide length of 6, a tolerance for precursor ion masses of 5 ppm, and a tolerance for fragment ion masses of 0.6 Da. The static modification settings included carbamidomethyl of cysteine residues, and dynamic modifications included oxidation of methionine, TMT6plex modification of lysine-amino groups and peptide N termini, and acetyl modification of protein N terminus. A false-discovery rate (FDR) of 1% for peptides and proteins was obtained using a target-decoy database search. The reporter ion’s integration tolerance was 0.5 Da, while the coisolation threshold was 75%. The average signal-to-noise threshold of all reporter peaks was greater than 10. The quantitative abundance of each protein is determined from the total intensity of the detected reporter ions. The ratios between reporter and the reference reporter ion (TMT6-131) were used
to estimate the abundance ratio of each protein.
Technical triplicate measurements for each protein were averaged. Only proteins that were identified and quantified with at least one peptide detected in all three technical replicates were considered for the analysis. The normalization across two biological sample sets in two separate TMT experiments was carried out according to Plubell et al., with modifications (47). Briefly, the data from the two TMT experiments were first corrected for small systematic differences resulting from sample loading variations and labeling efficiency, by normalizing the reporter ion totals for each channel. The trimmed mean of M value (TMM) normalization corrected the compositional bias by aligning the median of the distribution
on September 8, 2020 by guest
http://msystems.asm.org/
of abundance intensities between samples (48). Internal reference scaling was used to adjust the two TMT data sets onto the same intensity scale. The normalized data were then averaged and log2
transformed. One-way ANOVA was preformed to identify proteins that were significantly differentially expressed among strains (Pⱕ0.05). The identified proteins were also evaluated for up- and downregu-lation by setting a minimum limit of⫾1.5-fold change.
Validation of proteome analysis.Citrate synthase, succinyl-CoA synthetase, and␣-ketoglutarate dehydrogenase enzyme activities were measured using the assay kits according to the manufacturer’s protocols (Sigma-Aldrich; MAK193, MAK217, and MAK189). Briefly, each parental strain was cultured in Trypticase soy broth medium for 48 h. The bacterial cell pellets were collected and lysed using the specific assay buffer provided in each kit. The amount of total protein in each strain was measured using the bicinchoninic acid (BCA) protein assay (Pierce/Thermo Scientific) and used as a reference to compare enzyme activities between samples. One-way ANOVA with Tukey’s test for multiple comparisons was used to examine differences in enzyme activities between ground control and space-surviving strains.
The ATP production in each strain was measured by using CellTiter-Glo luminescent cell viability assay according to the manufacturer’s protocol (Promega; G7571). Briefly, each strain was cultured and lysed as described previously above. Lysates with 10g total protein per sample were used to compare each sample-specific amount of ATP. One-way ANOVA with Tukey’s test for multiple comparisons was used to analyze the statistical significance of ATP production between ground controls and space-surviving strains. Accession number(s). The mass spectrometry proteomics data have been deposited into the ProteomeXchange Consortium via the PRIDE (49) partner repository under data set identifierPXD011292. SUPPLEMENTAL MATERIAL
Supplemental material for this article may be found at https://doi.org/10.1128/ mSystems.00195-19.
TABLE S1, XLSX file, 0.1 MB. TABLE S2, XLSX file, 0.1 MB. TABLE S3, XLSX file, 0.2 MB.
ACKNOWLEDGMENTS
The research described in this publication was carried out in part at the Jet Propulsion Laboratory, California Institute of Technology, under a contract with the National Aeronautics and Space Administration. This research was funded by a NASA Research Announcement Research Opportunities in Space and Earth Sciences (NRA ROSES) grant. A.J.C. and M.K. were supported by JPL subcontract no. 1576895. The Mass Spectrometry & Proteomics Core facility of City of Hope was supported in part by the National Cancer Institute of the National Institutes of Health under award no. P30CA033572. Government sponsorship is acknowledged.
The PROTECT team thanks the astronauts and Gerda Horneck, PI of this project, who were involved in the exposure and retrieval of EXPOSE-E, the team at ESA’s European Space Research and Technology Centre during EXPOSE-E planning, operation, and evaluation, the KT and RedShift teams, and the team at DLR Microgravity User Support Center, who contributed to the EXPOSE-E preparation, engineering verification testing, EST, and MGR.
A.J.C. wrote the manuscript and contributed to protein sample processing, LC-MS analyses, and proteomic data analysis and interpretation. G.B.M.M. grew bacterial biomass for the proteome study, generated FE-SEM images, and analyzed UV exposure data. N.K.S. interpreted the proteome analyses. P.A.V. conducted the screening of space-exposed strains for UV irradiation and contributed to sample processing. M.K. contributed to the proteomic study design, data analysis and interpretation, and drafting of the manuscript. K.V. designed the study, interpreted space exposure con-ditions with proteome data characterization, and drafted the manuscript. All authors contributed to the scientific discussion and revision of the article. All authors read and approved the final manuscript.
We declare no competing financial interests.
REFERENCES
1. Nicholson WL, Munakata N, Horneck G, Melosh HJ, Setlow P. 2000. Resistance of Bacillus endospores to extreme terrestrial and extraterres-trial environments. Microbiol Mol Biol Rev 64:548 –572.https://doi.org/ 10.1128/mmbr.64.3.548-572.2000.
2. Gioia J, Yerrapragada S, Qin X, Jiang H, Igboeli OC, Muzny D, Dugan-Rocha S, Ding Y, Hawes A, Liu W, Perez L, Kovar C, Dinh H, Lee S, Nazareth L, Blyth P, Holder M, Buhay C, Tirumalai MR, Liu Y, Dasgupta I, Bokhetache L, Fujita M, Karouia F, Eswara Moorthy P, Siefert J, Uzman A,
on September 8, 2020 by guest
http://msystems.asm.org/
Buzumbo P, Verma A, Zwiya H, McWilliams BD, Olowu A, Clinkenbeard KD, Newcombe D, Golebiewski L, Petrosino JF, Nicholson WL, Fox GE, Venkateswaran K, Highlander SK, Weinstock GM. 2007. Paradoxical DNA repair and peroxide resistance gene conservation in Bacillus pumilus SAFR-032. PLoS One 2:e928.https://doi.org/10.1371/journal .pone.0000928.
3. Link L, Sawyer J, Venkateswaran K, Nicholson W. 2004. Extreme spore UV resistance of Bacillus pumilus isolates obtained from an ultraclean Spacecraft Assembly Facility. Microb Ecol 47:159 –163.https://doi.org/10 .1007/s00248-003-1029-4.
4. Newcombe DA, Schuerger AC, Benardini JN, Dickinson D, Tanner R, Venkateswaran K. 2005. Survival of spacecraft-associated microorgan-isms under simulated Martian UV irradiation. Appl Environ Microbiol 71:8147– 8156.https://doi.org/10.1128/AEM.71.12.8147-8156.2005. 5. Tirumalai MR, Rastogi R, Zamani N, O’Bryant Williams E, Allen S, Diouf F,
Kwende S, Weinstock GM, Venkateswaran KJ, Fox GE. 2013. Candidate genes that may be responsible for the unusual resistances exhibited by Bacillus pumilus SAFR-032 spores. PLoS One 8:e66012.https://doi.org/ 10.1371/journal.pone.0066012.
6. Vaishampayan PA, Rabbow E, Horneck G, Venkateswaran KJ. 2012. Sur-vival of Bacillus pumilus spores for a prolonged period of time in real space conditions. Astrobiology 12:487– 497.https://doi.org/10.1089/ast .2011.0738.
7. Horneck G, Moeller R, Cadet J, Douki T, Mancinelli RL, Nicholson WL, Panitz C, Rabbow E, Rettberg P, Spry A, Stackebrandt E, Vaishampayan P, Venkateswaran KJ. 2012. Resistance of bacterial endospores to outer space for planetary protection purposes— experiment PROTECT of the EXPOSE-E mission. Astrobiology 12:445– 456.https://doi.org/10.1089/ast .2011.0737.
8. Marshall MM, Hayes S, Moffett J, Sterling CR, Nicholson WL. 2003. Comparison of UV inactivation of spores of three encephalitozoon spe-cies with that of spores of two DNA repair-deficient Bacillus subtilis biodosimetry strains. Appl Environ Microbiol 69:683– 685. https://doi .org/10.1128/aem.69.1.683-685.2003.
9. Huerta-Cepas J, Szklarczyk D, Forslund K, Cook H, Heller D, Walter MC, Rattei T, Mende DR, Sunagawa S, Kuhn M, Jensen LJ, von Mering C, Bork P. 2016. eggNOG 4.5: a hierarchical orthology framework with improved functional annotations for eukaryotic, prokaryotic and viral sequences. Nucleic Acids Res 44:D286 –D293.https://doi.org/10.1093/nar/gkv1248. 10. The UniProt Consortium. 2017. UniProt: the universal protein knowl-edgebase. Nucleic Acids Res 45:D158 –D169.https://doi.org/10.1093/ nar/gkw1099.
11. Zea L, Prasad N, Levy SE, Stodieck L, Jones A, Shrestha S, Klaus D. 2016. A molecular genetic basis explaining altered bacterial behavior in space. PLoS One 11:e0164359.https://doi.org/10.1371/journal.pone.0164359. 12. Aunins TR, Erickson KE, Prasad N, Levy SE, Jones A, Shrestha S,
Mastrac-chio R, Stodieck L, Klaus D, Zea L, Chatterjee A. 2018. Spaceflight modifies Escherichia coli gene expression in response to antibiotic exposure and reveals role of oxidative stress response. Front Microbiol 9:310.https://doi.org/10.3389/fmicb.2018.00310.
13. Chubukov V, Sauer U. 2014. Environmental dependence of stationary-phase metabolism in Bacillus subtilis and Escherichia coli. Appl Environ Microbiol 80:2901–2909.https://doi.org/10.1128/AEM.00061-14. 14. Singh KD, Schmalisch MH, Stülke J, Görke B. 2008. Carbon catabolite
repression in Bacillus subtilis: quantitative analysis of repression exerted by different carbon sources. J Bacteriol 190:7275–7284.https://doi.org/ 10.1128/JB.00848-08.
15. Shen B, Hohmann S, Jensen RG, Bohnert AH. 1999. Roles of sugar alcohols in osmotic stress adaptation. Replacement of glycerol by man-nitol and sorbitol in yeast. Plant Physiol 121:45–52.https://doi.org/10 .1104/pp.121.1.45.
16. Mailloux RJ, Bériault R, Lemire J, Singh R, Chénier DR, Hamel RD, Ap-panna VD. 2007. The tricarboxylic acid cycle, an ancient metabolic network with a novel twist. PLoS One 2:e690.https://doi.org/10.1371/ journal.pone.0000690.
17. Kurth D, Belfiore C, Gorriti MF, Cortez N, Farias ME, Albarracin VH. 2015. Genomic and proteomic evidences unravel the UV-resistome of the poly-extremophile Acinetobacter sp. Ver3. Front Microbiol 6:328.https:// doi.org/10.3389/fmicb.2015.00328.
18. Tretter L, Adam-Vizi V. 2004. Generation of reactive oxygen species in the reaction catalyzed by␣-ketoglutarate dehydrogenase. J Neurosci 24:7771–7778.https://doi.org/10.1523/JNEUROSCI.1842-04.2004. 19. Quijano C, Trujillo M, Castro L, Trostchansky A. 2016. Interplay between
oxidant species and energy metabolism. Redox Biol 8:28 – 42.https://doi .org/10.1016/j.redox.2015.11.010.
20. Fujita Y, Matsuoka H, Hirooka K. 2007. Regulation of fatty acid metabo-lism in bacteria. Mol Microbiol 66:829 – 839. https://doi.org/10.1111/j .1365-2958.2007.05947.x.
21. Heelis PF. 1982. The photophysical and photochemical properties of flavins (isoalloxazines). Chem Soc Rev 11:15–39.https://doi.org/10.1039/ cs9821100015.
22. Wang H, Sivonen K, Fewer DP. 2015. Genomic insights into the distri-bution, genetic diversity and evolution of polyketide synthases and nonribosomal peptide synthetases. Curr Opin Genet Dev 35:79 – 85.
https://doi.org/10.1016/j.gde.2015.10.004.
23. Aleti G, Sessitsch A, Brader G. 2015. Genome mining: prediction of lipopeptides and polyketides from Bacillus and related Firmicutes. Com-put Struct Biotechnol J 13:192–203.https://doi.org/10.1016/j.csbj.2015 .03.003.
24. Hofemeister J, Conrad B, Adler B, Hofemeister B, Feesche J, Kucheryava N, Steinborn G, Franke P, Grammel N, Zwintscher A, Leenders F, Hitze-roth G, Vater J. 2004. Genetic analysis of the biosynthesis of non-ribosomal peptide- and polyketide-like antibiotics, iron uptake and bio-film formation by Bacillus subtilis A1/3. Mol Genet Genomics 272: 363–378.https://doi.org/10.1007/s00438-004-1056-y.
25. Haiko J, Westerlund-Wikström B. 2013. The role of the bacterial flagellum in adhesion and virulence. Biology (Basel) 2:1242–1267.https://doi.org/ 10.3390/biology2041242.
26. Stintzi A. 2003. Gene expression profile of Campylobacter jejuni in response to growth temperature variation. J Bacteriol 185:2009 –2016.
https://doi.org/10.1128/jb.185.6.2009-2016.2003.
27. Wilks JC, Kitko RD, Cleeton SH, Lee GE, Ugwu CS, Jones BD, BonDurant SS, Slonczewski JL. 2009. Acid and base stress and transcriptomic re-sponses in Bacillus subtilis. Appl Environ Microbiol 75:981–990.https:// doi.org/10.1128/AEM.01652-08.
28. Franchini AG, Egli T. 2006. Global gene expression in Escherichia coli K-12 during short-term and long-term adaptation to glucose-limited continuous culture conditions. Microbiology 152:2111–2127.https://doi .org/10.1099/mic.0.28939-0.
29. Vega-Cabrera LA, Guerrero A, Rodríguez-Mejía JL, Tabche ML, Wood CD, Gutiérrez-Rios R-M, Merino E, Pardo-López L. 2017. Analysis of Spo0M function in Bacillus subtilis. PLoS One 12:e0172737.https://doi.org/10 .1371/journal.pone.0172737.
30. Thompson LS, Beech PL, Real G, Henriques AO, Harry EJ. 2006. Require-ment for the cell division protein DivIB in polar cell division and engulf-ment during sporulation in Bacillus subtilis. J Bacteriol 188:7677–7685.
https://doi.org/10.1128/JB.01072-06.
31. Siegele DA. 2005. Universal stress proteins in Escherichia coli. J Bacteriol 187:6253– 6254.https://doi.org/10.1128/JB.187.18.6253-6254.2005. 32. Gustavsson N, Diez A, Nyström T. 2002. The universal stress protein
paralogues of Escherichia coli are ordinately regulated and co-operate in the defence against DNA damage. Mol Microbiol 43:107–117.
https://doi.org/10.1046/j.1365-2958.2002.02720.x.
33. Graumann P, Wendrich TM, Weber MH, Schröder K, Marahiel MA. 1997. A family of cold shock proteins in Bacillus subtilis is essential for cellular growth and for efficient protein synthesis at optimal and low tempera-tures. Mol Microbiol 25:741–756. https://doi.org/10.1046/j.1365-2958 .1997.5121878.x.
34. Kunitoshi Y, Li F, Masayori I. 1998. The CspA family in Escherichia coli: multiple gene duplication for stress adaptation. Mol Microbiol 27: 247–255.
35. Warawan E DH. 2008. The Bacillus subtilisM regulon and its contribu-tion to cell envelope stress responses. Mol Microbiol 67:830 – 848.
https://doi.org/10.1111/j.1365-2958.2007.06090.x.
36. Thackray PD, Moir A. 2003. SigM, an extracytoplasmic function sigma factor of Bacillus subtilis, is activated in response to cell wall antibiotics, ethanol, heat, acid, and superoxide stress. J Bacteriol 185:3491–3498.
https://doi.org/10.1128/jb.185.12.3491-3498.2003.
37. Lu Z, Min H, Xia Y. 2004. The response of Escherichia coli, Bacillus subtilis, and Burkholderia cepacia WZ1 to oxidative stress of exposure to quin-clorac. J Environ Sci Health B 39:431– 441.https://doi.org/10.1081/PFC -120035928.
38. Handtke S, Schroeter R, Jürgen B, Methling K, Schlüter R, Albrecht D, van Hijum S, Bongaerts J, Maurer K-H, Lalk M, Schweder T, Hecker M, Voigt B. 2014. Bacillus pumilus reveals a remarkably high resistance to hydro-gen peroxide provoked oxidative stress. PLoS One 9:e85625.https://doi .org/10.1371/journal.pone.0085625.
on September 8, 2020 by guest
http://msystems.asm.org/
39. Grove A. 2013. MarR family transcription factors. Curr Biol 23:R142–R143.
https://doi.org/10.1016/j.cub.2013.01.013.
40. Alekshun MN, Levy SB. 1999. The mar regulon: multiple resistance to antibiotics and other toxic chemicals. Trends Microbiol 7:410 – 413.
https://doi.org/10.1016/S0966-842X(99)01589-9.
41. Seoane AS, Levy SB. 1995. Characterization of MarR, the repressor of the multiple antibiotic resistance (mar) operon in Escherichia coli. J Bacteriol 177:3414 –3419.https://doi.org/10.1128/jb.177.12.3414-3419.1995. 42. Ariza RR, Cohen SP, Bachhawat N, Levy SB, Demple B. 1994. Repressor
mutations in the marRAB operon that activate oxidative stress genes and multiple antibiotic resistance in Escherichia coli. J Bacteriol 176: 143–148.https://doi.org/10.1128/jb.176.1.143-148.1994.
43. Fuangthong M, Atichartpongkul S, Mongkolsuk S, Helmann JD. 2001. OhrR is a repressor of ohrA, a key organic hydroperoxide resistance determinant in Bacillus subtilis. J Bacteriol 183:4134 – 4141.https://doi .org/10.1128/JB.183.14.4134-4141.2001.
44. Alekshun MN, Levy SB. 1997. Regulation of chromosomally mediated multiple antibiotic resistance: the mar regulon. Antimicrob Agents Che-mother 41:2067–2075.https://doi.org/10.1128/AAC.41.10.2067.
45. Guo MS, Gross CA. 2014. Stress-induced remodeling of the bacterial proteome. Curr Biol 24:R424 –R434.https://doi.org/10.1016/j.cub.2014 .03.023.
46. Romsdahl J, Blachowicz A, Chiang AJ, Singh N, Stajich JE, Kalkum M, Venkateswaran K, Wang CC. 2018. Characterization of Aspergillus niger isolated from the International Space Station. mSystems 3:e00112-18.
https://doi.org/10.1128/mSystems.00112-18.
47. Plubell DL, Wilmarth PA, Zhao Y, Fenton AM, Minnier J, Reddy AP, Klimek J, Yang X, David LL, Pamir N. 2017. Extended multiplexing of tandem mass tags (TMT) labeling reveals age and high fat diet specific proteome changes in mouse epididymal adipose tissue. Mol Cell Proteomics 16: 873– 890.https://doi.org/10.1074/mcp.M116.065524.
48. Robinson MD, Oshlack A. 2010. A scaling normalization method for differential expression analysis of RNA-seq data. Genome Biol 11:R25.
https://doi.org/10.1186/gb-2010-11-3-r25.
49. Vizcaino JA, Csordas A, del-Toro N, Dianes JA, Griss J, Lavidas I, Mayer G, Perez-Riverol Y, Reisinger F, Ternent T, Xu QW, Wang R, Hermjakob H. 2016. 2016 update of the PRIDE database and its related tools. Nucleic Acids Res 44:D447–D456.https://doi.org/10.1093/nar/gkv1145.