Remote Sensing and GIS for Hydrology and Water Resources (IAHS Publ. 368, 2015) (Proceedings RSHS14 and ICGRHWE14, Guangzhou, China, August 2014).
337
Estimation of long-term nutrient loadings into a hyper
eutrophic artificial lake in a lowland catchment, western Japan
YUTA SHIMIZU
1, SHIN-ICHI ONODERA
2, GUANGZHE JIN
2&
MITSUYO SAITO
31 JSPS Research Fellow, Western Region Agricultural Research Centre, National Agriculture and Food Research Organization, Fukuyama, Hiroshima Prefecture, 7218514, Japan
2 Graduate School of Integrated Arts and Sciences, Hiroshima University, Higashi Hiroshima, Hiroshima Prefecture 7398521, Japan
3 Graduate School of Environmental and Life Science, Okayama University, Okayama, Okayama Prefecture 7008530, Japan
Abstract Lake Kojima, an artificial lake located in the coastal area of western Japan, is categorized as a hyper eutrophic lake due to the nutrient inputs from the Sasagase River, Kurashiki River and Kamo River. The input nutrient loads from the rivers have never been assessed because there are no observation stations for runoff rate. The objective of this study is to confirm the total nitrogen (T-N) and total phosphorus (T-P) loads into Lake Kojima using the SWAT model for 60 years and considering changes in land use and the amount of domestic wastewater in the watersheds. Estimation results show that more than 90% of the total nutrient load comes from the Sasagase and Kurashiki rivers. The estimated T-N and T-P loads indicated two different trends in the rivers; an increasing trend is found during the period from 1950 to 1980, while a decreasing trend is found during the period from 1980 to 2009. It was suggested that the increasing trend was commonly caused by the combined effects of increase of the amount of domestic wastewater and agricultural wastewater in the watersheds, while the decreasing trend was caused by the expansion of domestic wastewater treatment and decrease of agricultural land use. The contribution ratio of domestic wastewater to the total amount of nutrient load was estimated to be 60% in Sasagase River and 15% in Kurashiki River because the treatment ratio of domestic wastewater in Kurashiki River was higher than in Sasagase River.
Key words nutrient load; eutrophic lake; long-term; SWAT model
INTRODUCTION
Lakes and reservoirs which are built near cities have suffered from water quality problems, such as eutrophication and harmful algal bloom, due to human activities such as wastewater discharge (Heisler et al., 2008). Hydrological models have been used to estimate nutrient loads from inflowing rivers for confirmation of lake dynamics or as support to decision makers for water management. Hydrological models have become powerful tools for cases which have scarce data or no monitoring data. Studies about estimating inflowing nutrient load to a lake using hydrological models have previously been done all over the world (e.g. Bulut and Aksoy, 2008; Huang et al., 2009). Although it is necessary to confirm the long-term nutrient load, because lake sediments hold historical nutrients which could affect lake water quality due to diffusion, most of the studies have made estimates for relatively short periods, around 10 years (e.g. Zhang et al., 2010). The few studies that have covered more than 30 years have space to improve regarding the effect of human activities such as changes in land use and population (e.g. Yu et al., 2007). The objective of this study is to confirm total nitrogen (T-N) and total phosphorus (T-P) loads into a hyper-eutrophic lake in western Japan using the SWAT model for 60 years and considering both changes in land use and the amount of domestic wastewater in the watersheds.
STUDY AREA
Lake Kojima, located in western Japan, has a catchment area of 504 km2. The lake has a water
capacity of 2.6 × 10⁷ m3 and an area of 10.8 km2, with a mean depth of 1.8 m. There are three
inflowing rivers (the Sasagase, Kurashiki and Kamo rivers) into Lake Kojima. Lake Kojima was formerly the inner part of the Kojima Bay and was isolated from the bay by dam construction in 1959 to store fresh water for irrigation to reclaimed agricultural lands. Water quality problems have occurred since the 1980s due to the increasing nutrient loading from the rivers. Although
nutrient sources have been regulated since 1984 by the law to reduce the phosphorus load so recovering the lake water quality, the lake still has been under hyper-eutrophic condition (Jin et al., 2013). Sasagase River catchment (283 km2) has mountainous area covered by forest in the
upstream, while rice paddy fields and residential area are dominant downstream. In contrast, Kurashiki River catchment (160 km2) is flat from the upstream to downstream. Residential area
dominates in the upstream while rice paddy field dominates the downstream of Kurashiki River catchment. Kamo River catchment (61 km2) has a mountainous area covered by forest in the
upstream while rice paddy field is dominant downstream. Residential area is distributed in the middle portion of Kamo River catchment. Land-use change from rice paddy field to residential area was found in the Sasagase River and Kurashiki River because the watersheds have relatively large populations. The soil types of the study area are categorized into Cambisols (45.5%), Gleysols (17.2%), Fluvic Gleysols (16.3%), Lithosols (12.7%), Acrisols and Luvisols (2.5%) and others (5.8%).
Fig. 1 Study area: (a) location of monitoring station, and (b) land-use change.
METHOD
Input data description
obtained from Nishio (2005). The amount of domestic wastewater was estimated using statistical population data for the period from 1947 to 2009, considering with expansion of the domestic wastewater treatment system.
Calibration and model validation
The calibration period for river runoff was set during the period from 2002 to 2006. Monthly river runoff was calibrated by the Sequential Uncertainty Fitting, version 2 (SUFI2) method using SWAT-CUP version 5.1.6. The Kanagawa gauging station, located north of the study area, was selected for calibration of river runoff because there are no gauging stations inside the area. Monthly river runoff data at Kanagawa gauging station were obtained from the Japan River Association. Concentrations of total nitrogen (TN), total phosphorus (TP), and suspended solids (SS) in the river water at the Sasagase-bashi, Bikuni-bashi, Irie-bashi, Kurashikigawa-bashi, and Tsunamori-bashi monitoring stations were obtained from the Measurement Results of Water Quality in Public Waters in Okayama Prefecture. The model was validated for the period from 2007 to 2009. The Nash-Sutcliffe index (NSE) (Nash and Sutcliffe, 1970), RMSE-observations standard deviation ratio (RSR), and percent bias (PBIAS) were used to evaluate the performance of the model. The performance of the model using the calibrated parameters, shown in Table1, was evaluated as an acceptable result according to Moriasi et al. (2007).
Table 1 Reproducibility of estimation by SWAT model
Calibration Validation
NSE RSR PBIAS NSE RSR PBIAS
Runoff 0.92 0.29 –17.3 0.87 0.33 –21.9
Sediment 0.61 0.59 25.1 0.52 0.63 34.5
Total Nitrogen 0.59 0.52 32.1 0.57 0.52 33.9
Total Phosphorus 0.58 0.54 33.7 0.52 0.58 37.6
RESULTS AND DISCUSSION
Annual runoff changes in inflowing rivers
Mean estimated annual runoff of Sasagase, Kurashiki and Kamo rivers were 6.61, 4.58 and 1.32 m3/s, respectively (Fig. 2). The contribution ratios of the inflowing water volumes of the Sasagase,
Kurashiki and Kamo rivers were 52.9 ± 3.2 %, 36.6 ± 3.0 % and 10.5 ± 0.2 %, respectively. Sasagase River has the largest water volume of the rivers. The results showed that there were no significant trends of increase or decrease during the period. However, the fluctuation of annual runoff may have increased in recent years. The fluctuation could be due to changing precipitation patterns near the study area which resulted from climate change (Onodera et al., 2007; Shimizu et al., 2011; Shimizu and Onodera, 2013).
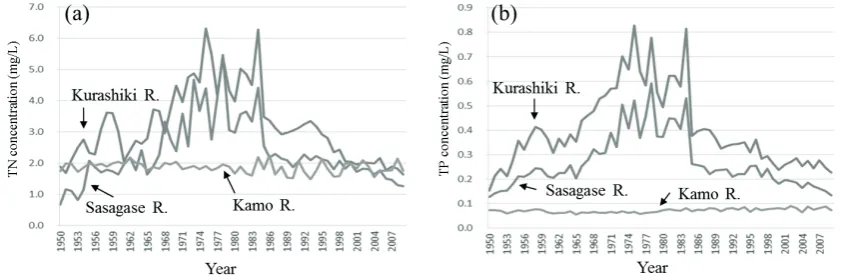
Trends in nutrient concentration of inflowing rivers
Fig. 2 Estimated annual mean runoff.
Fig. 3 Estimated annual mean concentrations of (a) TN and (b) TP.
Trends in nutrient load to the lake
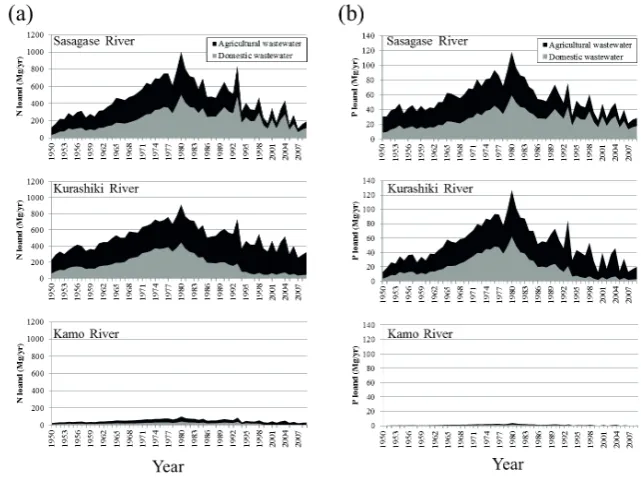
Estimates of T-N load during 1950 to 2009 for the Sasagase, Kurashiki and Kamo rivers were 462 ± 178, 455 ± 182 and 76 ± 16 Mg/year, respectively (Fig. 4(a)). The contribution ratios of T-N load into the lake were 46.6%, 45.8% and 7.6%, respectively. The estimated annual mean T-P loads were 54 ± 21, 57 ± 23 and 3 ± 1 Mg/year (Fig. 4(b)), and the contribution ratios were 47.5%, 50.0% and 2.6%, respectively. The Sasagase River and Kurashiki River were major nutrient sources to the lake. Even though the runoff rate of Kurashiki River was smaller than of the Sasagase River, both contribution ratios of the Kurashiki River were higher than Sasagase River. In addition, the specific T-N load of Sasagase, Kurashiki and Kamo rivers were 1.63, 2.84 and 1.25 Mg/km2/year, respectively. Furthermore, the specific T-P loads were 0.19, 0.36 and 0.05
Mg/km2/year, respectively.
Sasagase River catchment. In contrast, domestic wastewater treatment covers most of the catchments of the Kurashiki and Kamo rivers. In Sasagase River watershed, nutrients of domestic wastewater accounted for 60% of the annual total nutrient yield of the stream; nutrients of agricultural wastewater accounted for 40% of the annual total nutrients yield. The corresponding figures for the Kurashiki River watershed were 15% and 85%, respectively. The total loads of nitrogen and phosphorus from the Sasagase River and Kurashiki River in 2009 were approximately 60% and 15%, respectively. While domestic wastewater is higher than agricultural wastewater in Sasagase River, agricultural wastewater is higher than domestic wastewater in Kurashiki and Kamo River.
Fig. 4 Estimated nutrient loads from the rivers to the lake, (a) T-N and (b) T-P.
CONCLUDING REMARKS
The objective of this study was to confirm long-term nutrient load into a hyper eutrophic artificial lake using the SWAT model. Estimated loads of T-N and T-P from Sasagase River and Kurashiki River were major nutrient sources to the lake, and accounted more than 90% of the total load to the lake. The loads obviously indicate an increasing trend from 1950 to 1980 in the two rivers. The increase of nutrient load was caused by both of increases of domestic wastewater and agricultural wastewater in the catchments. Since the peak in 1980, the nutrient load has decreased due to expansion of domestic wastewater treatment and decrease of agricultural land use. In Sasagase River watershed, nutrients of domestic wastewater accounted for 60% of the annual total nutrients yield; nutrients of agricultural wastewater accounted for 40% of the annual total nutrients yield. In Kurashiki River watershed, the corresponding figures are 15% and 85%. Therefore, it is suggested that to improve lake water quality for the future, reduction of domestic wastewater input is important for Sasagase River, while reduction of agricultural wastewater is important for Kurashiki River. This study still has space for improvement in terms of accuracy and uncertainty. In future it will be necessary to compare these results with results from sediment core samples and also to couple the information with hydrodynamic models of the lake.
REFERENCES
Arnold, J., et al. (1998) Large area hydrologic modeling and assessment Part 1: Model development. J. Am. Water Resource
Association 34(1), 73–89.
Bulut, E. and Aksoy, A. (2008) Impact of fertilizer usage on phosphorus loads to Lake Uluabat. Desalination 226(1-3),
289–297.
Heisler, J., et al. (2008) Eutrophication and harmful algal blooms: A scientific consensus. Harmful Algae 8(1), 3–13.
Huang, Z., Xue, B. and Pang, Y. (2009) Simulation on stream flow and nutrient loadings in Gucheng Lake, Low Yangtze River
Basin, based on SWAT model. Quaternary International 208(1-2), 109–115.
Jin, G., et al. (2013) Effects of dam construction on sediment phosphorus variation in a semi-enclosed bay of the Seto Inland
Sea, Japan. Estuarine, Coastal and Shelf Science 135, 191–200.
Moriasi, D., et al. (2007) Model evaluation guidelines for systematic quantification of accuracy in watershed simulations.
Transactions of the ASABE 50(3), 885–900.
Nash, J. and Sutcliffe, J. (1970) River flow forecasting through conceptual models. Part I – A discussion of principles. Journal
of Hydrology 10(3), 282–290.
Nishio, M. (2005) Agriculture and Environmental Pollution. Tokyo: Rural Culture Association Japan.
Onodera, S., et al. (2007) Effect of frequent storms on nutrient discharge in a mountainous coastal catchment, western Japan.
IAHS Publication 314, 108–116.
Pai, N. and Saraswat, D. (2011) SWAT2009_LUC: a tool to activate land use change module in SWAT 2009. Transactions of
the ASABE 54(5), 1649–1658.
Shimizu, Y., Onodera, S. and Saito, M. (2011) Effect of climate change on nutrient discharge in a coastal area, western Japan.
In: Water Quality and Expected Climate Change Impacts (ed. by N.E. Peters et al.). IAHS Publ. 348, 172–177.
Shimizu, Y. and Onodera, S. (2013) Effect of climate change on flood events as a major driver of nutrient transport in western
Japan. In: Climate and Land Surface Changes in Hydrology (ed. by E. Boegh et al.). IAHS Publ. 359, 38–43.
Yu, G., et al. (2007) A 200-year historical modeling of catchment nutrient changes in Taihu basin, China. Hydrobiologia 581(1),
79–87.
Zhang, Q.-L., et al. (2010) Model AVSWAT apropos of simulating non-point source pollution in Taihu lake basin. Journal of