MAGNETIC RESONANCE
Separation of type and grade in cervical tumours using
non-mono-exponential models of diffusion-weighted MRI
Jessica M. Winfield1,2&Matthew R. Orton2&David J. Collins1,2&Thomas E. J. Ind3&
Ayoma Attygalle4&Steve Hazell4&Veronica A. Morgan1,2&Nandita M. deSouza1,2
Received: 19 January 2016 / Revised: 15 April 2016 / Accepted: 13 May 2016
#The Author(s) 2016. This article is published with open access at Springerlink.com
Abstract
ObjectivesAssessment of empirical diffusion-weighted MRI (DW-MRI) models in cervical tumours to investigate whether fitted parameters distinguish between types and grades of tumours.
Methods Forty-two patients (24 squamous cell carcinomas, 14 well/moderately differentiated, 10 poorly differentiated; 15 ad-enocarcinomas, 13 well/moderately differentiated, two poorly differentiated; three rare types) were imaged at 3 T using nine b-values (0 to 800 s mm-2). Mono-exponential, stretched expo-nential, kurtosis, statistical, and bi-exponential models were fitted. Model preference was assessed using Bayesian Information Criterion analysis. Differences in fitted parameters between tumour types/grades and correlation between fitted parameters were assessed using two-way analysis of variance and Pearson's linear correlation coefficient, respectively.
ResultsNon-mono-exponential models were preferred by 83 % of tumours with bi-exponential and stretched exponen-tial models preferred by the largest numbers of tumours. Apparent diffusion coefficient (ADC) and diffusion coeffi-cients from non-mono-exponential models were significantly
lower in poorly differentiated tumours than well/moderately differentiated tumours.α(stretched exponential), K (kurtosis),
fand D* (bi-exponential) were significantly different between tumour types. Strong correlation was observed between ADC and diffusion coefficients from other models.
Conclusions Non-mono-exponential models were preferred to the mono-exponential model in DW-MRI data from cervical tumours. Parameters of non-mono-exponential models showed significant differences between types and grades of tumours.
Key Points
•Non-mono-exponential DW-MRI models are preferred in the majority of cervical tumours.
• Poorly differentiated cervical tumours exhibit lower diffu-sion coefficients than well/moderately differentiated tumours.
• Non-mono-exponential model parametersα, K, f, and D* differ between tumour types.
•Micro-structural features are likely to affect parameters in non-mono-exponential models differently.
Keywords Diffusion-weighted magnetic resonance imaging .
Analysis, regression . Apparent diffusion coefficient . Intravoxel incoherent motion (IVIM) . Cervical cancer
Abbreviations
DW-MRI Diffusion-weighted magnetic resonance imaging ADC Apparent diffusion coefficient
EPI Echo-planar imaging FOV Field-of-view PE Phase encoding RL Right-left TE Echo time TR Repetition time
SPIR Spectral inversion recovery * Jessica M. Winfield
1 MRI Unit, The Royal Marsden NHS Foundation Trust, Downs Road,
Sutton, Surrey SM2 5PT, UK
2
Cancer Research UK Cancer Imaging Centre, Division of Radiotherapy and Imaging, The Institute of Cancer Research, 123 Old Brompton Road, London SW7 3RP, UK
3
Gynaecology Unit, The Royal Marsden NHS Foundation Trust, Fulham Road, London SW3 6JJ, UK
4 Department of Histopathology, The Royal Marsden NHS Foundation
NSA Number of signal averages ROI Region of interest
DDC Distributed diffusion coefficient IVIM Intravoxel incoherent motion BIC Bayesian information criterion ANOVA Analysis of variance
CV Coefficient of variation SNR Signal-to-noise ratio
Introduction
It is increasingly recognised that the observed diffusion-weighted magnetic resonance imaging (DW-MRI) signal attenuation in biological tissues is not completely de-scribed by a Gaussian process [1–5]. The use of non-mono-exponential models provides a better description of the DW-MRI signal, and parameters derived from these models allow more detailed investigation of differ-ences between tumour sub-types or inter-tumour hetero-geneity [6–11] and may also provide an earlier indication of response to treatment [12, 13]. However, use of a model with a large number of additional parameters risks over-fitting the data and may be sensitive to noise char-acteristics of the system rather than structural properties of the tumour or normal tissue. The potential for exploiting these parameters to describe tumour pheno-types remains substantial, but data relating them to the micro-structural properties of tumours or normal tissues is limited, particularly in body applications. Owing to the complexity of tissue and tumour micro-structure within a voxel [14], these models can at least be viewed as phe-nomenological descriptions of the data and in addition have demonstrable value as empirical markers of tissue status [15]. Nevertheless, their relationship to tissue micro-structural properties is an important topic of ongo-ing exploration [16,17].
In cervical cancer the lower apparent diffusion coeffi-cient (ADC) in tumours compared with non-tumour epi-thelium provides excellent tumour-to-normal-tissue con-trast and DW-MRI is routinely used in conjunction with T2-weighted imaging for tumour detection [18–20].
Previous studies have shown lower ADCs in poorly dif-ferentiated tumours than in well/moderately difdif-ferentiated tumours, but attempts to distinguish between squamous cell carcinoma and adenocarcinoma using ADC estimates have yielded mixed results [21, 22]. Use of a bi-exponential model has indicated a lower perfusion frac-tion (f) and diffusion coefficient (D) in cervical tumours than in normal cervix [23]. Assessment of the relation-ships between fitted parameters of DW-MRI models and tumour histopathology would establish the ability of a model to detect differences between grades and types of
tumour, and the potential to detect treatment effects that may not be described by the ADC derived from the mono-exponential model. The aims of this exploratory study, therefore, were to assess the performance of mono-exponential and non-mono-exponential models of the DW-MRI signal in cervical tumours and assess wheth-er fitted parametwheth-ers from these models can be used to distinguish between types and grades of tumours.
Materials and methods
PatientsForty-two consecutive patients with
histological-ly proven cervical tumours and tumour volume at least 50 mm3 visible on DW-MRI, recruited over two years (from May 2013 to May 2015), were included in this prospective single-centre study. The study was approved by a national research ethics committee. All patients gave their written consent to participate in this study. Tumours included 24 squamous cell carcinomas (14 well or mod-erately differentiated, 10 poorly differentiated), 15 adeno-carcinomas (13 well or moderately differentiated, two poorly differentiated), one clear cell carcinoma, one poor-ly differentiated carcinoma with focal squamous differen-tiation and for the large part neuroendocrine differentia-tion, and one high grade carcinoma that could not be sub-classified. The latter three tumours were included in the assessment of models, but excluded from the analysis of grades and types.
Imaging protocolEach patient underwent one MRI
exami-nation. Hyoscine butylbromide (20 mg) i.m. was adminis-tered before scanning to reduce image artefacts due to peri-stalsis. Patients were scanned on a Philips Achieva 3 T MR scanner using an endovaginal coil, as described previously, engineered for imaging at 3 T [24]. Following T2-weighted
and DW images acquired transversely, coronally, and sagitally through the cervix, a sequence with nine b-values between 0 s mm-2and 800 s mm-2was acquired coronally through the cervix for assessment of DW-MRI models. The protocol for this sequence was as follows: single-shot EPI; FOV = 100 mm x 100 mm; PE direction = RL; acquired ma-trix (read) = 80; reconstructed mama-trix (read) = 224; acquired pixel size = 1.25 mm x 1.25 mm; slice thickness = 2 mm; slice gap = 0.1 mm; 24 slices; TE = 52 ms; TR = 6500 ms; b = 0, 20, 40, 60, 80, 100, 300, 500, 800 s mm-2; Δ/
δ= 25.5/7.5 ms; SPIR fat suppression; NSA = 1 for b-values < 500 s mm-2; NSA = 2 for b-values≥500 s mm-2; total acquisition time = 7 min 9 s.
AnalysisRegions of interest (ROIs) were drawn on computed
slices on which the tumour appeared. The median tumour volume was 2.3 cm3(range 0.07 cm3to 40.8 cm3). Mono-exponential (Eq.1), stretched exponential (Eq.2), kurtosis (Eq.3), statistical (Eq.4), and bi-exponential (Eq.5) models were fitted to the data at each pixel using all nine b-values using least-squares fits (Matlab 2014a, MathWorks Inc., Natick, MA, USA).
These five models, recently applied in DW-MRI in body applications, were investigated. The mono-exponential model (Eq.1), is commonly applied in DW-MRI to estimate the ADC.
S
¼
S
0exp
ð
−
b
ADC
Þ
ð1ÞThe stretched exponential model (Eq.2) uses a distributed diffusion coefficient (DDC) andBstretching parameter^(α) to describe non-mono-exponential decay curves [2]. When fitting the stretched exponential model, the Bstretching parameter^,α, was constrained to lie between 0 and 1.
S
¼
S
0exp
ð
−
ð
b
DDC
Þ
αÞ
ð2ÞThe kurtosis model (Eq.3) uses the first two terms of a cumulate expansion to describe non-mono-exponential decay of a DW-MRI signal [4].
S
¼
S
0exp
−
b
D
Kþ
1
6
b
2
D
2KK
ð3Þ
The statistical model (Eq.4) describes the distribution of diffusion coefficients within a voxel using a truncated Gaussian distribution with mode Ds and scale parameter
σ, where Φ is the error function [3]. In this study, the fitted parameters Dsand σwere also reformulated to
ob-tain the mean (Ds') and standard deviation (σ') of the
distribution of diffusion coefficients within a voxel using results derived elsewhere for a truncated normal distribu-tion [26].
S¼S0
1þΦ Ds
σpffiffiffi2−
bσffiffiffi
2 p
1þΦ Ds
σpffiffiffi2
0 B B @
1 C C
Aexp −bDsþ 1 2b
2σ2
ð4Þ
The bi-exponential model (Eq.5), also called intravoxel incoherent motion (IVIM), describes a fast component of the DW-MRI signal (D*), associated with perfusion, and a slow component (D), associated with diffusion [1]. The term f in Eq. 5 describes the perfusion fraction. When fitting the bi-exponential model, starting values of D, f,
and D* were determined from a least-squares fit of a mono-exponential curve to the signal at the highest three b-values and another mono-exponential curve fitted to the remaining signal at the lower b-values; these starting
values were used for the least-squares fit of the bi-exponential curve to the data at all nine b-values.
S
¼
S
0f
exp
−
b
D
*þ
ð
1
−
f
Þ
exp
ð
−
b
D
Þ
ð5Þ
The diffusion coefficients from the non-mono-exponential models (DDC, DK, Ds, Ds', and D) may provide comparable
information to ADC. For all the above models the signal is expected to decrease with increasing b-value; therefore, any pixels where the signal increased between any pair of successive b-values were excluded from the analysis. Pixels with a fitted S0below a threshold value in
mono-exponential fits were also excluded; a threshold of 20 was chosen as this was the mean pixel value in background regions at the edges of the images far from the coil. The median number of pixels included in the analysis per tu-mour was 4411 (range 56 to 56,722). The median value of each fitted parameter, calculated for each tumour, was used for subsequent analysis in order to reduce sensitivity to outlier values. Statistical preference for the five models was quantified using the Bayesian information criterion (BIC), which penalises additional parameters in the models, as described in Eq.6 whereL(θ)is the value of the maximised likelihood objective function for a model with kparameters fit toNdata points [27].
BIC
¼
−
2log
L
ð Þ þ
θ
k
log
ð Þ
N
ð6ÞThe preferred model, defined as the model with the low-est (i.e. most negative) BIC, was determined for each pixel. The preferred model for each tumour was defined as the model preferred by the largest number of pixels in the tumour. Two-way analysis of variance (ANOVA, Matlab 2014a) was used to assess differences between types and grades of tumours for each of the fitted parameters. No correction for multiple comparisons was applied owing to the expected correlation between many of the fitted param-eters. Pearson's linear correlation coefficient (Matlab 2014a) was used to assess correlation between ADC and diffusion coefficients from non-mono-exponential models and to assess correlation between parameters within each non-mono-exponential model.
Tumour grade and type were determined from histopatho-logical analysis of post-surgery samples (n = 12) or pre-imaging cone biopsy data (n = 30), which samples a substan-tial (∼1 cm3) tumour volume.
Results
the ADC). Example curve fits from one pixel (Fig.1d) show clear non-mono-exponential signal attenuation with increas-ing b-value, which is better described by the non-mono-exponential models (dashed lines in Fig.1d) than the mono-exponential model (solid black line in Fig.1d).
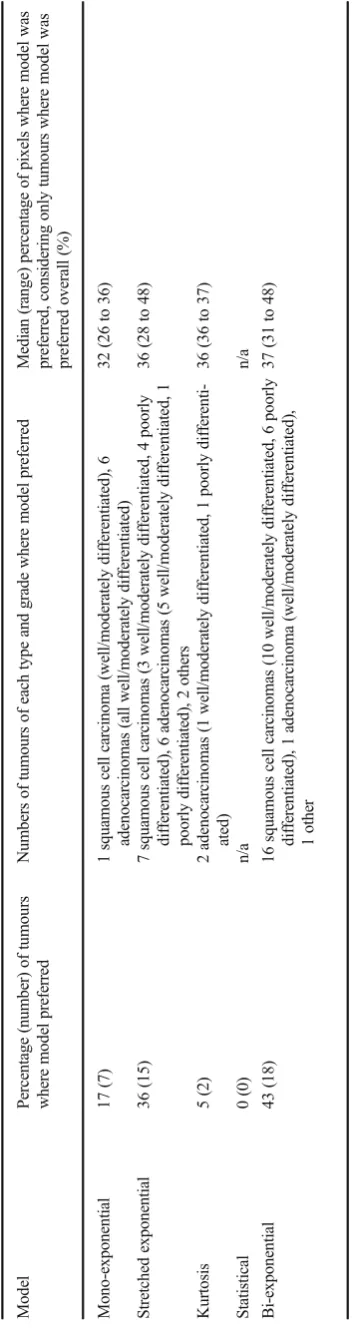
The percentages of tumours where BIC analysis indi-cated that the bi-exponential and stretched exponential models were preferred by the majority of pixels were 43 % and 36 %, respectively (Table 1). Overall, non-mono-exponential models were preferred by 83 % of tu-mours, with the mono-exponential model preferred by only 17 %. When looking at the number of tumours of each type and grade where each model was preferred, there is no clear preference of a particular type or grade for any of the models. When considering the tumours where each of the models was preferred, the percentage of pixels preferring that model ranged from 26 % to 48 %. This indicates a moderate preference for the dom-inant model, but also demonstrates that there are many pixels within each tumour that prefer models other than the dominant model.
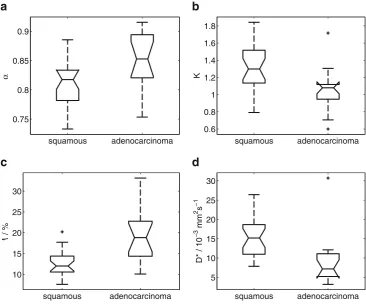
Results from ANOVA, summarised in Table2, showed that αfrom the stretched exponential model, K from the kurtosis model, and f and D* from the bi-exponential model were significantly different between types of tu-mour (squamous cell carcinoma versus adenocarcinoma) (Fig. 2). ADC from the mono-exponential model, DDC from the stretched exponential model, DK from the
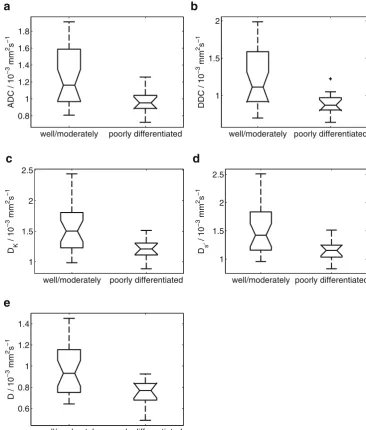
kur-tosis model, Ds'from the statistical model and D from the
bi-exponential model were significantly different between tumour grades (well/moderately differentiated versus poorly differentiated) (Fig. 3).
Assessment of correlation between ADC and other diffusion coefficients showed that DDC, DK, Ds' (mean),
and D were strongly correlated with ADC (Fig. 4, r > 0.9, p< 10-6 in all cases). Correlation between Ds
(mode) and ADC was less strong (r = 0.58, p= 0.0001). When assessing correlation of parameters within each model, no correlation was observed between α and DDC from the stretched exponential model, σ and Ds
from the statistical model, nor between either f and D or D* and D from the bi-exponential model (Table 3).
0 100 200 300 400 500 600 700 800
60 70 80 90 100 110 120 130 140 150
b / s mm−2
signal / arbitrary units
measured signal mono−exponential stretched exponential kurtosis
statistical bi−exponential
d
Fig. 1 aT2-weighted image,bdiffusion-weighted image (b = 800 s mm-2),cADC map from a well-differentiated squamous cell carcinoma.dMeasured
Weak correlation was observed between f and D* and between fD* and D from the bi-exponential model. Negative correlation was observed, however, between K and DK from the kurtosis model, and strong positive
correlation was observed between σ' and Ds' from the
reformulated statistical model.
Discussion
The preference for non-mono-exponential models in the majority of tumours indicates that these models provide a better description of the DW-MRI data in cervical tu-mours than a mono-exponential model. The absence of a clear preference for a particular model within each grade and type of tumour indicates that the models assessed here are applicable across all tumours and the choice of model is not driven purely by characteristics of a particular tumour grade or type. The preference for a non-mono-exponential model fit for the data from these tumours is consistent with results from other studies: a study in squamous cell carcinoma of the head and neck demonstrated that the kurtosis model provided a better fit to DW-MRI data than the mono-exponential model in primary tumours and in metastatic lymph nodes [7] and a study in advanced ovarian cancer demonstrated a pref-erence for the stretched exponential model over the mono-exponential model in the majority of primary and metastatic lesions in DW-MRI data both pre- and post-treatment [11]. Clinical studies comparing various models for DW-MRI data from prostate cancer have also demonstrated a better fit in malignant as well as benign regions using the bi-exponential model [6] or the kurtosis model [17] compared with the mono-exponential model. In contrast, a study in normal and malignant breast tissue found that DW-MRI data from approximately half of all voxels preferred a mono-exponential model while either a stretched exponential or bi-exponential model was pre-ferred in just under half of the voxels analysed [28]. It is, however, important to note that the mono-exponential model can be considered a special case of the other models applied here (using e.g. α= 1, K = 0, f= 0), as has been pointed out in previous studies [13], suggesting that tumours that prefer the mono-exponential model are not disadvantaged by the use of other models, although the additional parameters would be redundant if the mono-exponential model were preferred in all tumours. The stretched exponential, kurtosis, and statistical models describe the departure of the DW-MRI signal decay from mono-exponential behaviour, which may be due to intra-voxel heterogeneity or non-Gaussian diffu-sion processes, either of which may be related to the observed separation of types and grades of tumours.
The differences in fitted parameters between types or grades of tumours observed in this study indicate that these parameters are sensitive to micro-structural proper-ties of the tumours. In this study, tumour grade was reflected by the diffusion coefficients; this was the case whether considering simply ADC or the diffusion coeffi-cients from non-mono-exponential models (DDC, DK, Ds',
and D). ADC could, therefore, be considered sufficient to
describe tumour grade, but other parameters from the non-mono-exponential models (α, K, f, D*) provided further information that differentiated between tumour types. The use of non-mono-exponential models thus provides a more complete characterisation of the tumours than pro-vided by ADC alone. The lower ADC observed in poorly differentiated tumours compared with well/moderately differentiated tumours is in agreement with results of
Table 2 Assessment of differences in each fitted parameter between types and grades of tumour using two-way ANOVA. (s.d. standard deviation) *p< 0.05
Model Parameter p-value from ANOVA (type) p-value from ANOVA (grade)
Mono-exponential ADC 0.1 0.02 *
Stretched exponential DDC 0.1 0.02 *
α 0.01 * 0.7
Kurtosis DK 0.2 0.02 *
K 0.03 * 0.07
Statistical Ds(mode) 0.2 0.1
σ(scale parameter) 0.7 0.2
Ds'(mean) 0.2 0.02 *
σ' (s.d.) 0.5 0.07
Bi-exponential D 0.9 0.01 *
f 0.0003 * 0.9
D* 0.002 * 0.4
fD* 0.3 0.05
squamous adenocarcinoma 0.75
0.8 0.85 0.9
a
α
squamous adenocarcinoma 0.6
0.8 1 1.2 1.4 1.6 1.8
b
K
squamous adenocarcinoma 10
15 20 25 30
c
f
/ %
squamous adenocarcinoma 5
10 15 20 25 30
d
D* / 10
−3
mm
2 s
−1
previous studies [21,22]. Diffusion coefficients from non-mono-exponential models (DDC, DK, Ds', and D) showed
similar results to ADC, with lower estimates in poorly differentiated tumours compared with well/moderately differentiated tumours. These results, together with the strong correlation between ADC and these other diffusion coefficients, indicate that these parameters provide similar information to ADC. The parameter Dsfrom the statistical
model was an exception to this behaviour, exhibiting only weak correlation with ADC and no significant difference between tumour grades. Median estimates of Dsincluded
many values close to zero, as described in other studies [29]. After reformulating Dsto Ds', however, a significant
difference between tumour grades was observed, and the median estimates matched ADC estimates more closely. It
is notable that ADC and other diffusion coefficients dif-ferentiated grades of tumours where the major histological feature is increasing cell density and mitoses with increas-ing grade but that other parameters best differentiated squamous cell carcinoma and adenocarcinoma where structural features are more profound and rely on cell or-ganisation and glandular architecture rather than cell den-sity alone. Unfortunately, only two poorly differentiated adenocarcinomas were present in this cohort of patients due to the lower numbers of adenocarcinomas compared with squamous cell carcinomas in cancers of the uterine cervix [30].
Considering correlation of parameters within models, the absence of correlation betweenαand DDC from the stretched exponential model,σand Dsfrom the statistical model, and
well/moderately poorly differentiated 0.8
1 1.2 1.4 1.6 1.8
a
ADC / 10
−3
mm
2 s
−1
well/moderately poorly differentiated 1
1.5 2
b
DDC / 10
−3
mm
2 s
−1
well/moderately poorly differentiated 1
1.5 2 2.5
c
D K
/ 10
−3
mm
2 s
−1
well/moderately poorly differentiated 1
1.5 2 2.5
d
D s
′
/ 10
−3
mm
2 s
−1
well/moderately poorly differentiated 0.6
0.8 1 1.2 1.4
e
D / 10
−3
mm
2 s
−1
Fig. 3 Differences between grades of tumour
(well/moderately differentiated (n = 27) versus poorly
differentiated (n = 12)) inaADC from the mono-exponential model,bDDC from the stretched exponential model,cDKfrom the
kurtosis model,dDs'from the
eitherf and D or D* and D from the bi-exponential model indicates that these parameters provide complementary infor-mation and may be sensitive to different aspects of the tumour micro-structure. The strong correlation observed betweenσ' and Ds'from the reformulated statistical model, however,
in-dicates that the additional parameterσ' may not provide addi-tional information. The correlation between K and DKfrom
the kurtosis model indicates that these parameters also provide largely the same information, but in this case the additional parameter does provide some additional information as K and DK were sensitive to different properties (type and grade,
respectively).
Repeatability of fitted parameters is an important consid-eration in model selection. It was not possible to carry out repeated examinations on the patients in this study owing to the invasive nature of the MRI examination using an endovaginal receiver coil and it was, therefore, not possible to assess the test-retest repeatability of the parameter esti-mates. However, the repeatability of fitted parameters of the bi-exponential and stretched exponential models, which were preferred by largest numbers of tumours in this study, have been investigated in several previous studies that use similar DW-MRI protocols to the one used here [9,11,13, 31]. The parameters of the stretched exponential model have been shown to have very good repeatability (coeffi-cient of variation (CV)∼4 to 7 %), comparable to the re-peatability of ADC estimates [9,11,13], while the repeat-ability of parameters from the bi-exponential model, partic-ularlyfand D* are significantly worse (CV > 20 %) [9,11, 13,31]. Whilst the ANOVAp-values indicate thatfand D* show greater significance thanαand K when making group comparisons between tumour type, the poorer repeatability offand D* suggest thatαand K may be more appropriate for differentiating tumour types in individuals.
An apparent limitation of this study is the use of a max-imum b-value of 800 s mm-2 when applying models that were originally developed over much wider ranges of b-values [4,5]. A maximum b-value of 800 s mm-2is, how-ever, typical of DW-MRI protocols in body applications where higher b-values increase the minimum TE attainable, thus lowering signal-to-noise ratio (SNR), and increase im-age distortion due to eddy current effects. The lack of b-values over 1000 s mm-2 would be a severe limitation in investigations of intra- and extra-cellular compartments in the brain, where some of the models investigated here were originally developed [4,5]. In this study, however, the modelling process was a phenomenological investigation in order to assess the best description of the data and the
0
1
2
3
a
DDC / 10
−3
mm
2
s
−1
r=1.00, p<10
−60
1
2
3
b
D
K/ 10
−3
mm
2
s
−1
r=0.99, p<10
−60
1
2
3
c
D
s/ 10
−3
mm
2
s
−1
r=0.58, p=0.0001
0
1
2
3
d
D
s′
/ 10
−3
mm
2
s
−1
r=0.99, p<10
−60.5
1
1.5
2
0
1
2
3
e
ADC / 10
−3mm
2s
−1D / 10
−3
mm
2
s
−1
r=0.91, p<10
−6
Fig. 4 Correlation between ADC andaDDC from the stretched exponential model,bDKfrom the kurtosis model, cDsfrom thestatistical model,dDs'from the statistical model, andeD from the
original theoretical formulations were not implied. Also, although grading of tumours was carried out on cone biopsy in 30/42 cases, this represented a significant volume of tu-mour and mitigates against variations in tutu-mour grade on needle biopsy.
In conclusion, non-mono-exponential models were pre-ferred to the mono-exponential model in DW-MRI data from cervical tumours. ADC and the diffusion coefficients from other models were significantly different between grades of tumours, but showed no differences between tumour types, whileαfrom the stretched exponential model, K from the kurtosis model, andfand D* from the bi-exponential model were significantly different between squamous cell carcino-mas and adenocarcinocarcino-mas. These results show that parameters from non-mono-exponential models are related to different aspects of tumour microstructure. Parameters from non-mono-exponential models may, therefore, have utility in prob-ing features of tumour phenotype, which may be indicative of poor prognosis or progressive disease. Of the models tested, the stretched exponential model exhibited uncorrelated pa-rameters, which were related to histological features and is, therefore, likely to be most relevant for clinical use.
Acknowledgments The scientific guarantor of this publication is Professor Nandita deSouza, Professor of Translational Imaging, MRI Unit, Institute of Cancer Research and Royal Marsden Hospital, Downs Road, Sutton, Surrey. SM2 5PT. UK. The authors of this manuscript declare no relationships with any companies, whose products or services may be related to the subject matter of the article. This study has received funding by CRUK and EPSRC support to the Cancer Imaging Centre at ICR and RMH in association with MRC and Department of Health C1060/A10334, C1060/A16464 and NHS funding to the NIHR Biomedical Research Centre and the Clinical Research Facility in Imaging. No complex statistical methods were necessary for this paper. Institutional Review Board approval was obtained. Written informed con-sent was obtained from all subjects (patients) in this study. Methodology: prospective, observational, performed at one institution.
Open AccessThis article is distributed under the terms of the Creative C o m m o n s A t t r i b u t i o n 4 . 0 I n t e r n a t i o n a l L i c e n s e ( h t t p : / / creativecommons.org/licenses/by/4.0/), which permits unrestricted use, distribution, and reproduction in any medium, provided you give appro-priate credit to the original author(s) and the source, provide a link to the Creative Commons license, and indicate if changes were made.
References
1. Le Bihan D, Breton E, Lallemand D, Aubin M-L, Vignaud J, Laval-Jeantet M (1988) Separation of diffusion and perfusion in intravoxel incoherent motion MR imaging. Radiology 168:497–505 2. Bennett KM, Schmainda KM, Bennett (Tong) R, Rowe DB, Lu H,
Hyde JS (2003) Characterization of continuously distributed corti-cal water diffusion rates with a stretched-exponential model. Magn Reson Med 50:727–734
3. Yablonskiy DA, Bretthorst GL, Ackerman JJH (2003) Statistical model for diffusion attenuated MR signal. Magn Reson Med 50: 664–669
4. Jensen JH, Helpern JA, Ramani A, Lu H, Kaczynski K (2005) Diffusional kurtosis imaging: the quantification of non-gaussian water diffusion by means of magnetic resonance imaging. Magn Reson Med 53:1432–1440
5. Kiselev VG, Il'yasov KA (2007) Is theBbiexponential diffusion^ biexponential? Magn Reson Med 57:464–469
6. Riches SF, Hawtin K, Charles-Edwards EM, deSouza NM (2008) Diffusion-weighted imaging of the prostate and rectal wall: com-parison of biexponential and monoexponential modelled diffusion and associated perfusion coefficients. NMR Biomed 22:318–325 7. Jansen JFA, Stambuk HE, Koutcher JA, Shukla-Dave A (2010)
Non-gaussian analysis of diffusion-weighted MR imaging in head and neck squamous cell carcinoma: a feasibility study. AJNR Am J Neuroradiol 31:741–748
8. Rosenkrantz AB, Sigmund EE, Johnson G et al (2012) Prostate cancer: feasibility and preliminary experience of a diffusional kur-tosis model for detection and assessment of aggressiveness of pe-ripheral zone cancer. Radiology 264:126–135
9. Mazaheri Y, Afaq A, Rowe DB, Lu Y, Shulka-Dave A, Grover J (2012) Diffusion-weighted magnetic resonance imaging of the prostate: improved robustness with stretched exponential modeling. J Comput Assist Tomogr 36:695–703
10. Bourne RM, Panagiotaki E, Bongers A, Sved P, Watson G, Alexander DC (2014) Information theoretic ranking of four models of diffusion attenuation in fresh and fixed prostate tissue ex vivo. Magn Reson Med 72:1418–1426
11. Winfield JM, deSouza NM, Priest AN et al (2015) Modelling DW-MRI data from primary and metastatic ovarian tumours. Eur Radiol 25:2033–2040
12. Hauser T, Essig M, Jensen A et al (2013) Characterization and ther-apy monitoring of head and neck carcinomas using diffusion-imaging-based intravoxel incoherent motion parameters - preliminary results. Neuroradiology 55:527–536
13. Orton MR, Messiou C, Collins D et al (2015) Diffusion-weighted MR imaging of metastatic abdominal and pelvic tumours is sensitive to early changes induced by a VEGF inhibitor using alternative diffusion attenuation models. Eur Radiol. doi:10.1007/s00330-015-3933-7
Table 3 Correlation between fitted parameters within each non-mono-exponential model
Model Parameters Pearson's correlation coefficient (r) p-value
Stretched exponential DDC,α 0.14 0.4
Kurtosis DK, K -0.72 <10-6*
Statistical Ds(mode),σ(scale parameter) -0.13 0.4
Ds'(mean),σ' (s.d.) 0.91 <10-6*
Bi-exponential D,f 0.28 0.08
D, D* 0.18 0.2
D*,f -0.37 0.02 *
D,fD* 0.64 5x10-6*
14. Norris DG (2001) The effects of microscopic tissue parameters on the diffusion weighted magnetic resonance imaging experiment. NMR Biomed 14:77–93
15. Yablonskiy DA, Sukstanskii AL (2010) Theoretical models of the diffusion weighted MR signal. NMR Biomed 23:661–681 16. Koh D-M, Collins DJ, Orton MR (2011) Intravoxel incoherent
motion in body diffusion-weighted MRI: reality and challenges. AJR Am J Roentgenol 196:1351–1361
17. Rosenkrantz AB, Padhani AR, Chenevert TL et al (2015) Body dif-fusion kurtosis imaging: basic principles, applications, and consider-ations for clinical practice. J Magn Reson Imaging 42:1190–1202 18. Charles-Edwards EM, Messiou C, Morgan VA et al (2008)
Diffusion-weighted imaging in cervical cancer with an endovaginal technique: potential value for improving tumor detection in stage Ia and Ib1 disease. Radiology 249:541–550
19. Downey K, Jafar M, Attygalle AD et al (2013) Influencing surgical management in patients with carcinoma of the cervix using a T2-and ZOOM-diffusion-weighted endovaginal MRI technique. Br J Cancer 109:615–622
20. Downey K, Attygalle AD, Morgan VA et al (2015) Comparison of optimised endovaginal vs external array coil T2-weighted and diffusion-weighted imaging techniques for detecting suspected early stage (IA/IB1) uterine cervical cancer. Eur Radiol. doi:10.1007/s00330-015-3899-5
21. Payne GS, Schmidt M, Morgan VA et al (2010) Evaluation of magnetic resonance diffusion and spectroscopy measurements as predictive biomarkers in stage 1 cervical cancer. Gynecol Oncol 116:246–252
22. Kuang F, Ren J, Zhong Q, Liyuan F, Huan Y, Chen Z (2013) The value of apparent diffusion coefficient in the assessment of cervical cancer. Eur Radiol 23:1050–1058
23. Lee EPL, Yu X, Chu MYC et al (2014) Perfusion and diffusion characteristics of cervical cancer based on intravoxel incoherent motion MR imaging–a pilot study. Eur Radiol 24:1506–1513 24. deSouza NM, Scoones D, Krausz T, Gilderdale DJ, Soutter WP
(1996) High resolution MR imaging of stage 1 cervical neoplasia with a dedicated transvaginal coil: MR features and correlation of imaging and pathologic findings. AJR Am J Roentgenol 166:553–559 25. Blackledge M, Leach M, Collins D, Koh D-M (2011) Computed
diffusion-weighted MR imaging may improve tumour detection. Radiology 261:573–581
26. Barr DR, Sherrill ET (1999) Mean and variance of truncated normal distributions. Am Stat 53:357–361
27. Schwarz G (1978) Estimating the dimension of a model. Ann Stat 6:461–464
28. Panek R, Borri M, Orton M et al (2015) Evaluation of diffusion models in breast cancer. Med Phys 42:4833–4839
29. Yuan J, Yeung DKW, Mok GSP et al (2014) Non-Gaussian analysis of diffusion weighted imaging in head and neck at 3T: a pilot study in patients with nasopharyngeal carcinoma. PLoS ONE 9, e87024 30. Waggoner SE (2003) Cervical cancer. Lancet 361:2217–2225 31. Andreou A, Koh DM, Collins DJ et al (2013) Measurement