Trade liberalization and informality
in Argentina: exploring the adjustment
mechanisms
Guillermo Cruces
1,2,3†, Guido Porto
4*†and Mariana Viollaz
1†1 Introduction
Economic theory indicates that trade liberalization should lead to a reallocation of fac-tors from protected to comparative advantage secfac-tors, but the empirical evidence for developing countries often unveils more complex dynamic responses (Wacziarg and Wallack 2004; Menezes-Filho and Muendler 2011; Dix-Carneiro and Kovak 2015). In the literature, this is typically explained by limited factor mobility caused by realloca-tion costs (Atolia 2007; Artuc et al. 2010; Dix-Carneiro 2014). In this paper, we focus instead on labor informality as an additional trade adjustment mechanism. Informality is a relevant margin of adjustment for labor demand and labor supply in developing coun-tries and this margin of adjustment can be affected by trade reforms (Currie and Har-rison 1997; Goldberg and Pavcnik 2003; Levy 2008; Galiani and Weinschelbaum 2011; Dix-Carneiro and Kovak 2017). We build on this literature to explore how trade reforms
Abstract
This paper studies the link between trade reforms and labor informality in Argentina using a long time series spanning the 1980–2001 period. We explore cross-section mechanisms, that operate at the industry level, and time-series mechanisms, that operate at a general equilibrium level. We argue that firms can substitute formal with informal workers to smooth a negative trade shock. In this setting, industries exposed to larger tariffs cuts could experience increases in informality. In general equilibrium, there can be additional aggregate impacts in both manufacturing and non-traded sectors through workers reallocation among sectors, wage adjustments, and firm entry and exit. Using the cross-section variation of the data and an instrumental variable strategy we explore empirically the cross-section mechanisms. We find that reductions in industry tariffs increase labor informality, and the effect is differentially stronger in industries with a larger share of small-size firms. Using the time-series variation of the data, we are able to identify some of the general equilibrium effects. We find that the fall in the average national tariff decreased aggregate informality in the manufacturing sector but increased it in the non-traded sector.
Keywords: Trade liberalization, Labor informality, Cross-section mechanisms, Time-series mechanisms, Argentina
JEL Classification: F13, F14
Open Access
© The Author(s) 2018. This article is distributed under the terms of the Creative Commons Attribution 4.0 International License
(http://creat iveco mmons .org/licen ses/by/4.0/), which permits unrestricted use, distribution, and reproduction in any medium,
provided you give appropriate credit to the original author(s) and the source, provide a link to the Creative Commons license, and indicate if changes were made.
RESEARCH
*Correspondence: [email protected]. unlp.edu.ar
†Guillermo Cruces, Guido Porto and Mariana Viollaz contributed equally 4 Departamento de Economía, Universidad Nacional de La Plata (UNLP), Argentina, Calle 6 e/ 47 y 48, Piso 3, Oficina 322, La Plata, Provincia de Buenos Aires, Argentina
affect labor informality and to identify various partial and general equilibrium mecha-nisms. Following Galiani and Porto (2010), we exploit a long time series of trade reforms and informality for Argentina.
In the trade literature, firms respond to tariffs cuts by reducing wages and by firing workers who reallocate to comparative advantage sectors. In turn, if informal workers are “cheaper” than formal workers, because of various taxes associated with formality, firms can increase the fraction of informal workers as an adjustment mechanism. Thus, increasing tax evasion could be a strategy to smooth the negative trade shock. In this setting, industries exposed to larger tariff cuts could experience increases in informality. In general equilibrium, there can be additional aggregate impacts in both manufactur-ing and non-traded sectors. These additional impacts are explained by the usual trade adjustment mechanisms of workers reallocation among sectors, wage adjustments, and firm entry and exit. For instance, as workers reallocate out of an industry, they can get absorbed into the non-traded sector. To the extent that these workers are employed informally, tariff cuts can be associated with higher informality in the non-traded sec-tor. However, if, for tax evasion reasons, exposed industries fire formal workers in higher proportion relative to informal workers, formal wages may decline with respect to infor-mal wages. Forinfor-mal workers may become cheaper and inforinfor-mality may decline, both in manufactures and in non-traded sectors. Further, the loss of tariff protection can induce firms to exit the market. As more efficient firms stay, provided they are likely to be more formal than smaller exiting firms, informality can decline as well through this channel. In the literature, it has been often difficult to disentangle these different mechanisms.
In this paper, we study these mechanisms in Argentina using a long time series of tar-iffs and individual workers spanning the 1980–2001 period (Galiani and Porto 2010). During this period, Argentina experienced a sizeable increase in overall labor informality and important trade policy changes, leading to substantial time-series and inter-industry variation in tariffs for the manufacturing sector. Using the cross-section variation in the data, we explore the partial equilibrium mechanisms. We find that trade liberalization, measured as cross-industry reductions in tariffs, raised labor informality at the indus-try level. Additionally, the magnitude of this effect depends on the size of the firms in each industry. When small firms prevail, we find evidence that firms substitute informal workers for formal workers, but this effect fades away as average firm size within indus-tries increases. This can be explained by less efficient tax evasion controls for smaller firms. Using the time-series variation of the data, we are able to identify some of the general equilibrium effects of trade reforms. We find that, conditional on the structure of sectoral protection, the fall in the average national tariff decreased aggregate infor-mality in the manufacturing sector but increased it in the non-traded sector. This result can be rationalized with an outflow of workers from manufacturing, a resulting wage adjustment that makes formality cheaper, and the exit of small firms because of foreign competition. In the non-traded sector, the evidence suggests that the inflow of displaced manufacturing workers finds mostly informal jobs.
contrast, Acosta and Montes-Rojas (2014) report an increase in labor informality in Argentina and Arias et al. (2013) and Dix-Carneiro and Kovak (2017) a similar effect following liberalization for Brazil and Mexico in the first case, and only for Brazil in the second case. Alemán-Castilla (2006), on the other hand, predicts a decrease in informal-ity in Mexico. We argue that these heterogeneous results could be confounded by the different time spans of these studies, and by the different mechanisms uncovered by our analysis.
In fact, while the literature on trade and informality emphasizes different mechanisms to interpret the different empirical results, there is no study recognizing and estimating partial equilibrium mechanisms as a deviation from general equilibrium trends. Gold-berg and Pavcnik (2003) focus on labor costs reductions due to increased foreign com-petition. Alemán-Castilla (2006) maintains that the reallocation of market shares and profits from the least productive to the most productive firms impacts negatively on the employment share of the informal sector. Similarly, Paz (2014) expects a reallocation of market shares between firms producing domestically and firms that export, which may impact on the share of informal workers. Bosch et al. (2012) and Acosta and Montes-Rojas (2014) investigate the greater access to imported capital goods that may increase productivity as a mechanism affecting the share of informal workers. Arias et al. (2013) highlight the increase in the opportunity cost of inactive individuals who could enter the labor force in informal or formal jobs depending on the entry costs. Finally, Dix-Carneiro and Kovak (2015) focus on the imperfect and slow factor adjustment associ-ated with a trade liberalization episode. In their model, workers from the regions with larger tariff reductions spend less time in formal employment and transition mainly into the non-tradable sector, while workers from the non-tradable sector move slowly into informal employment.
The remainder of the paper is organized as follows. In Sect. 2, we describe the rela-tionship between trade reforms and labor informality in Argentina through simple cor-relations, and we identify some of the mechanisms through which this relationship may operate. Section 3 presents our empirical strategy and the regression analysis to identify the effect of trade reforms on informality levels. Finally, Sect. 4 concludes.
2 Trade reforms and informality: adjustment mechanisms
market data from the EPH allows us to work with a long time series of 33 surveys span-ning the 1980–2001 period.1
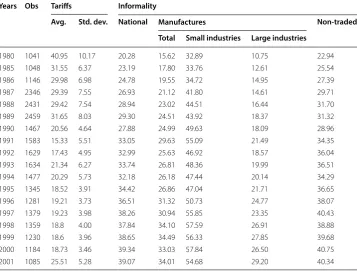
Table 1 reports yearly sample sizes (wage employees in the manufacturing sector) from EPH surveys, the average tariff and its standard deviation, and the average labor informality rate for manufactures, the non-tradable sector and the aggregate economy.2
We adopt the social protection-tax evasion definition of informality, which refers to the nature of the labor relationship between employer and employee rather than to charac-teristics of the worker or the firm (for instance, productivity). We classify a worker as informal if the firm does not pay the statutory payroll taxes and social insurance contri-butions based on his or her salary, which implies that the worker is not registered with the tax and social insurance administrations (we refer interchangeably to informal or unregistered workers). This implies that the worker does not receive the bundle of social insurance benefits financed by the State—basically, health insurance and the right to a
Table 1 Tariffs and Informality. Source: Own elaboration based on EPH and Galiani and Porto (2010)
Number of observations correspond to wage employees in the manufacturing sector. Average tariff weighted by the employment level in each industry. The informality rate does not include the public sector, agricultural and mining sectors. To split industries into small and large, we use information from the EPH about the size of the firm where each worker is employed. This information is categorical in the survey, the categories being 1 = 1 employee, 2 = 2 to 5, 3 = 5 to 15; 4 = 16 to 25; 5 = 26 to 50; 6 = 51 to 100; 7 = 101 to 500; 8 = 501 or more. We classify a firm as small when the size is 15 workers or less. We then define an industry as small when the share of workers employed in small firms is 0.5 or larger
Years Obs Tariffs Informality
Avg. Std. dev. National Manufactures Non-traded
Total Small industries Large industries
1980 1041 40.95 10.17 20.28 15.62 32.89 10.75 22.94
1985 1048 31.55 6.37 23.19 17.80 33.76 12.61 25.54
1986 1146 29.98 6.98 24.78 19.55 34.72 14.95 27.39
1987 2346 29.39 7.55 26.93 21.12 41.80 14.61 29.71
1988 2431 29.42 7.54 28.94 23.02 44.51 16.44 31.70
1989 2459 31.65 8.03 29.30 24.51 43.92 18.37 31.32
1990 1467 20.56 4.64 27.88 24.99 49.63 18.09 28.96
1991 1583 15.33 5.51 33.05 29.63 55.09 21.49 34.35
1992 1629 17.43 4.95 32.99 25.63 46.92 18.57 36.04
1993 1634 21.34 6.27 33.74 26.81 48.36 19.99 36.51
1994 1477 20.29 5.73 32.18 26.18 47.44 20.14 34.29
1995 1345 18.52 3.91 34.42 26.86 47.04 21.71 36.65
1996 1281 19.21 3.73 36.51 31.32 50.73 24.77 38.07
1997 1379 19.23 3.98 38.26 30.94 55.85 23.35 40.43
1998 1359 18.8 4.00 37.84 34.10 57.59 26.91 38.88
1999 1230 18.6 3.96 38.65 34.49 56.33 27.85 39.68
2000 1184 18.73 3.46 39.34 33.03 57.84 26.50 40.75
2001 1085 25.51 5.28 39.07 34.01 54.68 29.20 40.34
1 We work with the October wave of the EPH in years 1980, 1985 and 1986, and with the May and October waves from
1987 to 2001.
contributory old age employment-linked pension. This does not necessarily imply that labor informality is solely a unilateral decision of the worker or the firm. It can be an out-come from a bargaining process on employment characteristics, with associated costs (taxes and contributions for the firm, which potentially translate into lower wages for workers) and benefits (the social insurance package) (Galiani and Weinschelbaum 2011). There is a margin of adjustment because workers can have heterogeneous preferences in their valuation of these benefits, and firms can also face different costs associated, for instance, to their size through the enforcement of these labor market regulations (Kleven et al. 2009). The labor informality rate at the industry or aggregate level is simply the proportion of employees working in these conditions.
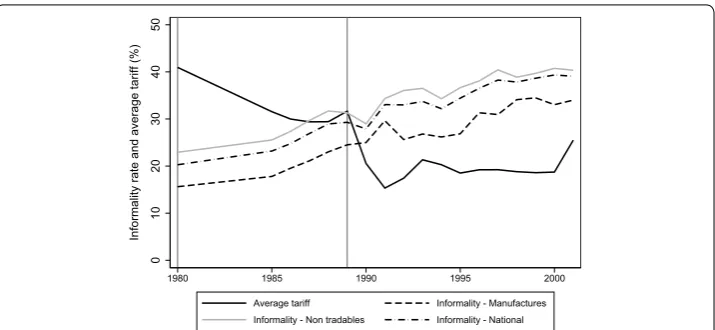
The simple descriptive statistics in Table 1 uncover the basic correlation that we study in this paper: while the average tariff fell 35 percent between 1980 and 2001, the average level of informality increased by 93 percent over the same period. We further explore this correlation in Fig. 1. During this period, there are two very noticeable episodes of tariff cuts. Protection was highest in 1980, with an average tariff of around 40 percent (with protection in some industries reaching 55 percent). The average tariff was cut by 10 percentage points between 1985 and 1989 and, in fact, the entire distribution of industry tariffs moved downward (the 75th percentile was, in general, below the 25th percentile of the first 2 years).3 After 1990, Argentina implemented a broad program of
trade liberalization that included unilateral tariff reductions and the adoption of Mer-cosur, a regional trade agreement with neighboring countries Brazil, Paraguay and Uru-guay in 1991. During this period, the mean tariff fell 10 additional percentage points, while tariff dispersion also declined.
The informality rate in manufactures, by contrast, exhibited an upward trend over time, more than doubling between 1980 and 2001. The greatest increase occurred in the 1980s, and it grew at a slower pace during the 1990s. The informality rate tempo-rarily dropped from 1991 to 1994, a period of stabilization and growth following the
0
10
20
30
40
50
Informality rate and average tariff (%
)
1980 1985 1990 1995 2000
Average tariff Informality - Manufactures
Informality - Non tradables Informality - National
Fig. 1 Tariff reforms and informality (Source: Own elaboration based on EPH and Galiani and Porto (2010))
hyperinflation episode of 1989–1991. In 1994, the most significant year in terms of labor and other market-oriented structural reforms in the economy, the informality rate returned to its increasing trend reaching peaks of 31 percent (in 1996) and 35 percent (in 1999). Within manufactures, informality was higher in small industries relative to large industries, with both showing increasing trends.4 Finally, note that the informality
rate in the non-traded sector was higher than in the manufacturing sector, with a similar increasing trend over the period.
In the trade literature, firms typically respond to tariff cuts by reducing wages and by firing workers. An additional adjustment mechanism that we highlight in this paper is that firms may find it optimal to change the composition of their employment structure, with less formal jobs and more informal jobs. They can do so by firing “expensive” formal workers (because of payroll taxes and social insurance contributions) and hiring other workers informally (who, for a given set of characteristics, are cheaper from the point of view of the firm), or by colluding with their existing employees and re-negotiating existing employment relationships from formal to informal (Bérgolo and Cruces 2014). Additionally, informality can provide firms with more flexibility to adjust the labor force in the future as informal workers are not entitled to, for example, severance pay. Thus, increasing tax evasion in the form of unregistered or informal employment becomes a strategy for firms (and perhaps for workers, if the alternative is unemployment) to smooth the negative trade shock.
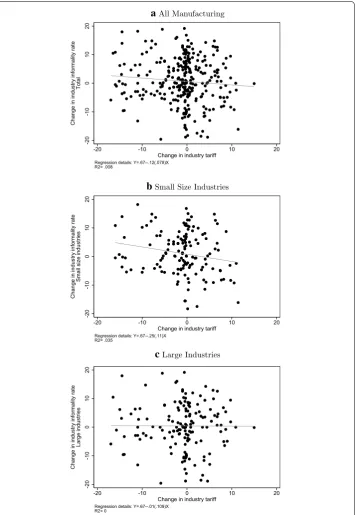
A fundamental premise of our analysis is that the correlation between tariffs and labor informality in the manufacturing sector combines partial and general equilibrium mechanisms. In partial equilibrium, when labor cannot reallocate across sectors, we should expect effects at the industry level. These effects are, thus, more easily pictured by comparing the cross-sectional relationship between changes in tariffs and changes in labor informality across industries. This relationship is plotted in Fig. 2. For all indus-tries (panel A), this correlation is negative, so that indusindus-tries exposed to larger tariff cuts experienced an increase in their labor informality rate. Furthermore, the correlation is much stronger among small-size industries (panel B) than among larger industries (panel C), where it actually vanishes. This indicates that the use of labor informality as an adjustment mechanism may differ according to the size of firms in each industry. The tax-evasion literature suggests that the detection technology used by the tax authority is a plausible explanation for these patterns.
To explore general equilibrium effects, we can look at conditional trends (Galiani and Porto 2010). To do this, we estimate a model using cross-section data where the depend-ent variable is the labor informality status of manufacturing workers, and the independ-ent variables are their individual characteristics, industry tariffs, and industry and time indicators. These time dummies capture the level of informality at different periods of time, conditional on the other included covariates. In Fig. 3, we plot this conditional or residual informality rate on the average national tariff. In panel A, the correlation
a All Manufacturing
-2
0
-1
0
0
10
20
Change in industry informality rate
Tota
l
-20 -10 0 10 20
Change in industry tariff
Regression details: Y=.67--.12(.078)X R2= .008
b Small Size Industries
-2
0
-1
0
0
10
20
Change in industry informality rate
Small size industries
-20 -10 0 10 20
Change in industry tariff
Regression details: Y=.67--.25(.11)X R2= .035
c Large Industries
-2
0
-1
0
0
10
20
Change in industry informality rate
Large industries
-20 -10 0 10 20
Change in industry tariff
Regression details: Y=.67--.01(.109)X R2= 0
is positive, indicating that a reduction in labor informality over time occurred concur-rently with the fall of the average national tariff once the effect of cross-industry tariff differences was accounted for.
In general equilibrium, informality in the non-traded sector can also be affected by trade policy. To show this, we estimate the conditional or residual informality rate for the non-traded sector, and we plot, in panel B of Fig. 3, the correlation with the aver-age tariff. In this case, labor informality in the non-traded sector is negatively correlated with the average national tariff rate.
3 Regression analysis
In this section, we set up a formal regression analysis to explore the correlations estab-lished above. Our aims are to identify the causal impact of trade liberalization on infor-mality and to disentangle the different mechanisms at work. We estimate the two-step
a Manufacturing Sector
-.0
6
-.04
-.02
0
.0
2
.0
4
Survey effects - Manufacturing sector
2.6 2.8 3 3.2 3.4 3.6
Log Average national tariff
Regression details: Y=-.21+.07(.015)X R2= .371
b Non-Traded Sectors
.0
5
.1
.1
5
.2
.2
5
.3
Survey effects - Non-traded sector
2.6 2.8 3 3.2 3.4 3.6
Log Average national tariff
Regression details: Y=.91--.23(.043)X R2= .486
empirical model of Galiani and Porto (2010) with an instrumental variables estimator. We first exploit the cross-sectional variation in tariffs and labor informality to estimate the partial equilibrium mechanisms or within industry effects. We then rely on our time series of cross-section data to estimate general equilibrium effects for the aggregate manufacturing and non-traded sectors.
3.1 Cross-sectional mechanisms
We begin with the cross-sectional analysis. Our empirical model is:
where yijt is the informality status of individual i employed in industry j at time t, τjt is the tariff on industry j at time t, and the vector x includes individual characteristics, such as gender, age, marital status, indicator variables for head of household and education, as well as household characteristics such as the number of children and household income (in equivalent-adult units). The baseline model also includes industry Ij and time Tt fixed effects.
Following the tax evasion literature discussed above, we expect the effect of trade pol-icy changes to be different depending on firm size in each industry. Large firms are more visible and face a greater probability of detection. As a result, the labor force of a large firm will be mostly (or fully) formal. The opposite happens in small-size firms which face a lower probability of detection and, thus, may evade social insurance contributions to a greater extent. We work with two measures of industry size that arguably capture the tax evasion mechanism that we advocate. For definition 1, we use EPH data and calcu-late the shares of workers employed in small-size firms (firms with 15 workers or less) in each industry in 1980. The intuition is that industries where small firms are more preva-lent than large firms will be less likely to be detected by the tax authorities. For definition 2, we define indicator variables of industry size based on those shares. Concretely, an industry is defined as small when the share of workers in small firms is greater than the share of workers in large firms in 1980. According to this industry size definition, 12 out of the 24 industries were classified as small.5 We expand model (1) as follows:
where Sj is the industry size variable, either the share of workers employed in small-size
firms in industry j (definition 1) or a small-industry dummy (definition 2), and Sjlnτjt is an interaction term with the industry tariff. The coefficient of the interaction term, βsτ , is the part of the impact of trade on informal employment that depends on the initial share of small-size firms in the industry (definition 1) or the differential impact of trade on informal employment in initially small industries, relative to large industries (definition 2). We expect this interaction term to be negative.
We provide evidence in support of the estimation of differential impacts for small ver-sus large size industries in Fig. 4. Previous to the major cut in tariffs between 1989 and 1990, the trend in the informality rate was similar in both groups of industries with a
(1)
yijt=xijt′ βx+βτlnτjt+Ij+Tt+εijt,
(2)
yijt=xijt′ βx+βτlnτjt+βsτSjlnτjt+βsSj+Ij+Tt+εijt,
larger level for the small-size category. When the large tariff reduction took place, the informality rate increased comparatively more in small-size industries. We believe that the tax evasion arguments presented before explain the differential trend in labor infor-mality observed in the figure.
This specification allows us to account for several confounding factors for the impacts of trade policy, βτ and βsτ . Industry- and time fixed effects control for industry-specific characteristics and aggregate shocks related to business cycles and other policy changes. For instance, if the government raises tariffs during a recession and workers move from formality to informality, βτ and βsτ could be biased upward because of the business cycle effect. Time fixed effects also allow us to control for political economy changes related to the labor market, such as variations in tax regimes and in social insurance contri-butions, regulations regarding type of labor contracts, and so on. Similarly, unobserved industry characteristics that are time invariant, such as the ability to form a lobby, indus-try productivity or capital intensity, could affect indusindus-try tariffs and informal employ-ment simultaneously. The inclusion of industry fixed effects controls these unobserved factors that could be correlated with tariffs and have an independent effect on informal employment.
In addition, our data span a long time series of active trade policy. A before–after com-parison of a single episode of trade liberalization would be missing out the important fact that the comparison is between an initial pattern of trade protection and another one with lower protection, but not between autarky and free trade (Goldberg and Pavc-nik 2007). As in Galiani and Porto (2010), our time series of cross-sections overcomes this limitation by allowing for the comparison of trends in trade reforms and those in the outcome variable of interest, labor informality.
Even in our setting, where we compare within industry changes along varying trends of trade liberalization, there might still remain certain omitted factors that can lead to biases. For instance, industry unionization and lobbying power can achieve lower tariff cuts and more rapid declines in informality. Alternatively, gains in productivity at the industry level may correlate with higher tariff cuts (because of lower costs of imported
0 10 20 30 40 50 60
19
80
1985 1986 1987 1988 1989 1990 1991 1992 1993 1994 1995 1996 1997 1998 1999 2000 2001
Informality rate - Small industries (%) Informality rate - Large industries (%) Avg. tariff - Small industries (%) Avg. tariff - Large industries (%)
capital goods) as well as with larger declines in informality.6 To supplement our OLS
results, we also explore instrumental variable models. We work with two instruments often used in the literature: the initial industry tariff and an industry weighted average of Argentina’s trade partners exchange rates. More concretely, we interact industry tar-iffs in the first period (1980) with a three-category variable that captures three stages of Argentine trade policy, namely the initial period with high tariffs (years 1980–1985), the flat-tariff period of 1986–1989, and the last decade, from 1990 to 2001. A similar approach was proposed by Topalova (2010). The instrument z1 is defined as:
where τj,1980 is the initial sectoral tariff and Postt is an indicator variable. The plausible
validity of this instrument is illustrated in Fig. 5. The top panel shows that import tariffs fell in all industries, while the bottom panel shows a differential pattern of tariff reduc-tion across industries. Industries that tradireduc-tionally received the highest level of protec-tion experienced the most drastic reducprotec-tions, while industries with the lowest tariff levels in 1980 faced the lowest reductions.
The second instrument z2 , the average exchange rate of main trading partners (Park
et al. 2010; Brambilla et al. 2012), is defined as:
where ect is the exchange rate of country c (relative to the Argentine peso) at time t and
θjc,1980 is the share of country c in Argentine imports of product j in 1980. Given this
share, a higher exchange rate of country c will generate higher imports from this coun-try.7 Tariffs may increase to protect industry j, or may fall to secure the gains from trade.
This instrumental variable is thus based on the variation in the exchange rates of all trad-ing partners—a change arguably exogenous to the model— and on each industry’s expo-sure to those changes, given their initial share on Argentine imports of product j. By fixing the shares θjc,1980 at the 1980 level, we seek to predetermine this value for all t, ensuring that tariff changes generated through exchange rates variations are exogenous.
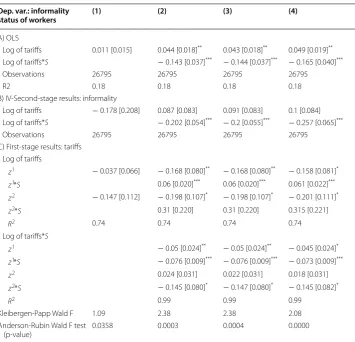
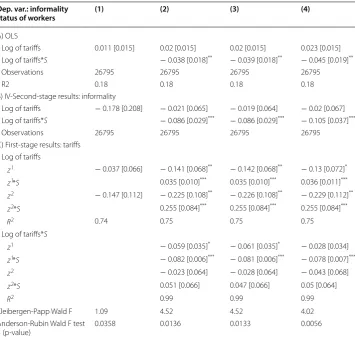
Cross-section results are reported in Table 2 for the model that interacts industry tariffs with the share of small-size firms in each industry in 1980 (definition 1), and Table 3 for the model that interacts industry tariffs with an indicator variable of small-size industry in 1980 (definition 2). In both tables, ordinary least squares (OLS) results are presented in panel A and instrumental variables (IV) results, in panel B. First-stage results of the IV models are reported in panel C. In all models, standard errors are clus-tered at the industry-year level.
In column 1, we estimate the model in (1), without interactions with industry size variables. The effect of the sectoral tariffs on labor informality at the industry level
(3)
z1jt=lnτj,1980∗Postt,
(4) z2jt=
c
etc∗θjc,1980,
6 Acosta and Montes-Rojas (2014) report a lower impact of tariffs reduction on labor informality in industries that invest more during the 1992–2003 period in Argentina.
(within-industry effect) is indistinguishable from zero because potentially different industry responses cancel out, on average. In column 2, we allow for heterogeneous effects. In Table 2, we find a positive OLS effect of tariffs on informality but a negative interaction with industry size, as expected. In particular, as the share of small-size firms increases, the effect turns negative, indicating a within-industry increase in the infor-mality rate when tariffs fall. As additional robustness tests, we include in column 3 the average industry wage as a control variable. Our estimated impacts are not affected significantly. This is consistent with the wage adjustment associated with an episode of trade liberalization being a general equilibrium mechanism that cannot be captured using the cross-sectional variation of the data. Finally, to account for other potential
1 2
3 4 5
6 7
8 9 10
11 12
13
14 15
16
17 18
19
20
21 22
23 24
0
10
20
30
40
50
60
Tariff (%), Year 200
0
0 10 20 30 40 50 60
Tariff (%), Year 1980
-80
-60
-4
0
-2
0
0
Change in the level of protection
2000-1980
20 30 40 50 60
Tariff (%), Year 1980
Regression details: Y=-6.01--1.17(.351)X R2= .334
confounding factors that might be driving the results, we include initial industry char-acteristics, namely the share of skilled workers and the size of the labor force in 1980, interacted with the variable Postt (which captures the trade policy stages). The results
in column 4 indicate that tariff reductions still lead to increases in labor informality in industries with an initially large share of small-size firms. The magnitude of the effects is (in absolute value) larger than before, indicating that confounding factors, if any, were weakening the estimated impacts.
For further robustness analysis of our estimates, we discuss next the IV results. In panel C of Table 2, we evaluate the first-stage results. The instruments behave relatively well in terms of statistical significance, specially when we include an interaction term with a industry size variables. However, using the Kleibergen–Paap Wald test and the Stock-Yogo critical values, we cannot reject the hypothesis that the instruments are
Table 2 Industry tariffs and informality interaction with share of small size-firms at the industry level in 1980 OLS and IV estimation
Cross-section panel regressions of sectoral informality on industry tariffs. Industry size S is defined based on the share of small firms in each industry in 1980. In panels B and C, z1 is the instrument defined using tariffs in 1980; z2 is the instrument
based on exchange rates of main partners. Robust standard errors clustered at the industry-year level in brackets. The Stock-Yogo critical values for a 5% and 10% maximal IV relative bias are 19.93 and 11.59 in column (1) and 11.04 and 7.56 in columns (2) to (4) respectively
*** Significant at 1% ** Significant at 5% * Significant at 10%
Dep. var.: informality
status of workers (1) (2) (3) (4)
A) OLS
Log of tariffs 0.011 [0.015] 0.044 [0.018]** 0.043 [0.018]** 0.049 [0.019]**
Log of tariffs*S − 0.143 [0.037]*** − 0.144 [0.037]*** − 0.165 [0.040]***
Observations 26795 26795 26795 26795
R2 0.18 0.18 0.18 0.18
B) IV-Second-stage results: informality
Log of tariffs − 0.178 [0.208] 0.087 [0.083] 0.091 [0.083] 0.1 [0.084]
Log of tariffs*S − 0.202 [0.054]*** − 0.2 [0.055]*** − 0.257 [0.065]***
Observations 26795 26795 26795 26795
C) First-stage results: tariffs Log of tariffs
z1 − 0.037 [0.066] − 0.168 [0.080]** − 0.168 [0.080]** − 0.158 [0.081]* z1
*S 0.06 [0.020]*** 0.06 [0.020]*** 0.061 [0.022]***
z2 − 0.147 [0.112] − 0.198 [0.107]* − 0.198 [0.107]* − 0.201 [0.111]* z2
*S 0.31 [0.220] 0.31 [0.220] 0.315 [0.221]
R2 0.74 0.74 0.74 0.74
Log of tariffs*S
z1 − 0.05 [0.024]** − 0.05 [0.024]** − 0.045 [0.024]*
z1
*S − 0.076 [0.009]*** − 0.076 [0.009]*** − 0.073 [0.009]***
z2 0.024 [0.031] 0.022 [0.031] 0.018 [0.031]
z2
*S − 0.145 [0.080]* − 0.147 [0.080]* − 0.145 [0.082]*
R2 0.99 0.99 0.99
Kleibergen-Papp Wald F 1.09 2.38 2.38 2.08
Anderson-Rubin Wald F test
weak.8 Despite this result, the Anderson–Rubin test does reject the null hypothesis that
the instruments are irrelevant in the second stage (when omitting tariffs). Consequently, while the IV results can still show some biases, we believe they are still useful in bet-ter establishing a link between tariffs and informality. Turning back to the second-stage regressions in panel B, we confirm the results in columns 1–4. If anything, the IV results appear stronger in magnitude.
The lack of an effect in large industries or the reduction in the informality rate reported in Table 2 can be explained by tax evasion arguments: large firms face a high probabil-ity of detection and do not resort to labor informalprobabil-ity as an adjustment mechanism. An
Table 3 Industry tariffs and informality interaction with indicator variable of small-size industry in 1980 OLS and IV estimation
Cross-section panel regressions of sectoral informality on industry tariffs. Industry size S is a dummy variable indicating small industries in 1980. In panels B and C, z1 is the instrument defined using tariffs in 1980; z2 is the instrument based on
exchange rates of main partners. Robust standard errors clustered at the industry-year level in brackets. The Stock-Yogo critical values for a 5% and 10% maximal IV relative bias are 19.93 and 11.59 in column (1) and 11.04 and 7.56 in columns (2) to (4) respectively
*** Significant at 1% ** Significant at 5% * Significant at 10%
Dep. var.: informality
status of workers (1) (2) (3) (4)
A) OLS
Log of tariffs 0.011 [0.015] 0.02 [0.015] 0.02 [0.015] 0.023 [0.015]
Log of tariffs*S − 0.038 [0.018]** − 0.039 [0.018]** − 0.045 [0.019]**
Observations 26795 26795 26795 26795
R2 0.18 0.18 0.18 0.18
B) IV-Second-stage results: informality
Log of tariffs − 0.178 [0.208] − 0.021 [0.065] − 0.019 [0.064] − 0.02 [0.067]
Log of tariffs*S − 0.086 [0.029]*** − 0.086 [0.029]*** − 0.105 [0.037]***
Observations 26795 26795 26795 26795
C) First-stage results: tariffs Log of tariffs
z1 − 0.037 [0.066] − 0.141 [0.068]** − 0.142 [0.068]** − 0.13 [0.072]* z1
*S 0.035 [0.010]*** 0.035 [0.010]*** 0.036 [0.011]***
z2 − 0.147 [0.112] − 0.225 [0.108]** − 0.226 [0.108]** − 0.229 [0.112]** z2
*S 0.255 [0.084]*** 0.255 [0.084]*** 0.255 [0.084]***
R2 0.74 0.75 0.75 0.75
Log of tariffs*S
z1 − 0.059 [0.035]* − 0.061 [0.035]* − 0.028 [0.034]
z1
*S − 0.082 [0.006]*** − 0.081 [0.006]*** − 0.078 [0.007]***
z2 − 0.023 [0.064] − 0.028 [0.064] − 0.043 [0.068]
z2
*S 0.051 [0.066] 0.047 [0.066] 0.05 [0.064]
R2 0.99 0.99 0.99
Kleibergen-Papp Wald F 1.09 4.52 4.52 4.02
Anderson-Rubin Wald F test
(p-value) 0.0358 0.0136 0.0133 0.0056
additional explanation can be found in heterogeneous firms models of trade. Export-ing firms are larger and more productive than domestically oriented firms (Bernard and Jensen 1995). Thus, large industries are expected to have a larger participation of exporting firms. With trade liberalization, these firms can gain access to new markets and expand, reducing the participation of informal labor. This behavior may neutralize any increase in informal employment by large firms producing for the domestic market. Bustos (2011) provides evidence on the expansion of the exporting segment in Argen-tine industries during 1992–1996 in the context of a regional trade liberalization episode (Mercosur).
For completeness, we end this section with a brief discussion of the model that inter-acts industry tariffs with an indicator variable of small-size industry. These are results are reported in Table 3. As it can be seen, the estimates in column 1–4 behave as before, qualitatively. This provides additional support to the overall evaluation of the cross-sec-tion results.
3.2 General equilibrium mechanisms
We now use the time series variability in the data to look at general equilibrium effects— via labor reallocation and wage adjustment as well as via firm entry and exit—that cannot be captured with cross-sectional data. In particular, we investigate the aggregate effect of tariffs on both manufacturing and non-tradable sectors. We study these effects with the strategy proposed by Galiani and Porto (2010). The general idea is that the level of protection of a country (i.e., the average national tariff) has general equilibrium impacts on informality. However, the economy is not fully flexible in the short-run, so that while there is an underlying trend in informality that depends on the trend in average protec-tion, there are short-run departures from this trend (e.g., the within industry results of previous sections). Conceptually, the idea of Galiani and Porto (2010) is to control those short-run departures of the trend to extract the general equilibrium effect of tariffs. In a first step, we estimate the model we used to analyze the cross-sectional mechanisms (model (2)) and we recover the time fixed effects. We interpret the time fixed effects as measures of the residual informality rate at time t once all the cross-section covariates used in model (2) are accounted for, i.e., the part of the time-trend that is not correlated with individual characteristics and specially with industry tariffs. Then, in a second step, we regress the residual informality rate on the average national tariff of the economy weighted by the participation of each industry in total employment:
where m is a vector of controls. Because the dependent variable in this second stage is estimated, we use weighted least squares with weights given by the inverse of the esti-mates of the variance of the time fixed effects from the first stage.
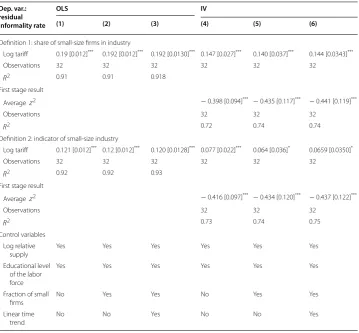
Results are provided in Table 4 (using alternatively industry size definition 1 and industry size definition 2 in the first step of the procedure (model (2))). The controls included in m in (5) are the ratio of the labor force in tradable to non-tradable sectors, the average educational level of the labor force and the proportion of small firms in each sector, and a linear time trend. Columns 1–3 show the OLS coefficients. The average tar-iff is positively associated with the labor informality trend in the manufacturing sector.
(5)
ˆ
In columns 4–6, we report the IV estimates, where the instrument is the average of the exchange rate of major trade partners in each period, weighted by the participation of each industry in total employment.9 The first-stage results show that this instrument is
statistically significant. IV estimates from the second stage show that the average tar-iff impacts positively on the labor informality trend of the manufacturing sector (i.e., a reduction in tariffs reduces labor informality), after controlling for the structure of sec-toral protection and allowing for general equilibrium adjustments. Our estimates range between 0.06 and 0.15, indicating a reduction in the labor informality rate of 0.6 to 1.5 percentage point for each 10% reduction in the national average tariff.
We can interpret these results as follows. In the cross-section, inter-industry differ-ences in tariff cuts increase labor informality being the effect differentially stronger in industries with a larger share of small-size firms. This is consistent with our hypothe-sis that the loss of profitability of manufacturing firms induces them to decrease their
Table 4 Average tariff and informality in the manufacturing sector OLS and IV estimation
Time series regressions of residual informality on the national average tariff. Robust standard errors clustered at the year level in brackets. Average z2 is the average of the instrument based on exchange rates of main partners weighted by the
participation of each industry in total employment
*** Significant at 1% * Significant at 10% Dep. var.: residual informality rate
OLS IV
(1) (2) (3) (4) (5) (6)
Definition 1: share of small-size firms in industry
Log tariff 0.19 [0.012]*** 0.192 [0.012]*** 0.192 [0.0130]*** 0.147 [0.027]*** 0.140 [0.037]*** 0.144 [0.0343]***
Observations 32 32 32 32 32 32
R2 0.91 0.91 0.918
First stage result
Average z2 − 0.398 [0.094]*** − 0.435 [0.117]*** − 0.441 [0.119]***
Observations 32 32 32
R2 0.72 0.74 0.74
Definition 2: indicator of small-size industry
Log tariff 0.121 [0.012]*** 0.12 [0.012]*** 0.120 [0.0128]*** 0.077 [0.022]*** 0.064 [0.036]* 0.0659 [0.0350]*
Observations 32 32 32 32 32 32
R2 0.92 0.92 0.93
First stage result
Average z2 − 0.416 [0.097]*** − 0.434 [0.120]*** − 0.437 [0.122]***
Observations 32 32 32
R2 0.73 0.74 0.75
Control variables Log relative
supply
Yes Yes Yes Yes Yes Yes
Educational level of the labor force
Yes Yes Yes Yes Yes Yes
Fraction of small firms
No Yes Yes No Yes Yes
Linear time trend
No No Yes No No Yes
9 As before, the instrumental variables in the first step (model (2)) are z1
, z2
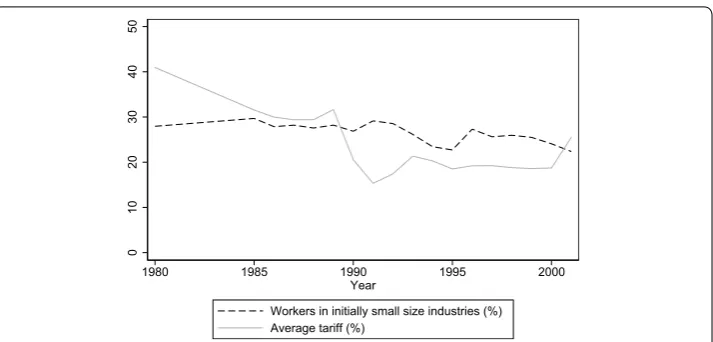
formal–informal employment combination so that informality increases. Given this structure of sectoral protection, however, aggregate labor informality in manufactures declines with the fall in the national average tariff. This is because of two reasons. First, the outflow of workers and the resulting wage adjustment can make formality cheaper. Second, foreign competition can lead to firm exit and these are low productivity and probably low size firms which employ more informal workers.10 We provide evidence
of this channel in Fig. 6. The share of workers in initially small-size industries declined over time jointly with average tariff. Considering that the share of informal workers was always larger in small-size industries (Table 1), firm exit can help explain the reduction in aggregate labor informality in the manufacturing sector. In terms of Fig. 1, all this evi-dence shows that the trend in labor informality in the manufacturing sector would have been steeper in the absence of trade liberalization.
With a similar reasoning, the non-traded sector may also be affected by the changes in average protection in manufactures. To explore this, we run the first-step regressions (model (2)) using workers in the non-traded sector (thus excluding the trade policy vari-ables on the right-hand side). In the second step, we regress the residual average infor-mality rate (i.e., the time fixed effects recovered from the first stage) on the average national tariff. The results from these estimations are presented in Table 5. Both the OLS (columns 1–3) and IV (columns 4–6) estimates reveal that aggregate trade protection affects negatively and significantly the labor informality trend in the non-traded sector— i.e., the fall in tariffs increased labor informality in this sector. In particular, the IV esti-mate is around – 0.11 and – 0.13, indicating an increase in the informality rate of the non-traded sector of around 1 percentage point for each 10% reduction in the national average tariff. This can happen if, for instance, workers that are fired from manufactures because of the lower tariffs are absorbed in the non-traded sector as informal employees. In addition, informality can increase if the non-traded sector expands and small firms
0
10
20
30
40
50
1980 1985 1990 1995 2000
Year
Workers in initially small size industries (%) Average tariff (%)
Fig. 6 Share for workers in initially small-size industries and average tariff. Source: Own elaboration based on EPH and Galiani and Porto (2010). Small-size industries using definition 2 (the share of workers in small firms is greater than the share of workers in large firms in 1980)
Table 5 Average tariff and informality in the non-traded sector OLS and IV estimation
Time series regressions of residual informality on the national average tariff. Robust standard errors clustered at the year level in brackets. Average z2 is the average of the instrument based on exchange rates of main partners weighted by the
participation of each industry in total employment
*** Significant at 1% ** Significant at 5% * Significant at 10% Dep. var.: residual informality rate
OLS IV
(1) (2) (3) (4) (5) (6)
Definition 1: share of small-size firms in industry
Log tariff − 0.03 [0.011]**
− 0.021 [0.010]**
− 0.0215 [0.00918]**
− 0.113 [0.036]***
− 0.133 [0.063]*
− 0.130 [0.0630]*
Observations 32 32 32 32 32 32
R2 0.98 0.98 0.982
First stage result
Average z2 − 0.448 [0.117]*** − 0.376 [0.129]***− 0.379 [0.131]***
Observations 32 32 32
R2 0.76 0.79 0.79
Definition 2: indicator of small-size industry
Log tariff − 0.03 [0.011]**
− 0.021 [0.010]**
− 0.0215 [0.00918]**
− 0.113 [0.036]***
− 0.133 [0.063]*
− 0.130 [0.0630]*
Observations 32 32 32 32 32 32
R2 0.98 0.98 0.982
First stage result
Average z2 − 0.448 [0.117]*** − 0.376 [0.129]***− 0.379 [0.131]***
Observations 32 32 32
R2 0.76 0.79 0.79
Control variables Log relative
supply Yes Yes Yes Yes Yes Yes
Educational level of the labor force
Yes Yes Yes Yes Yes Yes
Fraction of small firms
No Yes Yes No Yes Yes
Linear time trend
No No Yes No No Yes
enter the market. In terms of Fig. 1, the trend in labor informality in the non-tradables sector would have been flatter in the absence of trade liberalization episodes.
3.3 Additional supporting evidence: wage adjustment
In this section, we study the role of wage adjustment to provide additional supporting evidence for our results and for the mechanisms we posit. To explore whether sectoral tariffs affect the wage differential between formal and informal workers in the the cross-section, we estimate a series of models of the form:
(6)
lnwijt=x′ijtβx+βddijt+βτlnτjt+βdτdijtlnτjt
where lnwijt is the logarithm of the hourly wage for individual i employed in industry
j in t, τjt is the tariff on industry j at t, and the vector x includes the same set of indi-vidual characteristics as model (1). The variable dijt indicates the labor informality status
of worker i in industry j at time t, and Sj is the industry size indicator (either the share of workers in small-size firms or a dummy for small-size industry). Here, the parameters of interest are βdτ and βsdτ , which capture the differential impact of tariff changes on the wage of workers with varying informality status at different industry sizes. Ij and Tt are
industry and time fixed effects.
We estimate model (6) by OLS and IV using z1jt and z2jt to instrument sectoral tariffs, as before.11 Table 6 presents the OLS and IV estimation results. Panel A reports estimates
when using the share of small-size firms as industry-size variable (definition 1), while panel B reports results when interacting industry tariffs with an indicator variable for small-size industry (definition 2). Industry tariffs have no effects on the within-industry wage differential between informal and formal workers at the usual significance levels, regardless the estimation method and regardless the inclusion of heterogenous effects by industry size. This finding is consistent with labor informality being the within-industry mechanism of adjustment when labor cannot reallocate across sectors.
To study the general equilibrium adjustment, we use the identification strategy based on the time-series variability of tariff data presented before. In a first stage, we estimate a wage regression including the interaction between dijt and time effects Tt as additional
control variables. The coefficients associated with these interaction terms, βdt , capture the residual wage differential between informal and formal workers in each time period. We estimate this first stage separately for the manufacturing sector (controlling for the sectoral structure of tariffs) and for the non-tradable sector. In the second stage, we use the time dimension of the data and propose a model for the wage differential between informal and formal workers in each time period in both sectors (estimated from the first stage) on the average national tariff. The reason to group the estimated effects from both sectors is that in general equilibrium we expect the wage adjustment to occur for the whole economy, since workers can move across sectors. We estimate models of the form:
where vector x includes the ratio of the labor force in the manufacturing to non-tradable sectors, the ratio of formal and informal labor force in the whole economy, their educa-tional level, and a linear time trend. We obtain the coefficients through weighted least squares, using the inverse of the estimates of the variance of the effects from the first stage as weights.
Table 7 presents our OLS and IV results, where we instrument for the sectoral struc-ture of protection in the first stage using zjt1 and zjt2 , and for the national tariff in the
(7)
ˆ
βdt =x′
tαx+ατlnτt+νt,
11 We also explore instrumental variable models where the informality d
ijt is instrumented as well. Informality can be
endogenous if a low formal wage, for instance, creates a preference for informal employment or if unobserved factors such as labor perspectives or job attributes are present. The results appear in Appendix A. In addition, we replicate the
procedure proposed by Paz (2014). Paz estimates a switching regression model where informal and formal wages are
second stage using the average of the exchange rate of major trade partners in each period, weighted by the participation of each industry in total employment. Panel A shows the results obtained when the first stage allows for heterogenous impact by indus-try size using definition 1, while panel B uses definition 2. We find that, as the average tariff goes down, the relative wage of informal to formal workers increases over time. This result is valid for the whole economy, i.e., the interaction term between the national average tariff and the indicator variable for the non-tradable sector is not statistically sig-nificant. This is consistent with a general equilibrium wage adjustment whereby workers move across sectors and industry wage premiums disappear.
The improvement of informal wages relative to formal wages offers a plausible expla-nation of the general equilibrium reduction in the informality rate in the manufacturing sector. When workers move across sectors, part of the unemployed labor force from the manufacturing industries is absorbed in the same sector at a lower wage. The reduction in the cost of formal employment results in a lower informality rate. In the non-tradable sector, the improvement of informal wages with respect to formal wages indicates that the increase in the informality rate seems due to the entry of new firms that start small and informal.
4 Conclusions
This paper examined the link between trade liberalization and labor informality in Argentina using a long time series spanning the 1980–2001 period. This was a period of sizeable tariff cuts and of increasing labor informality. Following Galiani and Porto (2010), we were able to disentangle cross-section impacts, that operate at the industry level, and time-series impacts, that operate at a general equilibrium level. Our findings indicated, first, that trade liberalization increased labor informality at the industry level,
Table 6 Industry tariffs and wage differentials formal and informal workers OLS and IV estimation
Cross-section panel regressions of formal-informal wage differential and industry tariffs. Industry size S defined based on the share of small firms in each industry in 1980 (panel A) and as a dummy indicating small industries in 1980 (panel B). Robust standard errors clustered at the industry-year level in brackets
* Significant at 10%
Dep. var.: logarithm of workers’
hourly wages OLS IV
(1) (2) (3) (4)
A) Definition 1: share of small-size firms in industry
= 1 if informal − 0.153 [0.095] − 0.112 [0.097] − 0.082 [0.183] − 0.129 [0.193] Log of tariffs 0.034 [0.022] 0.037 [0.022]* 0.065 [0.069] 0.02 [0.063]
= 1 if informal*Log of tariffs − 0.005 [0.029] − 0.025 [0.033] − 0.368 [0.216]* − 0.24 [0.182]
= 1 if informal*Log of tariffs*S 0.015 [0.018] 0.01 [0.023]
Observations 20661 20661 20661 20661
R2 0.38 0.38
B) Definition 2: indicator of small-size industry
= 1 if informal − 0.153 [0.095] − 0.122 [0.094] − 0.082 [0.183] − 0.204 [0.222] Log of tariffs 0.034 [0.022] 0.036 [0.022]* 0.065 [0.069] 0.017 [0.065]
= 1 if informal*Log of tariffs − 0.005 [0.029] − 0.021 [0.030] − 0.368 [0.216]* − 0.239 [0.193]
= 1 if informal*Log of tariffs*S 0.009 [0.009] 0.01 [0.011]
Observations 20661 20661 20661 20661
Table 7 Average tariff and wage differentials formal and informal workers OLS and IV estimators
Times series regressions of formal-informal residual wage differential on the national average tariff. Robust standard errors clustered by year and sector level in brackets. Average z2 is the average of the instrument based on exchange rates of main
partners weighted by the participation of each industry in total employment
*** Significant at 1% * Significant at 10% Dep. var.: residual wage differential
OLS IV
(1) (2) (3) (4) (5) (6)
A) Definition 1: share of small-size firms in industry Log of average
tariff − 0.116 [0.058]
*
− 0.117 [0.068]*
− 0.003 [0.112] − 0.274 [0.140]*
− 0.358 [0.178]*
− 0.377 [0.203]*
Log of average
tariff * NT −
0.121 [0.105] − 0.108 [0.112] − 0.130 [0.124] − 0.258 [0.195] − 0.202 [0.216] − 0.261 [0.244]
Observations 64 64 64 64 64 64
R2 0.45 0.46 0.505
First stage result Log of average tariff
Average z2 − 0.633 [0.190]*** − 0.505 [0.174]*** − 0.474 [0.137]***
Average z2
* NT
0.006 [0.214] − 0.044 [0.198] 0.110 [0.158]
R2 0.34 0.49 0.69
Log of average tariff * NT
Average z2 − 0.059 [0.156] 0.049 [0.143] 0.062 [0.136]
Average z2
* NT
− 0.533 [0.176]*** − 0.579 [0.162]*** − 0.510 [0.156]***
R2 0.98 0.99 0.99
B) Definition 2: indicator of small-size industry Log of average
tariff −
0.116 [0.058]* − 0.117 [0.068]* − 0.004 [0.112] − 0.275 [0.139]* − 0.358 [0.177]* − 0.378 [0.202]*
Log of average
tariff * NT −
0.121 [0.105] − 0.107 [0.111] − 0.129 [0.124] − 0.256 [0.195] − 0.201 [0.216] − 0.260 [0.243]
Observations 64 64 64 64 64 64
R2 0.45 0.46 0.50
First stage result Log of average tariff
Average z2 − 0.633 [0.190]*** − 0.505 [0.174]*** − 0.474 [0.137]***
Average z2
* NT
0.006 [0.214] − 0.044 [0.198] 0.110 [0.158]
R2 0.34 0.49 0.688
Log of average tariff * NT
Average z2 − 0.058 [0.156] 0.048 [0.143] 0.062 [0.135]
Average z2
* NT
− 0.533 [0.176]*** − 0.579 [0.162]*** − 0.510 [0.156]***
R2 0.98 0.99 0.99
Log relative supply
Yes Yes Yes Yes Yes Yes
Log relative sup-ply of informal workers
No Yes Yes No Yes Yes
Log relative sup-ply of skilled workers
No Yes Yes No Yes Yes
and that the magnitude of this effect depended on the size of the firms in each indus-try. We argued that firms more exposed to tariff cuts substituted formal workers with informal workers for tax-evasion reasons and that this effect was differentially stronger in industries with a larger share of small-size firms. This result suggests that increasing tax evasion (in the form of hiring workers informally) worked as a strategy to smooth the negative trade shock. Second, evidence from time-series variation of the data established that, conditional on the structure of sectoral protection, labor informality in the manu-facturing sector decreased as the average tariff fell, while the opposite occurred in the non-traded sector. These are general equilibrium effects caused by the reallocation of workers, the adjustment of relative formal and informal wages, and firm entry and exit.
Our findings using cross-sectional and time series data helped to explain some of the seemingly contradictory results in the previous literature. The empirical results also allowed us to rationalize some of the adjustments observed in countries following trade liberaliza-tion episodes. Moreover, we validated empirically the intuiliberaliza-tion that the tax evasion-for-mality channel is a relevant firm adjustment mechanism that allows some smoothing of the effect of the reforms. This additional adjustment mechanism operates in the sectors exposed to the trade reform, but also in the non-exposed sectors, and it constitutes a trans-mission mechanism for general equilibrium effects in developing countries beyond those documented for developed countries (e.g., Acemoglu et al. 2016). This may be one of the reasons why governments in developing countries seem reluctant to increase their enforce-ment efforts, at least during episodes of reform. While workers suffer in the form of lower quality jobs, this additional margin helps to maintain overall employment levels, and this is the trade-off faced by economic policy makers. However, by distinguishing between the within-industry adjustment and the general equilibrium effects, our results also indicated that there is an additional dimension for this trade-off. In Argentina’s specific case, in gen-eral equilibrium labor informality fell in the tradable sector as a consequence of trade liber-alization, but it increased in the non-tradable sector.
While greater labor mobility across sectors is usually seen as desirable, we provided an example of one more dimension where it would help economies and labor markets adjust to a new equilibrium with lower costs. In our case, it would allow for a smoother transition to the long-run equilibrium, avoiding the increase in labor informality and the emergence of unemployment. Moreover, a wider social protection net not linked to employment (as is the case with most of Latin America’s social insurance systems) would mitigate the high costs for those workers that lose their social insurance benefits in the process of adjust-ment, and would reduce the incentive to evade taxes and hire workers informally.
Authors’ contributions
All authors read and approved the final manuscript.
Author details
1 Centro de Estudios Distrutivos, Laborales y Sociales (CEDLAS), Facultad de Ciencias Económicas (FCE), Departamento de Economía, Universidad Nacional de La Plata (UNLP), Argentina, Calle 6 e/ 47 y 48, Piso 3, Oficina 322, La Plata, Provincia de Buenos Aires, Argentina. 2 Comisión Nacional de Investigaciones Científicas y Técnicas (CONICET), Buenos Aires, Argentina. 3 Institute for the Study of Labor (IZA), Bonn, Germany. 4 Departamento de Economía, Universidad Nacional de La Plata (UNLP), Argentina, Calle 6 e/ 47 y 48, Piso 3, Oficina 322, La Plata, Provincia de Buenos Aires, Argentina.
Acknowledgements
Competing interests
The authors declare that they have no competing interests. Availability of data and materials
The data and program codes used to produce the results of this paper will be made available in the authors’ webpages after publication.
Disclosure of potential conflict of interests
We hereby declare that we have no relevant or material financial interests that relate to the research in the paper “Trade Liberalization and Informality in Argentina: Exploring the Adjustment Mechanisms”, submitted to the Latin American Economic Review.
Funding None.
Informed consent Not applicable.
Research involving human participants and/or animals Not applicable.
Appendix
A. Robustness check: instrumenting for informality status
We explore estimating model (6) by IV using zjt1 and zjt2 to instrument sectoral tariffs, and instrumenting the informality status dijt as well. Informality can be endogenous if a
low formal wage, for instance, creates a preference for informal employment or if unob-served factors such as labor perspectives or job attributes are present. We propose an instrumental variable that is a function of the informality condition of other household members (Paz 2014; Pratap and y Quintin 2006; Olson 2002):
If individual i from household h is not the household head, we assign as instrument the informality condition of the household head ( dhhead,h ), while for household heads we assign as instrument the average of the informality condition of other household mem-bers ( dother,h ). We consider unemployed and inactive individuals that do not receive a pension as informal household members. The validity of the instrument relies on the extension of some of the social security components to other household members, such as the health insurance.12 The exclusion restriction requires that the informality
condi-tion of other household members could impact on the productivity and wage received by individual i only through the impact on the informality status.13
The first stage results for a wage regression where dijt is the explanatory variable of interest appeared in Table 8. First column shows a positive association between ziht3 and dijt , indicating that the preferences for formality or informality are shared within the
household. The result is confirmed when we control for firm’s size (second column). Sec-ond stage results for model (6) are in Table 9. Our general conclusions regarding the lack of wage adjustment in the cross-section remain robust.
(8) z3iht=
dhhead,h ifi�=household head dother,h ifi=household head.
12 Galiani and Weinschelbaum (2011) find that secondary workers are less likely to operate formally than primary work-ers because they already enjoy some portion of the nonpecuniary benefits generated by the first worker.
13 The first stage for d
B. Robustness check: switching regression model
Our result variable y (logarithm of hourly wage) is:
The model is defined by the following three equations:
Error terms have a jointly normal distribution with zero mean and normalized variance σ12=1 . The estimation method is the two-step Heckman procedure:
y=
y∗2 if y∗1>0
y∗3 if y∗1≤0.
y∗1=x ′
1β1+ε1
y∗2=x ′
2β2+ε2
y∗3=x ′
3β3+ε3
E[y|x,y∗1>0] =x
′
2β2+σ12(x
′
1β1)
E[y|x,y∗1≤0] =x
′
3β3−σ13(−x
′
1β1)
Table 8 Informal status on the informality condition of other household members. Source: Own elaboration based on EPH
Robust standard errors in brackets
*** Significant at 1%
= 1 if informal = 1 if informal
zijt3 0.124 [0.010]
*** 0.093 [0.009]***
Firm size No Yes
Observations 20661 20661
R2 0.19 0.28
Table 9 Industry tariffs and wage differential; formal and informal workers; IV estimation Source: Own elaboration based on EPH and Galiani and Porto (2010)
Robust standard errors clustered by industry-year in brackets. Industry size S defined based on the share of small firms in each industry in 1980 (panel A) and as a dummy indicating small industries in 1980 (panel B)
Dep. var.: logarithm of workers’ hourly wages (1) (2)
A) Definition 1: share of small-size firms in industry
= 1 if informal 1.245 [1.733] 0.038 [1.402]
Log of tariffs − 0.062 [0.201] − 0.035 [0.167]
= 1 if informal*Log of tariffs − 0.48 [0.582] − 0.07 [0.465]
= 1 if informal*Log of tariffs*S − 0.005 [0.151]
Observations 20661 20661
B) Definition 2: indicator of small-size industry
= 1 if informal 1.245 [1.733] 0.341 [1.588]
Log of tariffs − 0.062 [0.201] − 0.024 [0.167]
= 1 if informal*Log of tariffs − 0.48 [0.582] − 0.185 [0.514]
= 1 if informal*Log of tariffs*S 0.019 [0.079]
where (z)= φ (z)ϕ(z) , and φ (.) is the normal density function and ϕ(.) is the normal
distribution.
The probability of informal employment was estimated in the first stage controlling for sex, age and its squared, civil status, indicator variables for education level and house-hold head status, indicator variables for industry affiliation and time periods, and indus-try tariffs. In the second stage, we estimate two wage models, for formal and informal workers, including the inverse Mills ratio as an additional control variable ( (z)).
Panel 1 of Table 10 shows the results obtained when we instrument for the log of tar-iffs in the first and second stage and the identification relies on the non-linearity of the Mills ratio. In panel 2, the selection equation uses an additional regressor for identifica-tion ( ziht3 ). In both panels, we find that industry tariffs have no effects on formal and
informal wages.
C. Robustness checks: industry size definitions
Our previous estimates were based on a standard criteria regarding industry size catego-ries. The size threshold we used was 15 employees. In this section, we test whether our results are robust to alternative size thresholds.
First, we moved the threshold defining small-size firms to 25 employees (option 1). Second, we moved it to 5 employees (option 2). We then constructed the same two industry size variable following the previous criteria: the share of workers in firms of small size in each industry in 1980 (definition 1), and an indicator variable of small-size industry taking the value 1 when the share of workers in small-size firms in that industry in 1980 was at least 0.5 (definition 2).
Tables 11 and 12 report cross-section and general equilibrium impacts, respectively. Columns 1 and 2 in Table 11 summarize cross-section OLS results and Columns 3 and 4 present IV results. Panel A shows the results obtained when defining industry size according to definition 1. Columns 1 and 2 shows that tariffs have a direct impact
Table 10 Industry tariffs and wage differential between formal and informal workers; switching regression model. Source: Own elaboration based on EPH and Galiani and Porto (2010)
500 bootstrapped standard errors in brackets. Industry size S defined based on the share of small firms in each industry in 1980 (panel A) and as a dummy indicating small industries in 1980 (panel B)
(1) (2)
Formal Informal Formal Informal
A) Definition 1: share of small-size firms in industry
Log of tariffs − 0.164 [1.512] − 0.297 [0.981] 0.001 [0.283] − 0.126 [0.493]
Log of tariffs*S 0.288 [2.262] 0.461 [− 3.871] − 0.029 [0.104] − 0.050 [0.213]
Observations 15,489 5,172 15,489 5,172
R2 0.68 0.58 0.68 0.58
B) Definition 2: indicator of small-size industry
Log of tariffs − 0.152 [0.126] − 0.234 [0.505] − 0.100 [0.162] − 0.168 [0.383] Log of tariffs*S − 0.963 [0.885] − 0.349 [0.678] − 0.034 [0.090] − 0.065 [0.134]
Observations 15,489 5,172 15,489 5,172