R E G U L A R A R T I C L E
Open Access
Social network differences of chronotypes
identified from mobile phone data
Talayeh Aledavood
1*, Sune Lehmann
2,3and Jari Saramäki
1*Correspondence:
talayeh.aledavood@aalto.fi 1Department of Computer Science, Aalto University, Espoo, Finland Full list of author information is available at the end of the article
Abstract
Human activity follows an approximately 24-hour day-night cycle, but there is significant individual variation in awake and sleep times. Individuals with circadian rhythms at the extremes can be categorized into two chronotypes: “larks”, those who wake up and go to sleep early, and “owls”, those who stay up and wake up late. It is well established that a person’s chronotype can affect their activities and health. However, less is known about the effects of chronotypes on social behavior, even though many social interactions require coordinated timings. To study how
chronotypes relate to social behavior, we use data collected with a smartphone app on a population of more than seven hundred volunteer students to simultaneously determine their chronotypes and social network structure. We find that owls maintain larger personal networks, albeit with less time spent per contact. On average, owls are more central in the social network of students than larks, frequently occupying the dense core of the network. These results point out that there is a strong connection between the chronotypes of people and the structure of social networks that they form.
Keywords: Chronotype; Social networks; Mobile phone data; Centrality
1 Introduction
Life on Earth follows a circadian rhythm [1–4]. This circadian pattern includes human activities and sleep, with rhythms reflected at the psychological, physiological, and bio-chemical levels [5,6]. Even though all humans are diurnal and endogenously controlled by an internal circadian clock, there are individual differences in how the internal clock is synced with the environment’s daily rhythm [7,8]. These differences can be classified with threechronotypes[9]. At the two extremes are the morning-active people (“larks”) and the evening-active people (“owls”), and the rest fall in the intermediate category whose rhythms do not deviate much from the population average (note that there are no abso-lute criteria for any given chronotype). It has been shown that a person’s chronotype can change over the course of her life, but it is fairly stable within time periods of the order of a few years [10].
Chronotypes are not independent traits. There has been a lot of interest in the epidemi-ology of chronotypes [11],e.g., in terms of age, gender, personality, income, or health risks [9,12,13]. Chronotypes have been argued to correlate with certain personal or behavioral traits; these include sociosexual orientation [14], personality (see,e.g., [9]), academic per-formance [15], body mass index [16,17], physical and mental health [13,18–20], and how
people make use of their time [21]. However, thesociologyof chronotypes remains less studied, that is, how different chronotypes relate to the structure of social systems.
In this paper, we set out to explore the relationship between chronotypes and social net-works. To the best of our knowledge, this is the first study to do so; the connection between chronotypes and social network structure has remained an unexplored area, even though it is known that chronotypes have a social component. This component is due to social cues that act aszeitgebers(“time-givers”), synchronizing the phases of circadian rhythms [11,22]. Further, many types of social interactions from face-to-face contacts to phone calls require synchronization and a common understanding of their times. Therefore, it is reasonable to expect that chronotypes and social network structure are correlated, espe-cially if the networks are reconstructed from phone calls as in the present study.
In particular, we study whether the chronotypes of people have effects on (i) the features of their personal (ego-centric) network, and (ii) their positions in their social network in terms of how central they are. We take advantage of a rich dataset of digital activity of students, collected for more than a year at the Technical University of Denmark; we use data on∼700 individuals. These data allow us to simultaneously estimate the chronotype of each student and to reconstruct the structure of their social network from the metadata of their phone calls and text messages (caller/callee, sender/recipient). In this experiment, participants were equipped with identical smartphones and they volunteered to install an app that collected, among other things, detailed communication metadata as well as times of the phone screen turning on and off. See Materials and Methods for details and Ref. [23] for a full description of the experiment and recorded data.
Mobile phones have become an important part of most people’s daily lives, and they are commonly used throughout the day. We take advantage of this to identify chronotypes. Rather than using one of the common questionnaires for identifying chronotypes [24,25] that may suffer from recall bias, we identify chronotypes from phone usage. Our identifi-cation is based on data on the times when the participants’ smartphone screens have been switched on (see Materials and Methods for details), using these events as a proxy of a person’s activity level. Even though these data do not fully account for a person’s activity, the frequency of screen-on events is seen to follow a typical 24-hour cycle where longer periods of inactivity coincide with nights. Because there are clear and persistent individ-ual differences in the levels of early-morning or late-night activity, we use them as a way to assess the chronotypes of individuals [26–28].
To reconstruct the social network of the students, we use data on calls and text messages between the study participants, constructing a network where two participantsiandjare linked if there is at least one call or text message fromitojand vice versa. For calculating the total personal network size of each participant (node degree), we also use calls and texts to (anonymized) persons outside the study cohort.
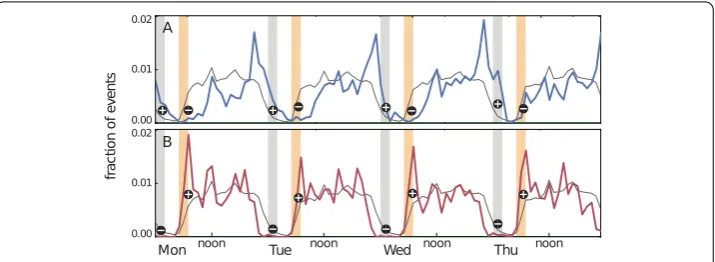
Figure 1Identifying individuals’ chronotypes. The chronotypes of participants are determined by computing the average hourly frequencies of the “screen-on” events of their mobile phones for the first four weekdays. Each participant’s pattern is compared to the population average (solid gray line). For chronotype identification, the gray and yellow time ranges are used. If a participant has above-average levels of activity (plus sign) in the night-time gray time range and below-average levels of activity (minus sign) in the yellow morning time range, she is categorized as an evening-active owl (panel (A)). Participants of the opposite pattern (below-average night-time activity and above-average morning activity) are categorized as morning-active larks (panel (B) depicts the pattern for a morning-active person). For details, see Materials and Methods
2 Results
2.1 Screen-on events can be used for chronotype assessment
We use time-stamped data on “screen-on” events from the smartphone data-collection apps to assign a behavioral chronotype to each participant. Whenever the participant uses the smartphone, from making a call to checking the time, the phone’s screen is turned on, and the data-collection app records the time of this event. We use the frequency of these events as a statistical proxy for the daily activity rhythm of the participant, since frequent screen-on events tell that the participant is awake, and night-time event frequencies are typically low or zero. To form an overview of the daily activity patterns of participants, we aggregate the screen-on event frequencies in hourly time bins for the four weekdays from Monday to Thursday for each of theN= 400 participants who used their phones actively during the whole observation period (see Methods for details; note that for net-work reconstruction more participants were used). A population-level average rhythm is computed for reference.
Figure1shows the screen-on daily rhythms of two study participants (upper and lower panels), together with the population average. The phase of the daily pattern of the student in panel (A) is consistently shifted towards the night, while the student in panel (B) displays a pattern whose phase is shifted towards morning. These phase shifts are captured by the event frequencies in the early morning hours (5 AM to 7 AM) and late hours of the day (midnight to 2 AM); “larks” are associated with above-average morning activity and below-average night-time activity, and the opposite holds for “owls” (see Methods for details). On this basis, 20% of the participants (N= 80) are labeled as larks, 20%as owls (N= 80), and the rest as intermediate (N= 240). These percentages have been chosen to match the literature [11,29] (see Methods). For robustness tests with smaller/larger percentages, see Sect.2.4. For an illustration of the criteria, see panel (A) in Fig.2.
Figure 2Chronotypes and their behavioral differences. Panel (A) displays the criteria for labeling participants as night-active owls (blue) and morning-active larks (red).x- andy-axes represent the difference between morning patterns and evening patterns of each individual’s activity compared to the population average activity rhythm, respectively. Panels (B), (C), (D): Average personal network size, average duration of outgoing calls, and average tie strength as measured by communication frequency, for the three different chronotypes
on estimating an individual’s different sleep parameters—e.g., sleep duration, mid-sleep time—for each night of sleep during the collection period. Because our focus has been on determining each subject’s chronotype, a characteristic that does not change frequently, we have instead used data aggregated over a longer period of time. This makes our results less sensitive to random behavioral variations.
2.2 Owls have larger personal networks than larks
(see Methods). In addition to personal network membership, we count the total number of calls and texts with each contact, as well as the average outgoing call duration. We then study the properties of the personal networks of individuals of each chronotype separately for which we use outgoing calls and text messages.
The average personal network sizes for students of each chronotype are shown in Fig.2(B). It is evident that owls have personal networks that are much larger than those of larks, with the intermediate chronotype positioned in between (owls: network size
k= 70.7±4.1, larks:k= 51.0±2.7, intermediatek= 55.4±1.9). When the average call durations and total frequencies of calls and texts per social contact are considered, an op-posite trend becomes visible (Fig.2(C) and (D)): owls make the shortest calls on average and their communication frequency per social tie is the lowest as compared to the inter-mediate chronotype and in particular to larks. More detailed analysis indicates that owls’ calls are on average shorter than those of other chronotypes at all times of day except at night where the differences are within standard errors (mornings owls/larks: 83/100; afternoons owls/larks 86/103; evenings owls/larks 106/141; nights owls/larks 68/64; all numbers in seconds). This reflects the known sub-linear scaling between node degree and strength in social networks (see, e.g., [33]); the larger the number of relationships, the less time is available for each of them. There are also differences in the numbers of screen-on events for the different chronotypes: the mean of number of screen-on events in weeks 2–51 is 19,829 for larks, 23,509 for members of the intermediate chronotype, and 25,140 for owls.
2.3 Owls are more central than larks in the social network of participants
In order to study the network centrality of each participant, we constructed the social network of participating students, so that two individualsiandjare connected with an unweighted link if there are either calls or text messages fromitojand fromjtoi(see Methods for details). This network consists ofN= 734 participants; out of these, 366 had enough screen-on events to be assigned a chronotype (for filtering criteria, see Methods). We then computed the values of various network centrality measures for all individuals within each of the three chronotypes. The chosen measures were (i) betweenness cen-trality, measuring the number of shortest paths through a network node, (ii) closeness centrality, quantifying the inverted average geodesic distance to other nodes, (iii) eigen-vector centrality, reflecting the level of connectivity to high-centrality nodes in an iterative fashion, and (iv) core number, indicating membership in a core where all nodes are linked to other member nodes with at leastklinks.
These four centrality measures are displayed in Fig.3(panels (A)–(D)), together with a visualization of the network (panel (E)). There is an increasing trend in centrality from larks to owls for all centrality measures: owls are much more central than larks in the network. This is also reflected in the network visualization: owls (blue) are more frequently located in central parts of the network than larks (red).
Figure 3Chronotypes and centrality measures. Chronotypes are associated with network centrality such that owls are on average more central. Panels (A)–(D): network centrality measures (betweenness centrality, closeness centrality, eigenvector centrality, and core number) for the three chronotypes. In all cases, values for the owl chronotype are the highest. Panel (E): a network visualization of the social network of participants. Individuals of the owl (lark) chronotype are displayed as blue (red). The rest are gray. For blue and red nodes, the size is determined by core number. Nodes of the owl chronotype are more frequent in the central core of the network
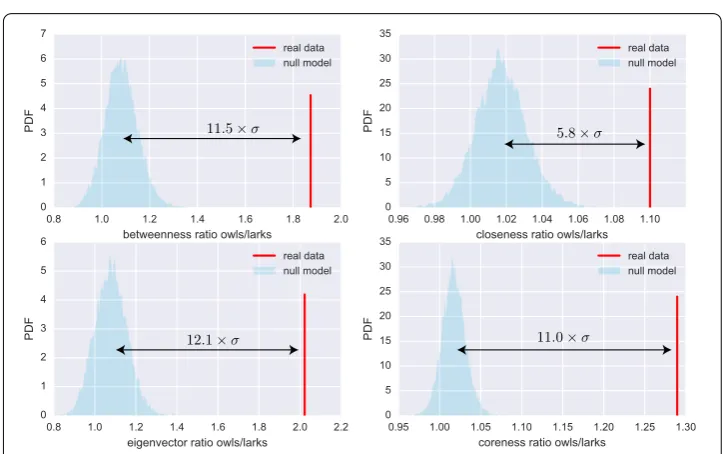
Figure 4Higher degrees of owls do not alone explain their higher centralities. We tested if degrees alone can explain the different centralities of owls and larks. To this end, we applied the configuration model that retains node degrees and chronotypes but randomizes network structure. Panels (A), (B), (C), and (D) display the PDF’s for the owl-to-lark ratios of the four centrality measures in 104realizations of the null model (shaded areas) and in the real data (red lines). The observed ratios are far higher than any obtained with the null model (the arrows indicate the distance in standard deviationsσ). Therefore the higher degrees of owls cannot produce as high owl-lark centrality differences as observed in the real data
model mean. As an example, in the real data, the average eigenvector centrality of owls is twice higher than that of larks. In the reference model, however, the corresponding factor is only 1.07 on average. This means that there is a small effect from the higher degrees of owls (the ratio is 1.07 instead of 1), but it cannot explain the observed factor of two. To summarize, in theN= 104runs of the configuration model, we never observed owl-to-lark
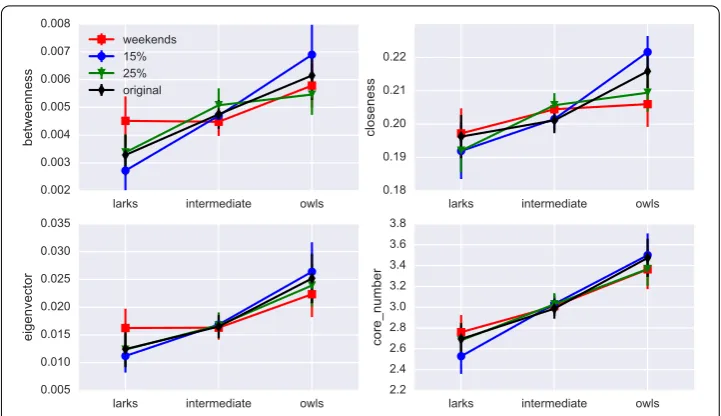
Figure 5Robustness of centrality measures. We tested whether the centrality results are robust against variations in the analysis pipeline. The four measures are shown above, for the original chronotypes (black diamonds), for chronotypes computed using weekend data only (red squares), and for chronotypes with smaller shares of owls/larks (15%, blue circles) and larger (25%, green triangles)
the null hypothesis can be rejected: degrees are not enough to explain why the centralities of chronotypes differ.
2.4 Robustness of results
To test how robust our conclusions are against variations in the analysis pipeline, we have recomputed the results with different parameterizations. In particular, we have deter-mined the students’ chronotypes (1) using data from a shorter time range (half a year instead of the whole year), (2) from screen-on event frequencies from Friday to Sunday instead of Monday to Thursday, (3) with stricter filtering criteria, taking into account only students who have at least 280 screen-on and screen-off events in each week of the study (N= 222), and (4) using smaller and larger percentages of larks and owls (15% and 25% instead of the 20% on which the results so far have been based).
The outcome of the above has been that while there are minor variations in the exact numbers, our results qualitatively hold for all cases (1) to (4). The results for centrality measures are shown in Fig.5.
We have also tested the behavior of eigenvector centrality using edge weights and sep-arately constructed networks from calls and text messages, with the logarithms of their numbers as weights. Eigenvector centrality is suited for working with weights (unlike the other three). The rationale behind keeping the networks separate is that the numbers of calls and texts measure different things: one conversation may take one call but a large number of text messages. The rationale behind taking the logarithm is that the distribu-tions of these numbers are very broad and without the log, the highest-weight link dom-inates the entire measure. However, with log weights, in terms of eigenvector centrality, owls are most central and larks least central in both call and text-message networks.
3 Discussion
There are well-known differences between human chronotypes that have been related to various personal and behavioral traits [9,34,35]. redIn this study, we have focused on the social dimension of chronotypes and investigated how the chronotypes of people are re-flected in their personal network structure and position in social networks. We have used detailed behavioral data collected from volunteer students with smartphone apps in an experiment at the Technical University of Denmark. We have estimated the chronotypes of students from the times of “screen-on” events, and constructed their social network us-ing mutual calls and text messages as proxies of social relationships. We have shown that evening-active owls have larger personal networks than morning-active larks. Owls are also more central in the social network of students; this difference cannot be explained only by their larger personal network size.
Even though chronotypes are partially regulated by social cues, the link between peo-ple’s chronotypes and their social networks has been underexplored. Because our results show for the first time that chronotypes are connected to social network structure, it be-comes clear that they deserve more attention in studies of social networks and spread-ing processes on networks; one should not only focus on other well-studied traits such as age, gender or other socio-demographic features. The connection between social net-works and chronotypes also calls for more attention to social aspects and cues in studies of chronotypes.
It has been shown in the literature that there is a correlation between the evening-active chronotype and extroversion (see [9] for a review). One might reasonably expect that these correlations translate into properties of personal networks such that owls maintain larger communication networks. Additionally, in [36] the authors suggest that in a social network of adolescents sleep behavior, and in particular sleep loss, spreads in the network. These results further hint towards a potential relationship between sleep behavior and social network properties.
Further, the need to synchronize social activities and common social norms may explain the observed differences in personal network size and network centrality. Social gather-ings, including student parties, often take place in the late hours of the day. Because social ties are created and maintained in such events that are more suitable for owls, it is perhaps not surprising that there is a bias in favor of the evening-active chronotype. In contrast, early-morning social gatherings are not common, and it is therefore possible that those with a very early chronotype spend more of their time alone, as there are fewer opportu-nities for social interaction during their day.
The data we use were not originally collected for determining or studying chronotypes. As we used the data for this purpose retrospectively, there is no way of validating the ob-tained chronotypes against common methods such as questionnaires—this would require an experiment of its own. However, it is reasonable to assume that if an individual persis-tently displays above-average levels of early-morning activity and below-average levels of night-time activity, this pattern would be captured with a similar outcome by question-naires developed for assessing chronotypes. In general, the possibility of retroactively de-termining people’s chronotypes from time-stamped data opens a lot of possibilities for research, especially together with our observations that chronotypes are not independent of social network structure (or vice versa). There are many datasets available to researchers from time-stamped mobile telephone calls [38,39] to email records that allow for retro-spectively determining chronotype and reconstructing social networks [27].
4 Materials ans methods
4.1 Experimental data and its filtering
In this work, we used data from a large-scale data collection study, in which 1000 identi-cal mobile phones were distributed among students at Techniidenti-cal University of Denmark (DTU) in 2013. This data collection experiment was designed to measure various aspects of social behavior and human dynamics. In the study, smartphone apps were used to col-lect data with high temporal resolution from various mobile phone sensors. These data were augmented with additional questionnaires that all students in the study filled out. The data collection continued for more than a year; all participants were, however, not ac-tive throughout the whole period. A detailed description of this dataset, types of collected data, and research envisioned by means of the dataset are described in [23]. In the present paper, data from weeks 2–51 of year 2014 are used. Weeks 1 and 52 are excluded, because the former starts in the end of 2013 and the latter coincides with end-of-the-year holidays, which may result in untypical activity patterns. The number of participants that used their phone during this year isN= 804. We apply filters to the data to only include participants who use their phone actively and exclude those who have very little activity or are inactive for a part of the year. The inclusion criteria were: (1) the participant should be active on 80%of the days, (2) during the weeks included in the study (weeks 2–51), the participant should on average have 280 screen-on and screen-off events. After applying these filters, the total number of participants included for further analysis isN= 400. The data and the associated code used for this paper will be made available to researchers upon request.
4.2 Computing the activity patterns of students
For computing the activity patterns of individuals, one week is divided to one-hour bins. As a result, we have a total of 7×24 = 168 bins. For each of the 400 active participants, we go through all screen-on events in the selected study period and assign each event to one of the bins. This way, all events for one person throughout the year are aggregated. These aggregated counts are then normalized so that their values sum to unity. This results in a weekly activity pattern for each person.
4.3 Identifying chronotypes from activity patterns
the literature suggests that individuals may have different behaviors during working days and weekends, and the extent of these differences may vary from one chronotype to an-other [37,40].
We find the population’s average weekly pattern by computing the average of the pat-terns of all 400 participants. Then, for each person, their weekly pattern is compared with the population average in the early hours of the day (5 AM–7 AM) as well as the late hours (midnight–2 AM). To label an individual as a lark, her pattern should lie above the popu-lation average in the early hours, and in addition, in the late hours the difference between the individual’s pattern and the population average should be less than 0.00066. The same applies to identifying owls: at late hours of the night, their pattern should be above the pop-ulation average and in the early morning hours the difference of the individual’s rhythm and the population average should be less than 0.0026. The numerical thresholds for the differences between activity patterns are selected so that 20% of the population is labeled as larks and 20% as owls. These percentages have been chosen to match the literature [11,
29]. The time intervals for early-morning and night-time hours have been selected based on the times when the population average rhythm falls at night and when it begins to rise again in the morning.
4.4 Reconstructing the social network of students
Students in the study were all from the same university and mostly began their studies at the same time. To construct the students’ social network, all individuals in the study who had communication events during the year 2014 were selected (N= 776). In panel (E) of Fig.3, the social links between students in the study is depicted. Out of the 776 students in the network, 393 had an identified chronotype; 7 students with an identified chrono-type were not part of the network because they did not have any calls or text messages. For all panels in Fig.3, incoming and outgoing calls and text messages were used. How-ever, only those social ties were included that were associated with at least one event in both directions (incoming and outgoing), to assure that a tie between two individuals is representative of a social relationship. This left us withN= 734 students in the network.
The dataset also contains calls and text messages between study participants and people from outside the study cohort. This makes it possible to build a more comprehensive pic-ture of each individual’s personal network based on communication events. For the 393 students with known chronotypes, personal network are built from all outgoing calls and texts. There are a total of 20,841 social links for the 393 students; again we only kept so-cial links which were active at least once in each direction. The properties of the personal network shown in Fig.2are based on outgoing communication only.
4.5 Centrality measures andk-shells
The notion of centrality of a network node can be defined in several ways. In this work, different centrality measures are used: betweenness centrality, eigenvector centrality, and closeness centrality. Betweenness centrality is a proxy of the importance of flows in the network, and it is defined on the basis of the number of shortest paths that a node is a part of; the more shortest paths go through a node, the higher its betweenness centrality. The betweenness centralityCb(i) for nodeican be formulated as
Cb(i) =
j<k
σjk(i)
σjk
whereσjkaccounts for the total number of shortest paths from nodejto nodekandσjk(i)
is the number of those paths which go through nodei.
Closeness centrality quantifies how far each node is from all other nodes in the network. The closeness centralityCc(i) for nodeiis defined as
Cc(i) =
1
li
=N– 1
i=jdij
,
whereliis the average length of shortest paths of nodeito all other nodes in the network,
dijis the shortest path between nodesiandj, andNis the total number of nodes in the
network.
Eigenvector centrality is an iterative centrality measure that does not only depend on how well-connected each node is, but also takes into account the centrality of its neigh-bors, such that a node with a small number of central neighbors may outrank one with more less central neighbors [41]. Therefore, it measures how well-connected each node is to other well-connected nodes. Formally, eigenvector centrality of a node is defined as the corresponding element of the eigenvector of the network’s adjacency matrix that cor-responds to its largest eigenvalue.
The other measure we use is the core number which is defined based on the concept of
k-cores.k-cores are maximal subgraphs in the network where all nodes are connected to other nodes in the subgraph with at leastklinks. For a node, the core number is the largest value ofkfork-cores that contains the node [42].
4.6 Null model for centrality measures
For reference, we applied the configuration model that randomly rewires the network while keeping the degrees of nodes fixed (and retaining their chronotypes). This model is designed for testing whether some property of nodes can be explained by their de-grees alone. We investigated whether the higher centralities of owls are caused only by their higher degrees. To this end, we formulated the null hypothesis as “the ratio of the{betweenness, closeness, eigenvector, coreness}centrality of owls to the correspond-ing centrality of larks is fully explained by the degrees of owls and larks.” In other words, the null model posits that chronotypes do not affect the network positions of nodes, only their degrees. If the null hypothesis were true, the owl-lark centrality ratios observed in the original network would not be significantly higher than the ratios observed in the ran-domized networks. To test the hypothesis, we ran the configuration modelN= 104times,
and stored the centrality ratios for each run. Their distribution was then compared to the observations.
Acknowledgements
The authors thank the following people for their help and support at different stages of this work: Ilkka Kivimäki, Bjorn Sand Jensen, Rasmus Troelsgård, Richard Darst, Radu Gatej, and Onerva Korhonen. TA acknowledges the support of EIT Digital doctoral school for her visit to DTU.
Funding
JS and TA were funded by the Academy of Finland, project DigiDay, No. 297195. The funding agencies had no role in design of the research and the data analysis and interpretation.
List of abbreviations
Availability of data and materials
An anonymized version of the data used for this work can be made available upon request.
Competing interests
The authors declare that they have no competing interests.
Authors’ contributions
SL collected the data. TA, JS, and SL designed the research. TA and JS analyzed the data. TA, JS, and SL wrote the paper. All authors read and approved the final manuscript.
Author details
1Department of Computer Science, Aalto University, Espoo, Finland.2Department of Applied Mathematics and
Computer Science, Technical University of Denmark, Kongens Lyngby, Denmark.3The Niels Bohr Institute, University of
Copenhagen, Copenhagen, Denmark.
Publisher’s Note
Springer Nature remains neutral with regard to jurisdictional claims in published maps and institutional affiliations.
Received: 24 April 2018 Accepted: 16 October 2018
References
1. Panda S, Hogenesch JB, Kay SA (2002) Circadian rhythms from flies to human. Nature 417(6886):329–335 2. Dibner C, Schibler U, Albrecht U (2010) The mammalian circadian timing system: organization and coordination of
central and peripheral clocks. Annu Rev Physiol 72:517–549
3. Czeisler CA, Duffy JF, Shanahan TL, Brown EN, Mitchell JF, Rimmer DW, Ronda JM, Silva EJ, Allan JS, Emens JS et al (1999) Stability, precision, and near-24-hour period of the human circadian pacemaker. Science 284(5423):2177–2181 4. Edery I (2000) Circadian rhythms in a nutshell. Physiol Genomics 3(2):59–74
5. Czeisler CA, Weitzman ED, Moore-Ede MC, Zimmerman JC, Knauer RS et al (1980) Human sleep—its duration and organization depend on its circadian phase. Science 210(4475):1264–1267
6. Edgar RS, Green EW, Zhao Y, van Ooijen G, Olmedo M, Qin X, Xu Y, Pan M, Valekunja UK, Feeney KA et al (2012) Peroxiredoxins are conserved markers of circadian rhythms. Nature 485(7399):459–464
7. Horne JA, Östberg O (1977) Individual differences in human circadian rhythms. Biol Psychol 5(3):179–190 8. Kerkhof GA (1985) Inter-individual differences in the human circadian system: a review. Biol Psychol 20(2):83–112 9. Adan A, Archer SN, Hidalgo MP, Di Milia L, Natale V, Randler C (2012) Circadian typology: a comprehensive review.
Chronobiol Int 29(9):1153–1175
10. Lee JH, Kim IS, Kim SJ, Wang W, Duffy JF (2011) Change in individual chronotype over a lifetime: a retrospective study. Sleep Med Res (SMR) 2(2):48–53
11. Roenneberg T, Kuehnle T, Juda M, Kantermann T, Allebrandt K, Gordijn M, Merrow M (2007) Epidemiology of the human circadian clock. Sleep Med Rev 11(6):429–438
12. Tankova I, Adan A, Buela-Casal G (1994) Circadian typology and individual differences. A review. Pers Individ Differ 16(5):671–684
13. Roenneberg T, Merrow M (2016) The circadian clock and human health. Curr Biol 26(10):432–443
14. Jankowski KS, Díaz-Morales JF, Vollmer C, Randler C (2014) Morningness–eveningness and sociosexuality: evening females are less restricted than morning ones. Pers Individ Differ 68:13–17
15. Preckel F, Lipnevich AA, Schneider S, Roberts RD (2011) Chronotype, cognitive abilities, and academic achievement: a meta-analytic investigation. Learn Individ Differ 21(5):483–492
16. Yu JH, Yun C-H, Ahn JH, Suh S, Cho HJ, Lee SK, Yoo HJ, Seo JA, Kim SG, Choi KM et al (2015) Evening chronotype is associated with metabolic disorders and body composition in middle-aged adults. J Clin Endocrinol Metab 100(4):1494–1502
17. Arora T, Taheri S (2015) Associations among late chronotype, body mass index and dietary behaviors in young adolescents. Int J Obes 39(1):39–44
18. Gaspar-Barba E, Calati R, Cruz-Fuentes CS, Ontiveros-Uribe MP, Natale V, De Ronchi D, Serretti A (2009) Depressive symptomatology is influenced by chronotypes. J Affect Disord 119(1):100–106
19. Wong PM, Hasler BP, Kamarck TW, Muldoon MF, Manuck SB (2015) Social jetlag, chronotype, and cardiometabolic risk. J Clin Endocrinol Metab 100(12):4612–4620
20. Merikanto I, Englund A, Kronholm E, Laatikainen T, Peltonen M, Vartiainen E, Partonen T (2014) Evening chronotypes have the increased odds for bronchial asthma and nocturnal asthma. Chronobiol Int 31(1):95–101
21. Kauderer S, Randler C (2013) Differences in time use among chronotypes in adolescents. Biol Rhythm Res 44(4):601–608
22. Allebrandt KV, Teder-Laving M, Kantermann T, Peters A, Campbell H, Rudan I, Wilson JF, Metspalu A, Roenneberg T (2014) Chronotype and sleep duration: the influence of season of assessment. Chronobiol Int 31(5):731–740 23. Stopczynski A, Sekara V, Sapiezynski P, Cuttone A, Madsen MM, Larsen JE, Lehmann S (2014) Measuring large-scale
social networks with high resolution. PLoS ONE 9(4):95978
24. Horne JA, Ostberg O (1975) A self-assessment questionnaire to determine morningness-eveningness in human circadian rhythms. Int J Chronobiol 4(2):97–110
25. Roenneberg T, Wirz-Justice A, Merrow M (2003) Life between clocks: daily temporal patterns of human chronotypes. J Biol Rhythms 18(1):80–90
26. Aledavood T, López E, Roberts SG, Reed-Tsochas F, Moro E, Dunbar RI, Saramäki J (2015) Daily rhythms in mobile telephone communication. PLoS ONE 10(9):0138098
28. Aledavood T, López E, Roberts SG, Reed-Tsochas F, Moro E, Dunbar RI, Saramäki J (2016) Channel-specific daily patterns in mobile phone communication. In: Proceedings of ECCS 2014. Springer, Cham, pp 209–218
29. Levandovski R, Sasso E, Hidalgo MP (2013) Chronotype: a review of the advances, limits and applicability of the main instruments used in the literature to assess human phenotype. Trends psychiatry psychother 35(1):3–11
30. Chen Z, Lin M, Chen F, Lane ND, Cardone G, Wang R, Li T, Chen Y, Choudhury T, Campbell AT (2013) Unobtrusive sleep monitoring using smartphones. In: Proceedings of the 7th international conference on pervasive computing technologies for healthcare. ICST (Institute for Computer Sciences, Social-Informatics and Telecommunications Engineering), Venice, pp 145–152
31. Jayarajah K, Radhakrishnan M, Hoi S, Misra A (2015) Candy crushing your sleep. In: Adjunct proceedings of the 2015 ACM international joint conference on pervasive and ubiquitous computing and proceedings of the 2015 ACM international symposium on wearable computers. ACM, New York, pp 753–762
32. Cuttone A, Bækgaard P, Sekara V, Jonsson H, Larsen JE, Lehmann S (2017) Sensiblesleep: a Bayesian model for learning sleep patterns from smartphone events. PLoS ONE 12(1):0169901
33. Onnela J-P, Saramäki J, Hyvönen J, Szábo G, Argollo de Menezes M, Kaski K, Barabási A-L, Kertész J (2007) Analysis of a large-scale weighted network of one-to-one human communication. New J Phys 9:179
34. Murnane EL, Abdullah S, Matthews M, Kay M, Kientz JA, Choudhury T, Gay G, Cosley D (2016) Mobile manifestations of alertness: connecting biological rhythms with patterns of smartphone app use. In: Proceedings of the 18th international conference on human-computer interaction with mobile devices and services. ACM, New York, pp 465–477
35. Althoff T, Horvitz E, White RW, Zeitzer J (2017) Harnessing the web for population-scale physiological sensing: a case study of sleep and performance. In: Proceedings of the 26th international conference on World Wide Web, pp 113–122. International World Wide Web Conferences Steering Committee
36. Mednick SC, Christakis NA, Fowler JH (2010) The spread of sleep loss influences drug use in adolescent social networks. PLoS ONE 5(3):9775
37. Wittmann M, Dinich J, Merrow M, Roenneberg T (2006) Social jetlag: misalignment of biological and social time. Chronobiol Int 23(1–2):497–509
38. Blondel VD, Decuyper A, Krings G (2015) A survey of results on mobile phone datasets analysis. EPJ Data Sci 4(1):10 39. Saramäki J, Moro E (2015) From seconds to months: an overview of multi-scale dynamics of mobile telephone calls.
Eur Phys J B, Condens Matter Complex Syst 88(6):1–10.https://doi.org/10.1140/epjb/e2015-60106
40. Roenneberg T (2012) Internal time: chronotypes, social jet lag, and why you’re so tired. Harvard University Press, Cambridge
41. Newman ME (2008) The mathematics of networks. In: The new palgrave encyclopedia of economics. Palgrave Macmillan, UK, pp 1–12