American Journal of Astronomy and Astrophysics
2014; 2(6-1): 8-19Published online October 28, 2014 (http://www.sciencepublishinggroup.com/j/ajaa) doi: 10.11648/j.ajaa.s.2014020601.12
New force, global anisotropy and the changes in
ββββ
-decay
rate of radioactive elements
Yuriy Alexeevich Baurov
1, 2, Yuriy Grigoreyvich Sobolev
3, 4, Yuriy Vasilevich Ryabov
51
Closed Joint Stock Company Research Institute of Cosmic Physics, 141070, Moscow Region, Pionerskaya, 4, Korolyov, Russia
2
Hotwater Srl, Via Gioberti, 15, I-56024 San Miniato (PI), Italy
3
Joint Institute for Nuclear Researches, Moscow Region, Dubna, 141980, Russia
4
Nuclear Physics Institute, 250 68 Rez, Prague, Czech Republic
5
Institute for Nuclear Research of Russian Academy of Science, 60 – the October Anniversary Prospect, 7a, Moscow 117312, Russia
Email address:
[email protected] (Y. A. Baurov), [email protected] (Y. G. Sobolev), [email protected] (Y. V. Ryabov)
To cite this article:
Yuriy Alexeevich Baurov, Yuriy Grigoreyvich Sobolev, Yuriy Vasilevich Ryabov. New Force, Global Anisotropy and the Changes in β-Decay Rate of Radioactive Elements. American Journal of Astronomy and Astrophysics. Special Issue: Global Anisotropy, Theory of Byuon, New Force, New Power System, Propulsion, Space Flights. Vol. 2, No. 6-1, 2014, pp. 8-19. doi: 10.11648/j.ajaa.s.2014020601.12
Abstract:
The review of experimental studies results of a global anisotropy of physical space and new interaction in nature based on analyzing fluctuations in the intensity of the β-decay of radioactive elements are presented. The explanation of the results, based on a hypothesis as to the global anisotropy of physical space caused by the existence of cosmological vector potential AG in limits of theory of byuon, is given. It is shown that vector AG has the following coordinates in the second equatorial coordinate system: right ascension α = 293° ± 15°; declination δ = 36° ± 10°.Keywords:
Changes in β-Decay Rate of Radioactive Elements, Global Anisotropy, New Force1. Introduction
There are four interactions (forces) in modern physics only: strong, weak, electromagnetic and gravitational. All modern theories are the gage models. It was shown in [1–5] and first article this Special Issue that with extraordinary variance in the action of a system of spinor and boson fields interacting with an electromagnetic field (δeo(x,t) where eo - electric charge , electric charge, x – some space coordinate; t - time), the potentials of physical fields that are non-measurable from the standpoint of gage theories, become unambiguous and measurable quantities within the space under study, due to violation of the gage invariance within the area of electric charge variation. One of main results of these works is that the expressions obtained for elementary particle masses appear to be proportional to the modulus of a certain vector potential. In these works, this potential is referred to as the cosmological vector potential Ag [5], and it is assumed that if in any area the vector potential of any magnetic system has a component in the direction opposite the vector, then any matter in the area will be ejected from it. It is a new force of nature.
In classic nuclear physics the β – and α – decays of radioactive elements are usually thought to be purely random processes practically not subjected to exterior influences [6, 7].
In recent years the experimental papers are appeared [8 - 18] in which the changes in the decay rates of various radioactive elements sufficiently above the metering errors are recorded. For example, when introducing 7Be into the fullerene 60C in the course of nearly 160 days, the deviation up to 0.83% in the half-life between 7Be in 60C and 7Be in the metal was recorded [8]. In Ref. [9], a non-exponential radioactive decay of nuclei-isomers of 125mTe during uninterrupted measurements of γ-radiation in the course of a year, was also observed.
These changes are shown to have a periodic character [10 – 18]. In the paper [10], annual oscillations when investigating the half-period T1/2 of 32Si (β-decay) from 1982 till 1986 in the Brookhaven National Laboratory (BNL, USA), are found out. In [11] presented are results of T1/2 measurements carried out in Germany, at the “Physicalisch-Technische Bundesanstalt (PTB)”, with the use of an ionization chamber for 226Ra (α – decay).
Note that the paper [19] criticizes studies [10,11] in the context of possible influence of the thermal factor on equipment readings.
American Journal of Astronomy and Astrophysics 2014; 2(6-1): 8-19 9
variations of the decay products flow, but only repetitive duplication of the spectrum forms and their deviation from the Poisson distribution. Ref. [20] contains critical remarks on the work [12].
Let’s explain our first works [5, 13].
For the model of weak four-fermion interaction with a current taken in the form of the sum of weak vectorial current V’ and weak axial (pseudovectorial) current A’ (V’-A’ - interaction), the interaction constants CV and CA have been determined in terms of the new philosophy in [5, 21]
2 4 1 2 5 . 2 2
0 | |
1 3 ) ( 3 4 | | Σ ⋅ = A hc e hc
CV (1)
2 Σ 4 2 0 2
0 4 3 1
2 1 | A | hc e hc e | C
| A ⋅ ⋅
=
Here e0, h, c are elementary electric charge, Planck’s constant, speed of light, correspondingly.
Since the energy of β-decay electrons Еβ ~ |АΣ|, and the probability of β-decay W ~ |CV, A|2Eβ5 in the framework of V’-A’ - interaction [22. 23], with (1) we have W ~ |AΣ|.
Thus, as |AΣ| changes under the influence of vectorial potential of a magnetic system, one might expect W being also changed. This result opened a way for first experiments in this direction [5, 13].
Later it was also shown that the changes in the β-decay rates of radioactive elements ,during laboratory rotation together with the Earth, reveal in the physical space three directions fixed relative stars [15 - 18].
The present article is devoted the new force in nature and the review of experimental studies results of global anisotropy of physical space using the changing in the intensity of the β- decay (dimension of manifestation ≈10-17
cm) of radioactive elements [15-18, 24-26].
2. The New Non-Gauge Force
The first experimental investigations of new force were carried out at experimental facilities of the Kurchatov Institute of Atomic Energy (KIAE) and the General Physics Institute (GPI) of the Russian Academy of Sciences using high current magnets equipped with and torsion and piezoresonance balances from 1987 to 1994 [5, 17, 27-30]. The analysis these experiments discovered the new force and created a base of byuon theory [5,17]. The new force has nonlinear and nonlocal behavior, depending on the changes in a particular total potential AΣ (|AΣ|≤|Ag|), and can be represented by a particular series in terms of ∆AΣ [5, 17, 30].
The expression for the new force takes the form:
1 2 0 ) ( ) ( | | 2 | | X A A A A c A Nm F ∂ ∂ ∂ λ ∂ λ ⋅ ∆ ∆ ∆ ⋅ ∆ ⋅ −
= G (2)
Here N is the number of stable elementary particles in the body (electrons, protons and neutrons), ∆A = ∆AΣ.
The analysis of the specific experimental results with high field magnets (see [5, 17, 27-30]) has led to the following
expression for λ(∆A):
k 1 k k 2 / 3 0 * k A x ct y r A A exp ) A ( ∆ ∆ ∆ λ ∆ λ ⋅ ⋅ ⋅ − =
∑
∞ = G (3)Here r is the radius of the circle where the test body is located on; ∆y is the difference in coordinates y of the sensor and the body [5, 17, 30];
2 3 * 0 ct ) x
( is the part of energy 0 02 2
0 2m |A |c
c m 2
e = G
ν
≈ 33 , which can be acted upon by the electromagnetic
field potentials.
Using the linear term only in the expansion of (2) by ∆А, we obtain the following formula for the modulus of the new force:
F =2Nmνeco2λ12.∆AΣ (∆AΣ/∆X) (4)
Here λ1≈ 10-6 (Tm)-1 is the first coefficient of series (3). Results from experimental investigations of the new force’s characteristics using two different systems were considered in [5, 17, 31]: one and two Sodin high precision quartz gravimeters at GAISh (Moscow State University), and a system of two quartz resonators [17]. Results from experimental studies of the luminosity of plasma created by the pulsed plasmatron in dependence on the position of its axis with respect to ambient space are presented in [17, 32, 33]. It was shown in these experiments that the spatial distribution of the plasma emission intensity is of an explicitly anisotropic nature; i.e., a certain cone of plasmatron axis directions with an aperture on the order of 90°–110° is observed, along the generatrices of which the plasma emission reaches its maximum values. It was shown moreover that vector directed along the axis of the indicated cone had the following coordinates in the second equatorial coordinate system: right ascension α = 293° ± 15° and declination δ = 36° ± 10°. The results from the experiments agree with earlier experiments [5, 17,27-31] to determine the direction of vector Ag (axis of cone) and are most exact until 2011.
The cycle of investigations into the impact of the new force on the rate of β-decay of radioactive elements are performed in [5, 13 18, 24-26]. But to correctly analyze the experimental results given below (It is a difference from first works, see Introduction), we immediately give a more modern interpretation of the influence of the new force on the β-decay rate (see, (4)) as a process having an inter nucleon but not inter nucleus character [34].
Scaling estimates of magnitudes of magnetic vectorial potentials of the Earth (AE) and of the Sun (A ) show them to be equal to ~ 108G⋅cm and ~ 5⋅108G⋅cm in the orbit of the Earth, respectively. That is, rotation of radioactive sources around the Earth and Sun can lead to changes in the magnitude of AΣ by ~ |AE + A | / |AΣ| ≈ 10-3, (|AΣ| ≈ Ag≈ 1,95 1011Gs cm).
Since the first approximation of the new force (4) includes
not only ∆AΣ but
x A
∂
10 Yuriy Alexeevich Baurov et al.: New Force, Global Anisotropy and the Changes in β-Decay Rate of Radioactive Elements
β-decay ∆W may be assumed to be proportional A xA
∂
∂ Σ
Σ ∆
∆ [15,
17] but not only to ∆AΣ as was previously considered in Introduction. Thus it is assumed that the new force can act on the decay of neutron. Let us explain this.
As is known [34], the neutron has a magnetic moment Mn ≈1023erg/G. The scaling estimations show that in connection with such its magnetic moment, an enormous
value x A
∂ ∂∆Σ ≈
1016G may be expected in the vicinity of the
neutron, but at that the value of ∆AΣ from the magnetic field of neutron is not large and equals 103G⋅cm. Since during rotation of radioactive sources together with the Earth around its axis and the motion of the Earth around the Sun the value of ∆AΣ can vary over five orders at the place of these sources from the action of potentials AE and A onto AΣ, the combined influence of two factors from the Earth and the Sun as well as of magnetic field of neutron can create such new force which will be able to act on the neutron life time.
3. New Force and the Changes in
ββββ
-Decay Rate of Radioactive Elements,
First Experiments
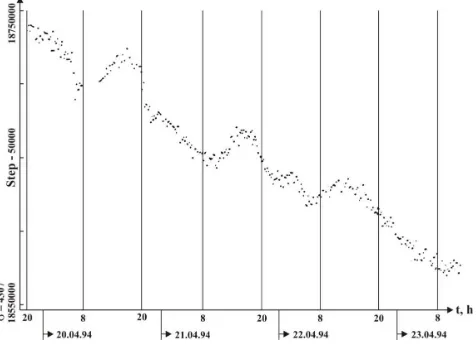
In connection with rich experimental material on the subject we will only briefly show results of initial investigations. In Ref. [5, 13, 17], with the use of scintillation procedure, near daily periodic variations of the β-decay rate of 60Co, 137Cs were first detected. In Figs.1, 2, time variations of decay numbers of 137Cs and 60Co in the runs of experiments of (19-23).04.1994 and (22-23).04.1994, are shown (from an independent measuring channel).
Fig. 1. Time variation of Cs-137 decay number in the run of measurements on Apr.19-23,1994.
As is seen from Fig. 1, a following effect was observed: in the morning hours in parallel with the decrease of readings of an analyzer, a symmetric growth of them was registered. The magnitude of oscillations was equal to ~ 25 thousand photons (at an initial level of ~ 18.6 millions in ~ 16 min) which corresponds to ~ 6σ (σ is the standard deviation, σ = 4307).
The repetition of the effect in the course of the total experimental cycle points to the fact that it is not a random one.
Fig. 2. Time variation of Co-60 decay number on Apr.22-23,1994.
For 60Co (Fig.2), similar oscillations had an amplitude of 20 thousand events at an average level of 8.6⋅106 (at the exposition time of ~ 7 min), i.e. approximately 7σ.
The tangent lines to the Earth’s parallel of latitude (along the parallels, the vector AE is directed) at the place of observation of minimum intensity of the β-decay and of accompanying γ-quanta at 8-10 hours of Moscow time gave, the direction of the new force with an angle α≈ 240o - 270°.
In August-September, 1996, and in February, 1997, two runs of experiments on investigation of 90Sr β-decay count rate were carried out at in the Laboratory for nuclear reactions (FLNR) named after G.N.Flerov, at the Joint Institute for Nuclear Researches (JINR, Russia, Dubna town) [5, 17, 35]. The measurements were made by the scintillation procedure with a 90Sr-source. With the aim of protection from an external magnetic field, the scintillation detector and preamplifier were positioned in a permalloy envelope at a distance of 3 cm from the collimated source. The entire set was situated in a thermostable room where fluctuations in temperature were no more than 2°C for the whole time of measurements. The temperature conditions were checked no more rarely than two times daily. Before each session of measurements, the installation was forced into an operating mode during a week.
American Journal of Astronomy and Astrophysics 2014; 2(6-1): 8-19 11
significance level, the conclusion may be drawn that the experimental and theoretical distributions are different. In our case with the theoretical distribution chosen being uniform, this signifies the non-uniform distribution of the metered quantity in time. The Kolmogorov-Smirnov’s test is convenient also in view of obtaining, in parallel with estimation of confidence level, a point (day time) at which the deviation from uniformity is the maximum. The graphically results are shown in [5, 17, 35]. The Fourier spectrum was shown a half-week and 24-hour periods. The Kolmogorov-Smirnov’s test defined that the maximum of said events corresponds to an angle about 280o degrees.
Let us describe an uninterrupted experiment on investigating variations in the rate of β-decay of 137Cs and 60Co, which was carried out at JINR (Dubna) from 9.12.1998
till 30.04.1999 [16, 17].
The main shortage of experiments was that when analyzing the final result it was impossible exactly to understand which part of that result was due to the “internal life” of the installation itself, and which might be caused just by the phenomenon of interest. In addition the duration of those experiments was no more that two weeks which did not allow to analyze long-period harmonics.
The aim of the experiment in consideration was to tackle the above questions.
The schematic of the installation was shown in [16, 17].The installation consisted of three scintillation detectors two of which were standard spectrometric scintillation detecting units BDEG 2-23 on the basis of NaI (Te)-scintillator (63mm in diameter, 63mm in height) and a photomultiplier FEU-82 with standard divider. One of those units was used for detecting the background radiation, another measured the γ-radiation from the 137Cs source. The third detector was a BGO-scintillator (46mm in diameter, 60mm in height) with a photomultiplier FEU-143 and standard divider, this one was intended for registration of 60Co γ-radiation.
To attenuate the influence of magnetic fields on the photomultipliers, the detectors were shielded. The shields were cylinders (of inner diameter 10cm, height 40cm) made from ten layers of annealed sheet permalloy 0.5mm thick.
The detectors were arranged in such a manner that the FEU photocathodes were from them at a distance of one half the height of the cylinder. The γ-sources were placed immediately on the face surface of scintillators through the center of entrance window.
All detectors, including a temperature-sensitive element, were positioned inside a metallic cube (40×40×50cm3) curved as an additional magnetic shielding. The thickness of steel walls of the cube was 3mm. The detectors with γ -sources were in circled with lead protection 5cm thick.
The system of data registration consisted of two subsystems gathering information in the course of experiment. The first subsystem accumulated count rate information in ten-second time intervals from six paths of scintillation detectors as well as information on temperature, voltages of power source (high voltage for photomultipliers,
~6V in the KAMAK-crate, and ~24V), and impulse noises in the crate’s power supply circuits. The second subsystem of data accumulation was intended to detect “labeled” energy distributions from scintillation detectors for testing stability of their amplitude distribution parameters (thresholds of discriminators, amplitude distribution forms, etc.).
On the basis of long-termed investigations performed with the use of scintillation γ- detectors, some changes in the β– decay rate of radioactive elements with periods of 24 hours and 27 days, were detected. The use of scintillation procedures methods gives results with much better than 5% level of significance using the Kolmogorov-Smirnov’s test. The deviation in the changes of β– decay rate of radioactive elements separate the anisotropic direction in the physical space during the rotation of a laboratorial system together with the Earth with α about 280o degrees.
It is important to note that, for the time period being considered (from December 9, 1998, to April 30,1999), the anisotropy effect in question (directions of the above tangent lines determined with respect to stars and associated with the appearance of extremes in changes in the rate of the beta decay of radioactive elements with a period of about 24 h) became weaker and virtually disappeared from the middle of January 1999.
4. Experiments on the Investigation of
Changes in the in
ββββ
-Decay Rate of
Radioactive Elements with the Use of
Germanium-Lithium Detectors
The results of experimental investigations of the β-decay of 137Cs and 60Co with the aid of detectors allowing to minimize the statistical and systematical uncertainties and more clearly reveal the physical phenomenon, are presented in the [15, 17].
Measurement procedure.
The aim of the experiment was to measure, for greater plausibility of its results, changes in the β-decay rate simultaneously at different points on the Earth and uninterruptedly during a long period of time.
The town Dubna (Russia)and Troitsk (Russia) are nearly at the same (Moscow’s) meridian, the distance between them is ~ 140km. The experiment lasted from the middle of February till the middle of May, 2000.
The experimental technique (schematic diagram, electronic equipment, measurement of backgrounds) at Dubna was the same as in the experiment described in detail in [54], and differed from the latter only in that a Ge(Li)-detector was used. As before (when using a scintillation detector), the intensities of γ-transition from an excited level of a daughter nucleus with energy of 0.661MeV in the course of the β-decay of 137Cs, was measured. The value of the integral of γ-quanta counts entered into the memory of a computer every 10s.
12 Yuriy Alexeevich Baurov et al.: New Force, Global Anisotropy and the Changes in
[5, 13, 14, 16, 17], the γ- registration following of the investigated radioactive nuclei with made it possible to substantially improve reliability of long-term measurements. At detector with a volume of 100 cm3 was used the γ-spectra with energies of 1.117MeV accompanying the β-decay of 60Co. A radioactive placed beyond of the vacuum volume at a from the sensitive surface of the detector. detector and preamplifier from the possible alternating high-frequency and magnetic closed by covers from permalloy and electrolytic a 10cm layer of lead served as a shielding radioactive background. The signal time input signal was equal to 0.5µs at a gain which led the influence of amplitude overload paths to a minimum.
To record the amplitude spectra, a fast converter (ADC) with off-line storage built computer (PC), was used. A control program measuring each spectrum (600s), start instruction, noted the time of transcription of to the PC memory, zeroed the off-line storage, new measurement. The program worked in information sequentially accumulated in the through a long time. The final processing of made off-line by integration over the spectrum intervals of energy from the first channel energy of photopeak (or only the peak resulting formation of a sequence of numbers time dependence of the β-decay rate. The digital load of the detector was no more than per second, i.e. corresponded to the optimum conditions of the instrumentation. The statistical obtained at a one point was 0.03% for the of 60Co.
Thus the measurements were made simultaneously identical Ge(Li)-detectors with two independent systems of information storage in natural 140km apart. One detector measured the decay other did that of 60Co.
Results and discussion.
In Fig.3 and 4 the results of simultaneous the γ-counts rate of at Dubna (137Cs) and respectively, at a period from 1624 (Moscow 15.03.2000 till 10.04.2000 inclusive.
To correlate the results of two experiments, flows from Dubna were averaged over 600s like those at Troitsk, and additionally filtration was made. The results from processed altogether. As is seen from Fig.4,
γ-count rate ranged in that experiment up statistical average. At Dubna these changes than 0.2%. It should be noted that the vicinity of 2180min (Fig.3) was caused by a
New Force, Global Anisotropy and the Changes in β-Decay Rate of Radioactive Elements
following the β-decay a Ge(Li)-detectors e the stability and Troitsk, a Ge(Li)-used for measuring 1.117MeV and 1.332MeV radioactive source was a distance of 7mm detector. To protect the possible influence of fields, they were electrolytic copper, and shielding from the natural constant of the gain factor of 10-20 overload of electronic
fast analog to digital built into a personal program gave the time of start time, storage of a next spectrum storage, and started a a cycle so that the the memory of PC of information was spectrum in various channel to the maximum peak itself) with the numbers reflecting the The statistic-average than (2÷3).104 counts optimum working statistical accuracy radioactive decay
simultaneously by two independent and different conditions spaced decay of 137Cs, the
simultaneous measurement of at Troitsk (60Co), (Moscow time) of
experiments, the values of 600s time intervals, additionally low-frequency Troitsk did not Fig.4, the change in the up to ~0.7% of the changes were no more flow jump in the
a technological
Fig 3. The variation of the flow of γ -137Cs, with the time (JINR, Dubna).
Fig. 4. The variation of the flow of γ -60Co, with the time (INR, Troitsk).
change of the radioactive source detector in the process of refilling nitrogen. The difference in the in the experiments at Dubna
Decay Rate of Radioactive Elements
-quanta accompanying the β-decay of
-quanta accompanying the β-decay of
source relative to the Ge(Li)-refilling a Dewar flask with liquid
American Journal of Astronomy and Astrophysics 2014;
connected with dissimilar measuring procedures: former case the γ-quanta were counted at threshold but at Troitsk one measured the spectra and then determined the total γ-counts over the spectrum. The difference of deviations explained also by that magnetic moments
60Co and 137Cs. However that difference
associated with the different latitude experimental setups.
The observed regular structure in the time the
β
-decay rate for nuclei
137Cs and general, explained by the following reasons:a)temporal instabilities of the electronic b)outside influences and those connected
activity;
c)unknown physical processes in the themselves in the course of long-term d)a “cosmological” factor acting on the
decay of nuclei.
Consider each reason separately for the (that of Dubna, as was mentioned above, detail in [16, 17]).
a)The structure of changes in the count cannot be explained by the slow supply-line voltage (220V). Besides, supply of the electronic circuits was accuracy of 3% and did not vary when voltage was changed within 15%. As spectrometric characteristics of practically do not depend on insignificant high-voltage supply.
b)As for the structural changes in the β due to variations of some external variations of intensity of cosmic radiation, the room temperature, etc, we can say themselves as well as the channels of were carefully protected against variable, and leakage electromagnetic and high The natural background of the Ge(Li) little as about 0.1% of the β-decay radioactive sources investigated. That periodical 7-8 times increase of the explain the structure observed in the β But the count rate of the background the limits of the statistical accuracy. experimentally a possible influence of (idle time) of the electronic paths when background, one simultaneously fed preamplifier a signal from a generator amplitude equal to that of the photopeak frequency 50-100 times more than under conditions. For such spectra, there were in the time dependence of the count rate. c)It is possible that in the material itself detector some yet unknown physical place during the long-term exposure lead to accumulation of charge in “internal”
American Journal of Astronomy and Astrophysics 2014; 2(6-1): 8-19
procedures: in the at a fixed energy the total amplitude counts by integration deviations can be moments of the nuclei of difference can be possibly position of the
time dependence of and 60Co can be, in reasons:
electronic recording paths; connected with the human
the Ge(Li)-detectors term measurements;
the process of the
β
-the setup of Troitsk above, is considered in
rate is such that it variations of the Besides, the low-voltage stabilized with an when the supply-line As is known, the Ge(Li)-detectors insignificant variations of
β-decay count rate influences, daily radiation, changes in say that the detectors of electronic paths variable, alternating, high-frequency fields. Ge(Li)-detector was as count rate of the That is, only a background could
β-decay count rate. background was constant in
accuracy. To evaluate of count overloads when measuring the to the input of the generator with an photopeak but with under the operating were no peculiarities
rate.
itself of the Ge(Li)-physical processes take
to radiation which “internal” capacities,
then to a break-down and would correspond to the the time dependence if the to 24 hours. In such a case quanta would be perturbed, time but this was not observed an influence of capacitive
section itself, control measurements with the use of non-capacitiv similar structure with the time dependencies obtained. Finally consider a possible factor on nuclear processes on 14 ,17], it can be associated with of objects in nature caused cosmological vectorial potential
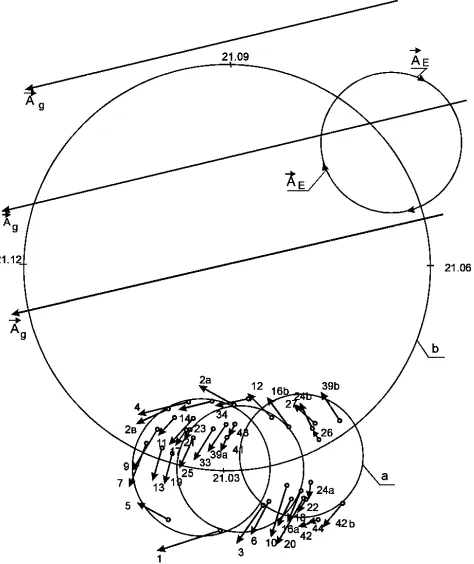
In Fig. 5 and Fig. 6, the small observation of maximum flows
of
60Co at Troitsk as well as flows for the decay of 137Cs at Dubna,Fig. 5. The spatial positions of sites where the magnitude of the flow of γ-quanta 60
Co, were observed (see Fig. 4).
←• - the site of the maximum flow of direction of action of the new force parallel of latitude;
a – the trajectory of motion of the radioactive the Earth
b – the trajectory of motion of the Earth the Sun;
21.03 etc. –the point of the vernal equinox the trajectory “b”;
AE –the direction of the vectorial potential Earth’s dipole;
Ag – the direction of the cosmological vectorial
13
and relaxation of charge. This observable structure form in the “time constant” were close case the amplitude spectrum of γ -perturbed, too, in those intervals of
observed in the experiments. As to capacitive coupling in the amplifying measurements were carried out capacitive current amplifiers, and a the same value was found in the obtained.
influence of the cosmological on Earth. As was said [5, 13, with a new suggested interaction caused by the existence of the potential Ag.
small circles denote places of flows of γ-quanta at the
β
-decay
the maximum and minimum Dubna, respectively.
where the clearly expressed extrema in in the experiment with the β-decay of
of γ-quanta with the indication of the drawn along the tangent line to the
radioactive source rotating together with
Earth and the radioactive source around
equinox and other characteristic points of
potential of the magnetic field of the
14 Yuriy Alexeevich Baurov et al.: New Force, Global Anisotropy and the Changes in
Fig. 6. The same as in Fig.5 but for minimum and quanta during the decay of 137Cs (see Fig.3).
The numbered maxima and minima of flows Fig. 3 and Fig. 4 correspond to number of arrows drawn from place of observation of an extremum to the parallels of latitude (along which potential of the magnetic field of the directed)
As is seen from Fig. 5 and Fig. 6 the total arrows can be clearly divided, by their directions, subsets with an accuracy of ±15°.
In Fig. 6 we have the subsets D1 (7, 9, 11, 23, 25, 33, 39a, 41, 43, 3,6, 10, 16a, 18, 20, (2b, 4, 14, 34, 1, 42, 44), D3 (2a, 12, 16b, Fig.5 these are: T1 (1, 2, 3, 4, 5, 6, 7, 10, 11, T2 (8, 9, 19, 20), T3 (13, 22, 12, 16). The subset be in correspondence with T1, D2 is with T T3. Thus we see, in the same time interval and experimental setups being 140km apart, a behavior of the maxima and minima of the
the different radioactive elements
137Cs The emergence of the set D2, T2 is easily basis of a hypothesis of equiprobable directions of neutron magnetic moments total substance of radioactive source. That always there are neutrons with the magnetic perpendicular to the vector Ag and hence vectorial potential of magnetic field of the always directed, in some region of space,angle of ~140° to Ag corresponding to the maximum
x A
∂
∂∆Σ
and hence of the new force. At that the
subset of arrows D2 T2 gives that of the
New Force, Global Anisotropy and the Changes in β-Decay Rate of Radioactive Elements
maximum flows of γ
-flows of γ-quanta in arrows in Figs.5, 6 extremum tangentially which the vectorial Earth’s dipole is
total set of numbered directions, into three
11, 13, 17, 19, 21, 20, 22, 24a, 42), D2 16b, 24b, 39b, 5). In
11, 15, 17, 18, 21), subset D1 is seen to T2, and D3 is with and at the different similar pattern of the
β
-decay rate for
and 60Co.
easily explicable on the equiprobable distribution of in the nuclei and That is, in any source magnetic moments being hence the lines of the the neutron will be under an efficient maximum value of
the direction of the
the vector Ag with
α≈ 285°±15°. The subsets of to directions of the cone generatrices
Thus the experiment considered confirmed the results of earlier
of changes in the β-decay rate of as has refined the direction of the
Thus, the experiments reported performed at different research experimentalists who used different indicate that a long-term observation radioactive elements reliably decay rate with a period frequently However, these periods always observation of the effect, the lines the Earth’s surface at the position pass through three specific spatial The time interval within which decay rate are observed may addition to the aforementioned
5. New Force and the
Experimental Investigation
ββββ
-Decay Rate Variation
This experiment was carried from 28.12.2010 till 08.02.2012 preliminary results of the experimental decay rate in period 2010 February the presence the two of the above 17].
In 2010 the experimental installation during which in particular the on the results was investigated results has shown the necessity experimental installation into the high level stability of the scintillation detectors.
The present paper is a continuation set forth in [5, 13–18] and [24], experimental investigation method expenses to minimize systematic registration of 60Со β-decay rate longer intervals.
The experimental installation The choice of radioactive source results of previous experiments possibility to maximize the natural force responsible for changes radioactive elements and to minimize analysis of experimental results shown that the β-decay rate deviation radioactive elements having the magnetic moment. This condition action maximum of the new force.
β source 60Co was chosen for the of two lines in its spectrum (1.117
Decay Rate of Radioactive Elements
arrows D1 T1 and D3 T3 point generatrices of new force action.
considered has qualitatively earlier experiments on investigation of radioactive elements as well the vector Ag.
reported here, which were research centers by different groups of different experimental procedures, observation of the beta decay of reveals changes in the beta-frequently equal to 24 h and 27 d. always arise when, at the instant of lines tangent to the parallels on position of the respective laboratory spatial directions (see Fig. 5,6). which extreme changes in the
beta-be 18.5 h and about 30 h, in 24 h.
the Last Results of
Investigation of
60Co
Variation
carried out in JINR, Dubna, Russia 08.02.2012 [25]. Ref. [24] presents experimental study of the 60Co β
-February-August which confirmed above three spatial directions [15,
installation was being debugged, the influence of the temperature investigated. Analysis of the [24] paper necessity of placement the the thermostatic regulator with the temperature, while using
continuation of the investigations ], and designed to develop the method without considerable systematic errors of the experiment in rate changes within a day or
American Journal of Astronomy and Astrophysics 2014; 2(6-1): 8-19 15
allows synchronously observe the above indicated γ-quanta accompanying the β-decay of 60Co and minimize electronics-dependent systematic experimental errors.
Let’s shortly describe experimental installation.
The experimental installation is placed in the thermostatic regulator that keeps temperature within the limits 30.6°C ± 0.1°C. The detecting module of installation contains a radioactive β source 60Co and is two-arm scintillation
γ-spectrometer in hermetic case. Either of the two detectors records about 32 thousand γ-quanta per second. LaBr3(Ce) crystal is used as scintillation counter, relative energy resolution of which equals 3%. The crystal has 25 mm in diameter and 12 mm in height. The flowchart of the
γ-spectrometer electron system is shown in Fig. 7. The electron system consists of two identical microprocessor-based information processing assemblages and common control-feed assembly on the motherboard. To receive synchronization signal, the apparatus has an interface CAN on the motherboard.
Fig. 7. Gamma-spectrometer flowchart.
HV – High Voltage, PM – photomultiplier, AF - amplifies-forms, TD – thermal detector, DU - discriminator unit, PLIC - programmable logic integrated circuit, ADC – analog-digital convertor, MC – microcontroller, LPC – power supply latching circuit.
The light pulses generated in the active zone of scintillation detectors are transformed into electron pulses by multiplier photocells PM-1 and PM-2. The signals from MPs are additionally amplified and formed by amplifies-forms AF-1 and AF-2. The formed pulses are further transmitted to the discriminator units DU2-1, DU2-2, and two microprocessor assemblies containing a microcontroller MC, discriminator units DU5, and a programmable logic integrated circuit (PLIC). Each discriminator unit DU2-1, DU2-2 contains two discriminators which thresholds are adjusted for detection of the pulse in the range from 0.3 MeV to 3 MeV. The coincident pulses in both channels are recorded by counters. The reference voltages of the discriminators come to the microcontroller ADC and get stored there. The discriminator unit DU5 contains five
discriminators adjusted for pulses registration in the energy ranges >0.3 MeV, > 1.1 MeV, > 1.3 MeV, > 1.6 MeV, and 2.8 MeV for further spectral analysis. The reference voltages of this discriminator are transmitted to the microcontroller ADC.
The pulses count is summarized each 10 seconds interval, then read out by microcontroller and recorded into the external memory realized on microdrives that allow data recording onto replaceable 2 GB memory cards. The temperature is also registered at several specially separated points of the apparatus and recorded. Information is read out from the memory cards within the interval from 10 days to 3 months.
Fig. 8. 60Со γ-ray radiation spectrum, recorded by use of LaBr 3(Се) scintillation counter.
The number of γ-quanta per channel (N/channel) is plotted against the axis of ordinates, and the number of n-th channel - against the axis of abscissas. Characteristic lines 60
Со (1.17MeV and 1.33MeV), natural isotope impurity 40К
(1.41MeV) and impurity of heavy radioactive elements (2.5MeV) are indicated with numbers.
Characteristic γ-ray radiation spectrum is shown in Fig. 8. It should be noted that the spectrometer energy calibration can be easily done. Three lines 1.173 MeV, 1.332 MeV and 1.41 MeV are clearly separated in the spectrum. The latter belongs to 40К natural isotope impurity. Around the energy range ≈ 2.5 MeV there is an enhancement caused by overlapping of the signal from natural impurity of heavy radioactive elements. These signals does not interfere normal running of the experiment, moreover it can be used in spectrometer calibration.
The results of experiment
The present paper contains results of the experiment on the study of deviations in 60Co β-decay from the standard exponent. The exposition covers the period from December 28, 2010 to February 08, 2012.
16 Yuriy Alexeevich Baurov et al.: New Force, Global Anisotropy and the Changes in β-Decay Rate of Radioactive Elements
end of July was caused by the thermostatic regulator failure to maintain temperature due to heat wave in Moscow that time, in consequence of which the temperature of premise exceeded that preset for thermostatic regulator (30.6°С ±
0.1°С). Temperature variations level (except for the above abnormality and short periods of memory cards removal) didn't exceed 0.2°. The data analysis reveals correlation between the intensity of γ-quanta and the temperature value. The corresponding small correction is applied to the quanta counting value and does not influence obtaining the consistent results.
Fig. 9. Daily average N - γ-quanta counts (1) with the threshold > 0.3Mev for the first channel and T - daily mean temperature (2) in relative units (r.u.) for the stated period December 28, 2010 - February 08, 2012 (point on the abscises axis – the 28th of every month).
Two methods are used to analyze the results obtained: Fourier data sequence analysis method and Kolmogorov - Smirnov (K-S) statistical method [5,14, 16, 17].
Let’s repeat К–S criterion is based on computation of maximum difference between the theoretical hypothesis of the uniform distribution of γ-quanta in the course of a day and the experimental distribution function. The criterion value for two decades under the experiment is shown in Fig. 4 and Fig. 5 on the vertical (K-S) axis. There is a table with
К–S tabulated values for the given hypothesis and obtained data correspondence probabilities. In the pictures the horizontal line with the significance level (а), a = 0.0125 (Fig. 10) and a = 0.3 (Fig. 11) corresponds to the criterion compliance probability. If К–S goes above the horizontal line, the hypothesis is rejected with probability, for example, 0.9875 (Fig. 10), therefore there is statistically significant difference between the experimental and theoretical distributions. In the case under consideration, where theoretical distribution is selected to be uniform, this means non-uniformity of the measured value within the time of a day.
For the present study we selected the periods 10 days each. Intensity in the γ-γ coincidence channel was under investigation. We were interested in a daily variation of γ-γ
counting. To increase accuracy within 24-hour period we added material 10 days in succession, i.e. the first point of the first day was matched with the first point of the second day, followed which the two rows were added. The same was made for the rest days. There is another one peculiarity of the
present work. From the reference series only those intervals were selected (count for 10 seconds) in which the counting value exceeds the local average for 2σ, where σ is a statistical error within the given interval. The series obtained in this way is to be considered below.
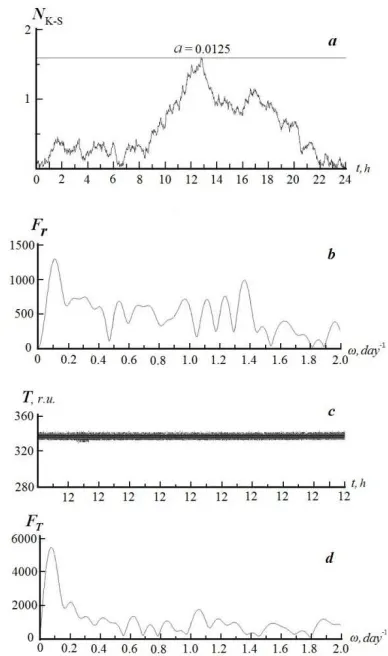
Fig. 10. Analysis results for the decade April, 22 - May, 02, 2011in a coincidence series (G/G): a – non-uniformity assessment of γ-quanta series distribution, exceeding 2σ, by К-S criterion (NК–S criterion values are plotted against the axis of ordinates, the horizontal line corresponds to NК–S criterion value with the significance level a = 0.0125) over the 24-hour period (the Moscow time t, hours, is plotted against the axis of abscissas); b - Fourier spectrum FR for γ-quanta series, exceeding 2σ; c - the temperature series T values in r.u.; d - Fourier spectrum FT for the temperature series.
Estimation by К–S test marked only four decades with the significance level а less than 0.3:
March 11-21, with the significance level a = 0.1; temperature correlation ~ 0.05%;
April 22 - May 02, with the significance level a=0.0125; temperature correlation ~ -0.04%; June 24 - July 04, with the significance level a=0.05; temperature correlation ~ 2.1%;
August 04 - 14, with the significance level a=0.05; temperature correlation ~ 0.2%.
American Journal of Astronomy and Astrophysics 2014; 2(6-1): 8-19 17
harmonics with the highest power for the main and temperature series do not coincide. Fig. 10 shows the temperature stability in relative units (r.u.) without hourly harmonics for the reference series (deviation ± 1.5%). Figure 11 shows the analysis result for the decade July 23 - August 02, 2011, where the temperature perturbation was observed (Fig. 9) caused by heat wave in summer 2011 and thermostatic regulator failure to maintain preset temperature. As figure shows, the daily temperature harmonic, observable in the figure, practically does not influence the rise of the power of cophasal harmonic in the main γ-quanta spectrum. With that К–S criterion value does not reach the limiting significance level of 0.3.
Fig. 11. Analysis results for the decade July 23 - August 02, 2011, in a coincidence series (G/G) depending on NК–S criterion value (the horizontal line corresponds to NК–S value with the significance level a = 0.3) over the 24-hour period. All designations are the same as in the Figure 4.
Now consider possible long-periodic harmonics in 60Со
decay rate. A classical exponential decay with half life T1/2 = 5.2±0.3 years is observed, that corresponds to the tabular value 5.2713(8) years [36]. Measured values T1/2, obtained by decades (selected decades with minimal temperature
correlation) for the period December 28, 2010 - February 08, 2012, are shown in Figure 12. Some decades represent deviations from the tabular value T1/2, but they are not beyond the measurement accuracy range.
Fig. 12. The half-decay time T1/2 of 60Co measured in 10 day intervals.
The period of time are selected points when temperature variation is small. T1/2 values are plotted against the axis of ordinates.Decades (D), the less temperature correlated, are plotted against the axis of abscissas. The standard deviations are shown.
10-days and 20-days periods in decay rate change were detected by applying Fourier analysis, which seems to be artefact caused by memory cards replacements. Additionally the data indicate the existence of 27-day period.
Fig. 13. The spatial positions of sites where the clearly expressed extrema in the magnitude of the flow of γ-quanta in the experiment with the β-decay of 60Co, were observed in [17] (see Figs 5,6 too).
←•- the site of the maximum flow of γ-quanta with the indication of the direction of action of the new force F drawn along the tangent line to the parallel of latitude;
21.03 etc. –the point of the vernal equinox and other characteristic points of the trajectory of motion of the Earth and the radioactive source around the Sun;
AE –the direction of the vectorial potential of the magnetic field of the Earth’s dipole;
AS –the direction of the vectorial potential of the magnetic field of the Sun’s dipole;
AG – the direction of the cosmological vectorial potential.
18 Yuriy Alexeevich Baurov et al.: New Force, Global Anisotropy and the Changes in β-Decay Rate of Radioactive Elements
experiment with the β-decay of 60Co, were observed in [24, 25] are shown in Fig. 13.The direction of vector Ag in Fig. 13 is the direction of the cosmological vectorial potential was defined in [17, 32, 33] (right ascension α = 293° ± 10°; declination δ = 36° ± 10°.). We see that the directions of new force action in decades April 22 - May 02 and June 24 - July 04 coincides with the direction of vector Ag. The directions of new force action in decades March 11-21 and August 04 – 14 coincide with the generatrices of the revealed cone of new force action [17, 32, 33].
6. Discussion and Conclusion
Standard representations can't help in explaining the obtained last results, i.e. 60Со decay rate changes and other results of this article connected with changes in β-decay rate of radioactive elements. Therefore it is taken to be a new force in nature that is able to influence neutron decay in 60Со nucleus and the nucleuses other radioactive elements. The physics of assumed new force is described in beginning of article (see [5, 17]), and its influence on the β-decay is discussed also in [5, 15, 17, 24,25]. Let us briefly elucidate its nature. In the framework of a non-calibration theory of formation of physical space and world of elementary particles (Byuon theory), a part of the mass of elementary particle associated with the process of formation of its internal physical space is proportional to the modulus of summary potential AΣ. The magnitude of AΣ modulus cannot
be more than the modulus of the cosmological vectorial potential Ag , a new fundamental constant got first in [1]. If
the magnitude of AΣ is diminished by any way, the particle
will be acted upon by the new force throwing out substance from the region with diminished modulus of AΣ. In our experiments the magnitude of AΣ decreases due to the action
of the Earth’s vectorial potential AE being in opposition to the vector Ag practically at a tangent to the Earth’s parallel. The cause is the decrease of the vector potential of the Sun’s dipole component As entering into AE. In April 2011, As was directed like Ag, and October is in opposition to Ag. Therefore in April we can diminish the magnitudes of As and hence Ag due to AE but cannot in the second half year (from middle July till middle January) since in that time the vector As has no components directed equally with Ag but only oppositely to Ag. It should be highlighted once more that in this case we cannot decrease masses of particles by the action of vector AE. In this connection we see the maximum effect in April (for a given solar cycle).
Obtaining a result in one decade of August, 2011 (04.08– 14.08) and its absence in the same decade in 2010 is indicative of the approaching change in dipole component polarity of the Sun's magnetic field, which occurs every 11 years. The last similar process took place in 1999-2000 and lasted about 280 days [20]. After the Sun's magnetic dipole polarity is changed, the maximum effect is to be observed in October.
It is important to note that, for the time period being considered (from December 9, 1998, to April 30,1999), the anisotropy effect (period about 24 h) became weaker and
virtually disappeared from the middle of January 1999. It is clear because the maximum effect is to be observed in October.
In such a way the experiment results confirmed some previously obtained results. As well, they conform with anisotropic properties of the physical space, specified in [37], based on the annual oscillations data analysis while investigating 32Si and 226Ra half-decay periods [10, 11], being actively discussed in the references [19, 38, 39].
The quantity of works devoted by the investigation of decay rate changes of radioactive elements are ever increasing [40 - 42].
Acknowledgments
Authors express gratitude acad. RAS S.T. Belayev, Acad. RAS Yu.Z. Oganeseyan for support this investigations, Prof. V.A. Nikitin and other researchers from JINR (Dubna) because of participation in work [24, 25] and to all NUCLEUS-2011 International conference (October 10-14, 2011, Sarov, Russia), NUCLEUS-2012 International conference (June 25-30, 2012, Voronezh, Russia), NUCLEUS-2014 International conference (July 1-4, 2014, Minsk, Belarus) participants for fruitful discussion of the experimental results.
References
[1] Yu.A. Baurov, Yu.N.Babaev and V.K.Ablekov, Dokl. Akad. Nauk SSSR, vol. 259, No. 5, p. 1080, 1981.
[2] Yu.A. Baurov, Yu.N.Babaev and V.K.Ablekov, Dokl. Akad. Nauk SSSR, vol. 262, No. 1, p. 68, 1982.
[3] Yu.A. Baurov, Yu.N.Babaev and V.K.Ablekov,Dokl. Akad. Nauk SSSR (DAN), vol. 265, No. 5, p. 1108, 1982.
[4] Yu.N.Babaev, and Yu.A. Baurov, On the Origin of Fundamental Constants and Some Quantum Numbers, Preprint of Institute for Nuclear Research of the USSR Academy of Sciences, No. P–0362, 1984.
[5] Yu. A. Baurov “On the Structure of Physical Vacuum and a New Interaction in Nature (Theory, Experiment and Applications)”, Nova Science, NewYork, 2000.
[6] Y.M.Shirokov, N.P.Yudin, Nuclear Physics, Second edition, Moscow, “Nauka”, 1980 ,(in Russian).
[7] D. N. Trifonov, Radioactivity Yesterday, Today, Tomorrow,Atomizdat, Moscow, 1966, p. 91, (in Russian).
[8] T. Ohtsuki et al., Phys. Rev. Lett. 93, 112501 (2004).
[9] S. K. Godovikov, Pis’ma Zh. Eґksp. Teor. Fiz. 79, 249; (2004) [JETP Lett. 79, 196 (2004)].
[10] D. E. Alburder, G. Harbottle, and E. F. Norton, Earth and Planet. Sci. Lett. 78, 169 (1986).
[11] H. Siegert, H. Schrader, and U. Schotzig, Appl. Radiat. Isot. 49, 1397 (1998).
American Journal of Astronomy and Astrophysics 2014; 2(6-1): 8-19 19
[13] Yu. A. Baurov and V. L. Shutov, Prikladnaya Fizika, No. 1, 40 (1995)., (in Russian)
[14] Yu. A. Baurov, A. A. Konradov, V. F. Kushniruk and Yu. G. Sobolev, Scientific Report № E7-97-206, (Dubna, 1997), p.354.
[15] Yu. A. Baurov, A. A. Konradov, E. A. Kuznetsov et al., Mod. Phys. Lett. A 16, 2089 (2001).
[16] Y. A.Baurov, Yu.G.Sobolev, Y.B.Ryabov, V.F.Kushniruk., Phys. Atom. Nucl. 70, 1825 (2007).
[17] Yu. A. Baurov, Global Anisotropy of Physical Space. Experimental and Theoretical Basis (Nova Science, NY, 2004).
[18] Yu. A. Baurov, Bull. Russ. Acad. Sci. Phys. 76, 1076 (2012).
[19] J. C. Hardy, J. R. Goodwin and V. E. Iacob, Arxiv: 1108.5326.
[20] A. V. Derbin et al., Uspehi phys. Nauk, 170, 209 (2000) (in Russian).
[21] Yu.N.Babaev, and Yu.A. Baurov, Neutrino in discrete space and cosmology, Preprint of Institute for Nuclear Research of the USSR Academy of Sciences, No. P–0386, 1985.
[22] L.B.Okun’, Leptons and quarks, Moscow, “Nauka”, 1990 (in Russian).
[23] N.F.Nelippa, Physics of elementary particles, Moscow, “Vysshaya Shkola”, 1977 (in Russian).
[24] Yu.A. Baurov, N. A. Demchuk, A. Yu. Baurov, A. Yu. Baurov (Jr..), V.B. Dunin, V.V. Tihomirov, S.V.Sergeev, Prikladnaya fizika 5, 12 (2011).
[25] Yu. A.Baurov, V.A. Nikitin, V. B. Dunin, N. A.Demchuk, A. Yu.Baurov, A. Yu.Baurov (Jr.), V. V. Tihomirov, S. V. Sergeev, arXiv:1304.6885 [nucl-ex].
[26] Yu.A. Baurov, Am. J. Mod. Phys., vol. 2, pp. 177–184, 2013.
[27] Yu.A.Baurov, E.Yu.Klimenko, and S.I.Novikov, DAN, v.315, p.1116, 1990.
[28] Yu.A.Baurov, E.Yu.Klimenko, S.I.Novikov, Phys. Lett. A., v.162 p.32, 1992.
[29] Yu.A.Baurov, P.M.Ryabov, DAN, v.326, p.73, 1992.
[30] Yu.A.Baurov, Phys.Lett. A., v.181, p.283, 1993.
[31] Yu. A. Baurov and A. V. Kopaev, Hadronic Journal, Vol. 25, pp 697-711, 2002.
[32] Yu.A. Baurov, et al., Phys. Lett. A311, p. 512, 2003.
[33] Yu.A. Baurov, A.G. Znak, V.G. Farafonof, Advances in Plasma Physics Reseach, Volume 5, pp. 179-196, editor Francois Gerard, 2007.
[34] Y.M.Shirokov, N.P.Yudin, Nuclear Physics, Second edition, Moscow, “Nauka”, 1980 (in Russian).
[35] Yu.A.Baurov, A.A.Konradov, V.F.Kushniruk, Yu.G.Sobolev, in Scientific Report 1995-1996, “Heavy ion Physics”, E7-97-206, p.354-355, JINR, Dubna.
[36] G. Audi, O. Bersillon, J. Blachot and A. H. Wapstra, Nuclear Physics A 729, 3, 2003.
[37] Yu. A. Baurov, I. F. Malov, Int. J. Pure & Appl. Phys. 6, 469. 2010.
[38] J. H. Jenkins et. al. Astro-ph/0808.3283, 25 Aug. (2008).
[39] 23. E. Fischbach et. al. Space Sci. Rev. 145, 285 (2009).
[40] Bellotti et.al. Phys. Lett. B,710, 114 (2012).
[41] J.H. Jenkins, E. Fischbach, D. JavorsekII, Robert H. Lee, P.A. Sturrock, Appl. Radiat. Isot. 74, 50 (2013).


![Fig. 13. The spatial positions of sites where the clearly expressed extrema in the magnitude of the flow of γ-quanta in the experiment with the β-decay of 60Co, were observed in [17] (see Figs 5,6 too)](https://thumb-us.123doks.com/thumbv2/123dok_us/8467859.1710404/10.595.63.275.245.638/spatial-positions-clearly-expressed-extrema-magnitude-experiment-observed.webp)
