http://www.sciencepublishinggroup.com/j/ajce doi: 10.11648/j.ajce.20190701.14
ISSN: 2330-8729 (Print); ISSN: 2330-8737 (Online)
A Logistic Model Predicting Occurrence Probability of
Debris Flow
J. P. Wang, Yijie Wu
Civil Engineering, National Central University, Taoyuan, Taiwan, Republic of China
Email address:
To cite this article:
J. P. Wang, Yijie Wu. A Logistic Model Predicting Occurrence Probability of Debris Flow. American Journal of Civil Engineering. Vol. 7, No. 1, 2019, pp. 21-26. doi: 10.11648/j.ajce.20190701.14
Received: January 17, 2019; Accepted: April 2, 2019; Published: April 28, 2019
Abstract:
This paper presents a logistic model for predicting the occurrence probability of debris flows based on rainfall intensity and duration. The data from a total of 354 rainfall events were used to calibrate the model, among which 249 were triggering a debris flow while 105 were not. The model will be useful to the decision making of debris flow early warning in the future. That is, given the estimated occurrence probability = 70% subject to a combination of rainfall intensity and duration, there is a 30% probability that the early warning will be a false alarm. By contrast, if decision makers decide not to issue an early warning, then there is a 70% chance leading to a missed alarm. Subsequently, integrating the consequences of missed alarm and false alarm into the equation, the respective risks can be computed, based on which decision makers can make a more robust decision whether an early warning is needed or not by choosing the scenario with a lower risk.Keywords:
Debris Flow, Logistic Regression, Occurrence Probability1. Introduction
This paper introduces a new logistic model for predicting the occurrence probability of debris flow. The two predictors (or independent variables) used in the model are rainfall intensity and duration. The model that can estimate the occurrence probability of debris flow is useful to the decision making whether an early warning is needed to be issued or not for risk reduction and management.
In this paper, the relevant studies will be summarized at first, followed by the overview of logistic regression. Next, the calibration of the logistic model will be introduced, along with the data used for the model development. Finally, a framework using the logistic model for debris flow early warning will be presented and discussed.
2. Literature Review
2.1. Debris Flow
The debris flow is one of the natural hazards causing damages to our society, and a variety of debris flow studies have been reported [1-30]. For instance, Guo et al. (2016) [1] studied the effect of the Wenchuan earthquake on the
occurrence of debris flows in the Sichuan areas of China, and reporting that debris flows occurred more frequently in the areas after the major earthquake. Based on the data from that study, Wu et al. (2018) [2] then conducted another analysis and proposed a new optimization method to determine the rainfall intensity-duration threshold that can minimize the probability of false alarm and missed alarm combined. In addition, Tang et al. (2018) [3] presented a joint probability model that can capture the statistical characteristics of the maximum impact pressure and total sediment discharge of a debris flow, which can help develop the design guideline for constructing a barrier structure to mitigate the damage caused by debris flows.
2.2. Logistic Regression
Although logistic regression is not as commonly used as simple regression, a number of applications can still be found in the literature. For example, given that the occurrence of soil liquefaction is a binary variable, Lai et al. (2006) [4] proposed a logistic regression model to predict the occurrence probability of soil liquefaction. Similarly, given that the occurrence of landslide is also a binary variable, Chang et al. (2007) [5] developed a logistic model to estimate the occurrence probability of landslide.
3. Model Development
3.1. Overview of Logistic Regression
On the basis of a X-Y system, i.e., X is a continuous variable while Y is a binary variable, the mathematical expression of a logistic model can be expressed as follows:
Pr( ; )
1
ax b ax b
e Y Yes X x
e +
+
= = =
+ (1)
where a and b are the mode parameters that can be calibrated with X-Y samples. It is noted that the probability of Y = No is clearly equal to {100% - Pr (Y = Yes)} that can be computed from the model, i.e., Eq. 1. Also note that different than simple regression that uses the principle of the least-square algorithm to calibrate the model parameters, logistic regression usually uses the MLE (maximum likelihood estimation) algorithm to calibrate the model parameters.
It should be understood that Eq. 1 can be extended when more than one “predictor” is used for estimating the probability of Y = Yes. Except for the equation that will be changed to accommodate more X, i.e., the predictor, the calibration process of the logistic model will not be changed, or it will be as same as the X-Y system using only one predictor to predict the occurrence probability of Y = Yes.
3.2. The Data
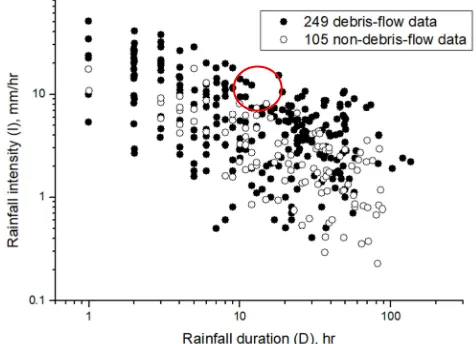
Figure 1. The 354 data sets used in this study for developing the logistic model to estimate the occurrence probability of debris flow
Figure 1 presents a total of 354 data sets, namely rainfall
intensity (I), rainfall duration (D), and debris flow occurrence. The data from the Sichuan areas of China were compiled by Guo et al. (2016) for their debris flow study investigating the effect of earthquake on debris flow occurrences. As mentioned previously, Wu et al. (2018) utilized them in their study as to determine the optimal rainfall intensity-duration threshold that can minimize the probability of missed alarm and false alarm combined.
3.3. The Model Development
Based on the data sets shown in Figure 1, the model calibration was proceeded with an in-house computer program compiled in VBA (Visual Basic for Application). The result shows that the best-fit model parameters are 3.6, 6.3, and -7, or the mode can be expressed as follows:
Pr( ) 1
aD bI c aD bI c
e DF
e + +
+ +
=
+ (2)
where DF denotes debris flow, and Pr (DF) is the occurrence probability of debris flow. Based on the model, it shows that when a rainfall event has an intensity = 1 mm/hr and duration = 1 hr, the occurrence probability of debris flow is equal to 0.00091, which means that such a rainfall is nearly impossible to trigger a debris flow, and in accordance to the boundary condition that debris flows are induced by heavy rainfalls, and it is very unlikely for them to occur with little rainfall.
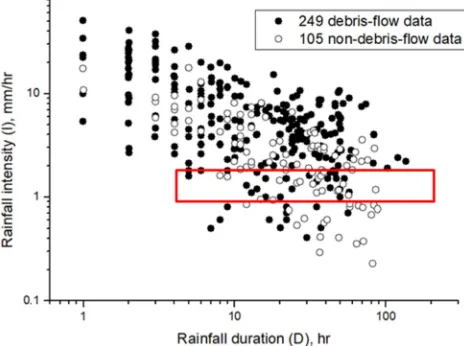
On the other hand, when rainfall intensity = 10 mm/hr and duration = 10 hours, the model, i.e., Eq. 2, estimates the occurrence probability of debris flow should be equal to 0.95, which is also in accordance with the observation, highlighted in Figure 2, showing that in most cases debris flows were triggered under such a rainfall with intensity and duration close to 10 mm/hr and 10 hours, respectively.
Figure 2. Debris flow occurrence when rainfall intensity close to 10 mm/hr and duration close to 10 hours.
with both increasing, which in accordance with the “common sense” that a bigger rainfall event with bigger intensity and duration should be more capable of inducing a debris flow. This is somehow verifying the model’s robustness, with it fulfilling both the boundary condition, i.e., when a rainfall with very little intensity and duration, the debris flow occurrence probability should be close to zero, and the rationale that the occurrence probability should incresae with both intensity and duration increasing.
Figure 3. The occurrence probability of debris flow under different combination of rainfall intensity and duration.
3.4. Debris Flow Occurrence More Sensitive to Rainfall Intensity
From Figure 3, it can be seen that rainfall intensity is playing a more critical role to debris flow occurrence. That is, under the same rainfall duration, the drbris flow occurrence probability inceases rapidly as intensity increases. For example, when rainfall duration = 1 hour, the occurrence probability increases from 0.00091 to 0.63 when the rainfall intensity increases from 1 mm/hr to 15.8 mm/hr.
By contrast, debris flow occurrence seems insensitive to rainfall duration. That is, when rainfall duration increases, the occurrence probability of debris flow increases fairly slowly. For instance, from Figure 3 it can be seen that when rainfall intensity = 1 mm/hr, the occurrence probability of debris flow increases from 0.00091 to 0.07 when rainfall duration increases from 1 hour to 15.8 hours.
Such a finding that debris flow occurrence is more sensitive to rainfall intensity than duration can also be verified by the observations given in Figure 1. To help explain this, the readers can refer to Figures. 4 and 5. From Figure 4, it can be seen that when rainfall intensity increases, debris flows were occurring on more occasions. On the contrary, it can be seen from Figure 5 that when rainfall duration increases, debris flows were not increased significantly, with the ratio of black dots (debris flow occurring) to hollow dots (debris flow occurring) being
constant although rainfall duration was increased.
The possible rational to such a finding, i.e., debris flow occurrence is more sensitive to rainfall intensity to duration, as follows. When a huge amount of rainfall is poured down to the gorund is a relative short of time, the pore water pressure in the soil, or the source material of debris flow, can increase, and therefore lower the effectvie stress in the soil based on the fact that effective stress is equal to total stress minus pore pressure. On the other hand, for a rainfall event lasting for a longer period of time but with small rainfall intensity in the process, the pore water pressure in the soil can be dissipated, given that the precipitation is not poured down instantly.
Figure 4. Debris flow occurrence when rainfall intensity increases.
Figure 5. Debris flow occurrence when rainfall duration increases.
4. Discussion
4.1. Missed Alarm and False Alarm
an early warning but debris flow do occur afterwards, then this situation is referred to as missed alarm. Figure 6 shows a diagram demonstrating the situation of missed alarm and false alarm, as well as two other correct cases.
Figure 6. Missed alarm and false alarm.
4.2. Consequence of Missed Alarm and False Alarm
It is also understood that the two errors, i.e., missed alarm and false alarm, would both lead to undesirable consequences. For a missed alarm, the consequence is direct. Given no early responses taken (because no early warning is received), then the consequence is the damage caused by the debris flow. Assume a debris flow would kill 10 people in a village; given that they are not evacuated in advance since no early warning has been received, the cost of the missed alarm is then equal to the 10 lives of their.
On the contrary, the consequence of a false alarm is more indirect. However, just imagining an early warning system keeps issuing false alarms, with time the credibility of the system will soon be at stake. Then what happens next is that people will ignore the warnings, making the system nonexistence per se.
4.3. Risk and Risk-based Decision Making
What is risk? In engineering risk management, risk is defined as failure probability multiplying failure consequence [31]. According to the definition, the risk of a missed alarm is equal to the occurrence probability of missed alarm multiplying the consequence. Similarly, the risk of a false alarm is equal to the occurrence probability of false alarm multiplying its consequence. Then, when we decide not to issue an early warning, the risk we bear is the risk of missed alarm. By contrast, when we decide to issue an early warning, the risk we bear is the risk of false alarm. Finally, when the risk associated with not issuing an early warning is larger than the risk associated with issuing an early warning, the decision will be not to issue the early warning, and vice versa. Figure 7 demonstrates the basic concept of the risk-based
decision making.
Figure 7. Risk-based decision making.
4.4. Probability of Debris flow, Missed Alarm, and False Alarm
As a result, in order to calculate the risks associated with missed alarm and false alarm, it is needed to estimate their occurrence probabilities in advance. Implicitly, the two probabilities are related to the occurrence probability of debris flows. That is, given that the occurrence probability of debris flow is equal to 80% (therefore there is a 20% chance that the debris flow will not occur) and we decide to issue an early warning, then there will be a 20% chance that this warning will be a false alarm. In short, the probability of false alarm is equal to 100% minus the occurrence probability of debris flow. By contrast, when we decide not to issue an early warning at that exact situation, there is an 80% chance that a missed-alarm situation will be resulted, equal to the occurrence probability of debris flow.
4.5. The Threshold to Early Warning
Therefore, when the occurrence probability of debris flow is determined, the probabilities of missed alarm and false alarm are both determined, so as the risks of missed alarm (deciding not to issue the warning) and false alarm (deciding to issue the warning) given that the respective consequences are known. As a result, as shown in Figure 7, we can determine the risks of not issuing an early warning when with the occurrence probability from 0 to 1, as well as the risks of issuing the warning.
5. Conclusion
This paper presents a logistic model to estimate the occurrence probability of debris flow triggered by a rainfall event based on its intensity and duration. A total of 354 set sets from the areas of Sichuan, China were used to calibrate the model.
The logistic model, which can calculate the occurrence probability of debris flow, can help develop a risk-based model for deciding when an early warning is needed, given that the rainfall event’s intensity and duration are determined from weather forecast. Such a decision-making framework is by all means scientific and robust, and the essential to the model is the occurrence probability of debris flows.
Acknowledgements
The authors appreciate the comments from the technical committee of the conference for reviewing this submission. The financial support on this study from the Ministry of Science and Technology of the Republic of China is highly appreciated (Project No. 107-2221-E-008-021-MY3).
References
[1] Guo XJ, Cui P, Li Y, Ge Y, Mahoney WB (2016) Intensity-duration threshold of rainfall-triggered debris flows in the Wenchuan Earthquake affected area, China. Geomorphology 253: 208–216.
[2] Wu MH, Wang JP, Chen IC (2018) Optimization approach for determining rainfall duration-intensity thresholds for debris flow forecasting. Bulletin of Engineering Geology and the Environment pp 1–7.
[3] Tang H, Liu Y, He SM, Chen Z, Wang DP (2018) Measuring and estimating the impact pressure of debris flows on bridge piers based on large-scale laboratory experiments. Landslides July 2018, Volume 15, Issue 7, pp 1331–1345.
[4] Lai SY, Chang WJ, Lin PS (2006) Logistic Regression Model for Evaluating Soil Liquefaction Probability Using CPT Data Journal of Geotechnical and Geoenvironmental Engineering Volume 132 Issue 6, Pages 694-704.
[5] Chang KT, Chiang SH, Hsu ML (2007) Modeling typhoon- and earthquake-induced landslides in a mountainous watershed using logistic regression. Geomorphology Volume 89, Issues 3–4, Pages 335-347.
[6] Dahal R, Hasegawa S (2008) Representative rainfall thresholds for landslides in the Nepal Himalaya. Geomorphology 100:429–443.
[7] Gabet E, Burbank D, Putkonen J, Pratt-Sitaula B, Ojha T (2004) Rainfall thresholds for landsliding in the Himalayas of Nepal. Geomorphology 63:131–143.
[8] Guo XJ, Cui P, Li Y (2013) Debris flow warning threshold based on antecedent rainfall: a case study in Jiangjia Ravine, Yunnan, China. J. Mt. Sci. 10(2):305–314.
[9] Aleotti P (2004) A warning system for rainfall-induced shallow failures. Eng. Geol. 73:247–265.
[10] Guzzetti F, Peruccacci S, Rossi M, Stark C (2007) Rainfall thresholds for the initiation of landslides in central and southern Europe. Meteorog. Atmos. Phys. 98:239–2125.
[11] Guzzetti F, Peruccacci S, Rossi M, Stark C (2008) The rainfall intensity–duration control of shallow landslides and debris flows: an update. Landslides 5:3–17.
[12] Hong Y, Hiura H, Shino K, Sassa K, Suemine A, Fukuoka H, Wang G (2005) The influence of intense rainfall on the activity of large-scale crystalline schist landslides in Shikoku Island, Japan. Landslides 2:97–105.
[13] Iverson RM (1997) The physics of debris flows. Rev Geophys 35(3): 245–296.
[14] Jibson R (1989) Debris flow in southern Puerto Rico. Geol. Soc. Am. Spec. Pap. 236:29–55.
[15] Larsen M, Simon A (1993) A rainfall intensity-duration threshold for landslides in a humid-tropical environment, Puerto Rico. Geografiska Ann. Series A, Phys. Geography 75:13–23.
[16] Mileti SM, Peek L (2000) The social psychology of public response to warnings of a nuclear power plant accident. Journal of Hazardous Materials 75: 181–194.
[17] Saito S, Daichi N, Hiroshi M (2010) Relationship between the initiation of a shallow landslide and rainfall intensity–duration thresholds in Japan. Geomorphology 118:1125–1175.
[18] Tang C, Van AT, Chang M, Chen GQ, Zhao XH, Huang XC (2012) Catastrophic debris flows on 13 August 2010 in the Qingping area, southwestern China: The combined effects of a strong earthquake and subsequent rainstorms. Geomorphology 139-140:559–576.
[19] Tang XS, Wang JP, Yang W, Li DQ (2018) Joint probability modeling for two debris-flow variables: copula approach. Natural Hazards Review ASCE 19(2): 05018004.
[20] Wang JP, Wu YM, Lin TL, Brant L (2012) The uncertainties of a Pd3-PGV onsite earthquake early warning system. Soil Dynamics and Earthquake Engineering 36: 32–37.
[21] Xu Y, Wang JP, Wu YM, Kuochen H (2017) Reliability assessment on earthquake early warning: A case study from Taiwan. Soil Dynamics and Earthquake Engineering 92: 397– 407.
[22] Zhou W, Tang C (2013) Rainfall thresholds for debris flow initiation in the Wenchuan Earthquake-stricken area, southwestern China. Landslides 11(5): 877–887.
[23] van Asch, T. W. J., Tang, C., Alkema, D., Zhu, J., Zhou, W., (2014). An integrated model to assess critical rainfall thresholds for run-out distances of debris flows. Nat. Hazards 70 (1), 299– 311.
[24] Brunetti, M. T., Peruccacci, S., Rossi, M., Luciani, S., Valigi, D., Guzzetti, F., (2010). Rainfall thresholds for the possible occurrence of landslides in Italy. Nat. Hazards Earth Syst. Sci. 10, 447–458.
[25] Chen, Y., Booth, D. C., (2011). The Wenchuan Earthquake of 2008. Science Press, Beijing.
[27] Cui, P., (1992). Studies on condition and mechanism of debris flow initiation by means of experiment. Chin. Sci. Bull. 37 (9), 759–763.
[28] Cui, P., Zhu, Y. Y., Chen, J., Han, Y. S., Liu, H. J., 2007. Relationships between antecedent rainfall and debris flows in jiangjia ravine, China. In: Chen, C. L., Major, J. J. (Eds.), DebrisFlow Hazard Mitigation-Mechanics, Prediction, and Assessment. Millpress, Rotterdam, pp. 1–10.
[29] Cui, P., Zou, Q., Xiang, L. Z., Zeng, C., 2013. Risk assessment of simultaneous debris flows in mountain townships. Prog. Phys. Geogr. 37 (4), 516–542.
[30] Dai, F. C., Xu, C., Yao, X., Xu, L., Tu, X. B., Gong, Q. M., 2011. Spatial distribution of landslides triggered by the 2008 Ms 8.0 Wenchuan earthquake, China. J. Asian Earth Sci. 40, 883–895.
[31] Caine N (1980) The rainfall intensity–duration control of shallow landslides and debris flows. Geografiska Annaler: Series A Phys. Geogr. 62:23–27.