DOI: https://doi.org/10.30880/ijie.2018.10.08.032
Effect of Performance and Exhaust Emission using Liquid
Phase LPG Sequential Injection as an Alternative Fuel in
Spark Ignition Engine
Mohd Mustaqim Tukiman
*, Shahrul Azmir Osman, Mas Fawzi, Norrizal
Mustaffa and Rais Hanizam Madon
Automotive Research Group (ARG), Center for Energy and Industrial Environment Studies (CEIES), Faculty of Mechanical and Manufacturing Engineering, Universiti Tun Hussein Onn Malaysia, 86400Parit Raja, Batu Pahat, Johor, Malaysia
Received 20 December 2018; Accepted 31 December 2018; Available online 31 December 2018
1. Introduction
The transportation sector energy consumption by fuel, which are petroleum and other liquid fuels are still the dominant source in the market. A review on the application of response surface method and artificial neural network in engine performance and exhaust emissions characteristics in alternative fuel [1], Alcohol based automotive fuels from first four alcohol family in compression and spark ignition engine: a review on engine performance and exhaust emissions [2]. This scenario has projected the declination from 96% of total share in year 2012 to 88% in year 2014, as forecasted by the international energy outlook 2016. The road map of world automotive industries has contributed to the reduction of energy consumption, where the effective Energy Efficiency Vehicles (EEVs) being introduced such as Hybrid Electric Vehicle (HEV), Plug-in Hybrid
electric vehicle (PHEV), full electric vehicles (EV) and etc. In addition, efficient vehicle also includes technology alternatively-fuelled vehicle e.g. Compress Natural Gas (CNG), Liquefied Petroleum Gas (LPG), Ethanol and hydrogen [3]. Nevertheless, the other technologies, including the Internal Combustion Engine (ICE) are all the same in growth phase and designed to be used within 20-30 years. Thus, ICE is still relevant to be improved since it has a high potential to reduce fuel consumption and exhaust emissions.
The increase of conventional fossil fuel price was affected by the world economy. The issue is the transportation sector, which has experienced a steady growth for the past 30 years, almost entirely relying on fossil fuel, particularly petroleum. Meanwhile the demand of fossil fuel was predicted to have growth of around 60% until the past 40 years. Consequently, this problem was
Abstract: LPG has a higher research octane number (RON) and low carbon to hydrogen ratio contains. Thus, LPG has prospects to gain more performance and reducing the exhaust emission in spark ignition (SI) engine. The objectives of this study are to identify the influence liquid phase LPG system tested on SI engine and investigate the performance and exhaust emission of LPG and gasoline. The contain LPG has 60% butane and 40% propane, according to Materials Safety Data Sheet (MSDS). The experiment was operating on a 1.6 Liter, 4 inline cylinders from a Proton Gen 2 (S4PH). The engine fuel delivery was equipped with Multiport Injection (MPI) system. Injectors LPG Liquid Sequential Injection (LSI) was mounted at close intake valve without disturbing gasoline injectors. To control the LPG injector system, the piggy-back system was installed as to emulate the stock Electronic Control Unit (ECU). The engine was tested via chassis dynamometer at steady state conditions to analyze the Brake Power (BP) and Brake Torque (BT) at a desired engine speed from 1500rpm to 4000rpm with increments of 500rpm. Meanwhile, the Throttle Position (TP) was varied at four conditions that were 25%, 50%, 75% and 100% for every single engine speed. The result of the performance showed liquid phase LPG increased BT and BP in the range of 3% to 7%, BSFC was reduced in the range 21% to 52%. The exhaust emission from carbon monoxide (CO) was decreased in the range of 2% to 19%, exhaust emission from a hydrocarbon (HC) was emitted with increment in the range of 40% to70% and nitrogen oxide (NOX) exhaust emission was elevated in an
average of 60% in comparison with gasoline. The LPG LSI system is more effective than gasoline in Spark Ignition (SI) engine at lower engine speed (1500rpm to 2500rpm) due to low Brake Specific Fuel Consumption (BSFC) and exhaust emission.
Keyword: Liquefied Petroleum Gas (LPG), Liquid Sequential Injection (LSI), Spark Ignition (SI)
.
attributed to unstable current-to-production ratio [4]. To address these limitations, introduction of an alternative fuel is best option to solve these problems, where by the examples of some promising alternative fuels include LPG, CNG, bio-fuel and others [2, 3].
LPG is by-product of natural gas production from refineries [7]. Its composition refers to the propane (C3H8) and butane (C4H10) with a different specific ratio
as shown in Table 1. Generally, compositions of LPG are depending on season, country, supplier and cost of refinery product [8]. In addition, there are no fixed standard value for the LPG composition [9]. Therefore, composition of ratio of LPG directly affects the performance and emission when used in spark ignition engine during combustion [10].
Currently, LPG is one of the potential alternative fuels to replace conventional fuel owing to economic costs, high research octane number (RON) and high calorific value. LPG was established in the countries such as Turkey, Russia and Korea since 50 years ago [11] and the technology of SI engine into the LPG system has been growing recently. Based from Raslavičius et al.[12] on retrofit LPG delivery and system control in SI engine, they have divided it into five generations and technology. First until fourth generation technology is run using gaseous phase and fifth generation run used liquid phase [13]. Liquid phase LPG is more effective than gaseous phase in medium high load due to energy required to change phase, where the large amount of heat was absorbed rapidly into air intake manifold. In addition, it work as cooler mixer inside the air intake manifold and produced greater density as a result of volumetric efficiency and torque output were increased [14,15]. Result for exhaust emission was shows liquid phase LPG are lower compared gasoline. Previous data from Pecqueur et al. [16] measured shows that NOX is
decreased when using liquid phase LPG than gasoline. According Sulaiman et al. [17] exhaust emission from liquid phase LPG state that CO as 60% reduction and HC were reported 40% lower.
The present work used LSI LPG fuel in to the SI engine, where the composition ratio is 60% butane and 40% propane. This study highlighted the performance and exhaust emission characteristics of SI engine 1.6 Liters small passenger cars fueled by LPG. In addition, characterization of the engine output with respect
performance and exhaust emission were examined by controlling the various throttle position (TP) and engine speed. The mapping of air excess ratio for each TP and engine speed was recorded for testing engine.
Table 1 :Physical and chemical properties of the LPG and gasoline [14,15]
Characteristics LPG Gasoline
Chemical composition
Liquid density, kg/m3
C4H10(Butane)-
60% C3H8(Propane)-
40% 509
C8H18
765
Calorific value, MJ/kg
46.34 44.04
Boiling point - 42 30 - 210
Auto ignition temperature, ̊ C
510 275
Flame temperature, ̊ C
1980 1720
Flame speed, m/s 0.4 0.35
Stoichiometric air/fuel, kg/kg
15.8 14.7
Octane number 111 95
2.
Experimental Setup
The test was carried out on a 1.6 liter in-line 4 cylinder spark ignition engine from Proton Gen 2 (S4PH) model with multi-port fuel injection (MPI) fuel delivery system. The main technical specification is shown in Table 2. This stock electronic control unit (ECU) harness was attached to the LPG liquid sequential injection (LSI) ECU with minor modification and four injectors LPG was mounted on the air intake manifold that close the inlet valve without disturbing the position of stock injector.
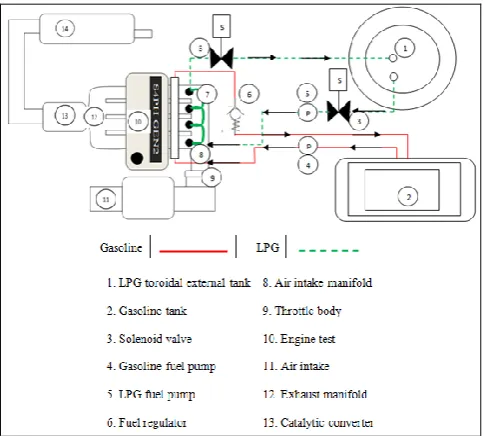
The LPG utilized in this experiment consists of 60% butane and 40% propane (MSDS). Details of physical and chemical properties of the LPG and gasoline fuel, used in this experiment are shown in Table 1. This LPG system was equipped with regulator and solenoid valve as shown in Figure 1. The function of such configuration is to maintain the pressure in range 9 to 10 bar of LPG in liquid phase condition in fuel delivery system. To ensure the quantity of injection LPG in adequate condition, the system was calibrated. Next, for measuring the engine performance in term of Brake Power (BP) and Brake Torque, the test engine was coupled to a 650 kW Chassis Dynamometer from model Dynapack 4022. The emissions were measured using Autocheck gas analyzer. Meanwhile, a probe was positioned at the exhaust tailpipe and all data was repeated three times each experiment. The analyzer has the capability to collect exhaust product gas such as oxides of nitrogen (NOX), carbon dioxide
(CO2), carbon monoxide (CO), oxygen (O2) and the
hydrocarbon (HC). The measurement of consumption for the fuel types; LPG and gasoline in this experiment uses Ono Sokki: FZ-2100 mass flow meter, where it employed
Nomenclature
LPG Liquefied Petroleum Gas CNG Compress Natural Gas
RON Research Octane Number SI Spark Ignition
MSDS Materials Safety Data Sheet LSI Liquid Sequential Injection TP Throttle Position
the Coriolis principle. To ensure the test engine running in consistent condition, Bosch scan tools KTS 570 V1.2 was connected to the test engine to monitor data in real time condition and also detect all condition system test engine either error or good.
Table 2: Specification of the spark ignition engine [19]
Type model Proton Gen 2 (S4PH)
Total displacement (L) 1.6L Number of cylinders 4
Orientation East - West
Valve train DOHC 16 V
Compression ratio 10.0: 1 Bore x stroke (mm) 76 x 88
Power (kW) 82 @ 6000 RPM
Torque (Nm) 148@ 4000RPM
Fuel / system Petrol / multi point port injection
3.
Experimental Procedures
All the test performance and exhaust emission were conducted at 1500, 2000, 2500, 3000, 3500 and 4000 RPM. Figure 2 shows the schematic diagram arrangement of engine test condition. To evaluate the data, the steady state method was selected. Steady state is tested for the engine with an increment of 500rpm and the several different throttle positions that were controlled are set at 25%, 50%, 75% and 100% for each engine speed increment. These engine tests were warmed up about 10 minutes until the exhaust tail pipe produces water droplets, indicating that the engine is in stable combustion condition and is ready to run. To reduce the error of data, all experiments are repeated three times for each test condition.
4.
Result and Discussion
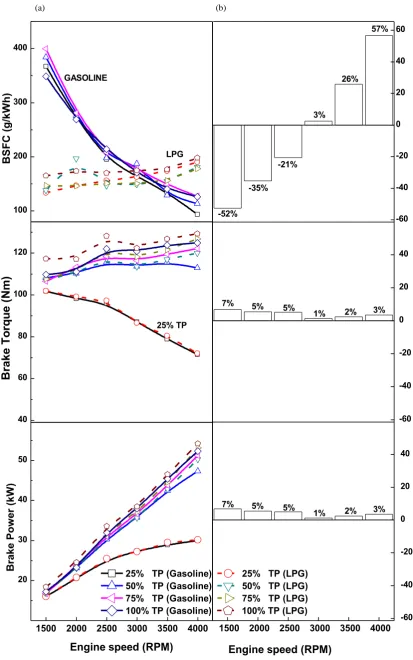
A series of various tests was conducted as mentioned. The engine test operating with various speeds and different throttle positions on the engine performance output variable and exhaust emission characteristics. Figure 3 shows the graph of performance in different modes. The (a) side represents the overall result in termination of BP, BT and BSFC from lower engine speed (1500rpm-2500rpm) and higher engine speed (3000rpm- 4000rpm) and 25% TP to 100% TP. Meanwhile, (b) side was shown about percentage of comparative performance for LPG opposed to gasoline at highest throttles positions condition.
Fig. 1 Schematic diagram for LPG fuel delivery conversion system
Fig. 2 Schematic diagram arrangement of engine test condition
4.1 Engine Brake Power (BP)
In the range 1500rpm to 2500rpm, the comparison of both fuels has shown that LPG produced 7% to 5% BP more than gasoline. Meanwhile, from 3000rpm to 4000rpm the BP was reduced in the range 1% to 3%. The reason is endothermic process responded prematurely in higher engine speed condition. Therefore, the temperature in the intake manifold is higher than mass and density of air, producing lower volumetric efficiency [6, 17]. This process affected the engine performance [21, 22]. This is due to the LPG was injected in liquid conditions rather than gaseous. Moreover, the liquid injections gave more advantage on energy content and contributed to improve the volumetric efficiency in certain conditions. Besides that, liquid injection of LPG generated the Joule-Thompson effects during air and fuel mixing in combustion chamber and produced less unburned fuel [23].
4.2 Engine Brake Torque (BT)
The variation of BT between LPG and gasoline was illustrated in the graph. The result shows LPG has lead with the highest BT compared to gasoline when increasing throttle position 50%TP to 100%TP and engine speed 2000rpm to 4000rpm, except at 25% TP for both fuels since there was a decrease from 101.9Nm to 72Nm. The reason is because of the mapping from stock ECU was unstable for low load engine speed condition in terms of mixer air-fuel ratio. For fuel LPG at 50% TP, in conditions of engine speed 3500rpm to 4000rpm showed an increase in BT where the LPG is 117 Nm to 120Nm and gasoline is 115Nm to 112Nm respectively. Meanwhile, for 75% TP also showed increasing of BT at 2000rpm to 4000rpm, for 100% TP comparison in an average 1 % -7% of fuel LPG gives positive effect, where the BT was increased from 117Nm to 129Nm. This is because the LPG fuel was cooled surrounding inside the intake manifold and combustion chamber. Therefore, the density of mass of fuel-air was greater than produced higher volumetric efficiency [21,24]. The result showed BSFC for both fuels is different, in the lower engine speed 1500rpm to 2500rpm condition. The result shows LPG has the lead when it comes to fuel consumption from 367.16g/kWh to 133.50 g/kWh when using LPG at condition 25% TP. At 50% TP the LPG was successfully reduced 138.21g/kWh compared by gasoline 384g/kWh. Meanwhile, at 50% TP the BSFC of fuel LPG was improved from 399.81g/kWh to 146.97 g/kWh when using LPG as a fuel, with similar pattern seen at 100% TP as it was reduced from 348.74 g/kWh to 165.06 g/kWh.
4.3 Engine Brake Specific Fuel Consumption
(BSFC)
Overall, at 100% TP in low engine speed condition has shown the LPG improved 21% to 52% at early engine
speed condition. Meanwhile, the BSFC for gasoline has shown trade-off for both fuels, where gasoline was improved 3% to 57% at high engine speed condition from 3000rpm to 4000rpm. These phenomena happen because the mixing of air-fuel ratio for gasoline being leaner than LPG at higher engine speed [25]. The process of induction of liquid phase LPG was affected to produce mixer of air-fuel ratio in rich condition and effected air density during combustion. The result supported by Gumus [26], where the combustion of LPG was not fully oxidized because of the lack of oxygen at higher engine speed, hence the BSFC was effected.
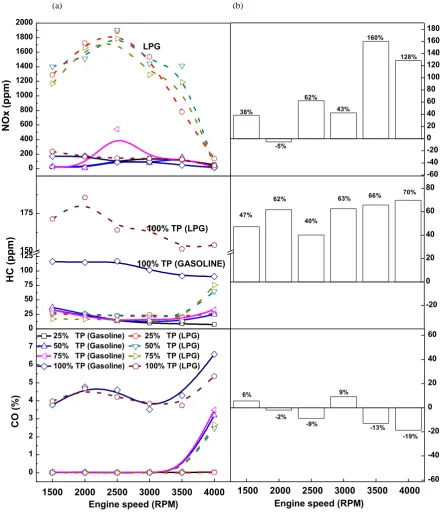
4.4 Exhaust Emission Carbon Monoxide
(CO)
Figure 4 shows the different trend of modes of CO produced from fuel LPG and gasoline in 1.6 liter engine. The result for 25% TP, 50% TP and 75% TP was shown CO emission value of LPG almost similar pattern with gasoline at 1500rpm to 3000rpm conditions, except at 25% TP the CO emission was constant until 4000rpm. However, in 50% TP and 75% TP at 3200rpm condition, the gasoline was lead to increasing of CO emission compared by LPG. This occurs since the gasoline undergone incomplete combustion than LPG, which can be attributed to less oxygen during combustion. Meanwhile, at 100% TP shows LPG reduced CO emission in an average 2 % to 19% at almost engine RPM, except in 1500rpm and 3000rpm because of the unstable mix of air-fuel ratio, hence affecting the result. Overall, carbon-hydrocarbon ratio of LPG is less than gasoline and gives advantage for effective combustion [26]. The other reason, the excess air ratio also affected the control for reduction or increasing CO emission in combustion [14, 27].
100 200 300 400
40 60 80 100 120
1500 2000 2500 3000 3500 4000 20
30 40 50
LPG GASOLINE
BS
F
C (
g
/k
W
h
)
-60 -40 -20 0 20 40 60 57%
26%
3%
-21%
-35%
-52%
25% TP
Br
ak
e
T
o
rq
u
e
(Nm
)
-60 -40 -20 0 20 40
3% 2% 1% 5% 5% 7%
Engine speed (RPM)
B
ra
k
e
Po
w
e
r
(k
W
)
Engine speed (RPM)
25% TP (Gasoline) 25% TP (LPG) 50% TP (Gasoline) 50% TP (LPG) 75% TP (Gasoline) 75% TP (LPG) 100% TP (Gasoline) 100% TP (LPG)
1500 2000 2500 3000 3500 4000 -60 -40 -20 0 20 40
3% 2% 1% 5% 5% 7%
(a) (b)
0 200 400 600 800 1000 1200 1400 1600 1800 2000
0 25 50 75 100 125 150 175
1500 2000 2500 3000 3500 4000 0
1 2 3 4 5 6 7
LPG
N
O
x
(pp
m)
-60 -40 -20 0 20 40 60 80 100 120 140 160 180
128% 160%
43% 62%
-5% 38%
100% TP (GASOLINE) 100% TP (LPG)
HC
(
pp
m)
-20 0 20 40 60 80
70% 66%
63%
40% 62%
47%
25% TP (Gasoline) 25% TP (LPG) 50% TP (Gasoline) 50% TP (LPG) 75% TP (Gasoline) 75% TP (LPG)
100% TP (Gasoline) 100% TP (LPG)
CO
(
%
)
Engine speed (RPM)
1500 2000 2500 3000 3500 4000 -60 -40 -20 0 20 40 60
-19% -13% 9%
-9% -2% 6%
Engine speed (RPM)
Fig. 4 (a) Overall variation of exhaust emission engine speed and throttles position; (b) High condition throttle position
4.6 Exhaust Emission Nitrogen Oxide (NO
X)
NOX emission was shown in the Figure 4 and the
trend for both fuels at all engine speed conditions is presented. NOX emission from LPG shows the increment
of 25% TP, 50% TP and 75% TP when the engine speed increased from 1500rpm to 2500rpm. Meanwhile, after 2500rpm to 4000rpm the NOX emission was reduced for
all TP conditions. For LPG trend at 100% TP, NOX
emission increment in the range 38% to 160% compared with gasoline at 1500rpm to 4000rpm. This is due to the amount of LPG lacking fuel in excess air ratio and affected the increment of NOX emission. In addition, the
higher cylinder temperature and concentration of oxygen reacted with nitrogen in combustion process contributed to the increase of NOX emission. NOX emission from
gasoline was more consistent than LPG at all throttles position and engine speed, except at 75% TP conditions. Overall, the LPG still has higher NOX emission compared
the engine when the excess fuel ratio in leaner condition [30].
5.
Conclusion
In this study, the converted spark ignition engine fuelled by the LPG liquid phase in bi-fuel system can be summarized as:
• The LPG liquid phase was improved BT and BP in the range 1% to 7% compared with gasoline fuel. • The variation of exhaust emission from CO has
significantly reduced in the range 2% to 19% as the engine speed increased, respectively, except at 1500rpm and 3000rpm of engine speed.
• Emission exhaust HC emitted from LPG is higher than gasoline when engine speed increased in the range of 40% to 70%. Therefore, the mixture of air fuel ratio for LPG needs to be set at lean condition to reduce HC emission and unburned fuel.
• The concentrations of NOx emission for LPG are higher compared to gasoline in average of 73%. Hence, to reduce the emission of NOX, the spark
ignition angle need to be tuned at advance condition cause the LPG vaporized faster than gasoline. • The improvement obtained in BSFC value when
using LPG at low speed engine condition (1500rpm to 2500rpm), it founded that LPG had significantly improved in the range of 21% to 52%, respectively.
Acknowledgement
The author would like to thank the Universiti Tun Hussein Onn Malaysia (UTHM) for partly supporting this research under contract grant VOT U427 and Postgraduate Research Grant Scheme (GPPS) VOT 963.
References
[1] I. M. Yusri, A. P. P. A. Majeed, R. Mamat, M. F. Ghazali, O. I. Awad, and W. H. Azmi, “A Review on the Application of Response Surface Method and Artificial Neural Network in Engine Performance and Exhaust Emissions Characteristics in Alternative Fuel,” Renewable and Sustainable Energy Reviews, vol. 90, no. November 2017, pp. 665–686, 2018. [2] I. M. Yusri, R. Mamat, G. Naja, A. Razman, O. I.
Awad, W. H. Azmi, W. F. W. Ishak, and A. I. M. Shaiful, “Alcohol Based Automotive Fuels from First Four Alcohol Family in Compression and Spark Ignition Engine : A Review on Engine Performance and Exhaust Emissions,” Renewable and Sustainable Energy Reviews, vol. 77, no. October 2015, pp. 169– 181, 2017.
[3] V. K. Sahu, S. Deshpande, and V. Raghavan, “Numerical Analysis of Auto-ignition of Ethanol,” International Journal of Integrated Engineering, vol. 3, no. 1, pp. 1–4, 2011.
[4] V. Leung, “Slow Diffusion of LPG Vehicles in
China-Lessons from Shanghai, Guangzhou and Hong Kong,” Energy Policy, vol. 39, no. 6, pp. 3720–3731, 2011.
[5] M. M. Ismail, M. Fawzi, F. H. Zulkifli, and S. Azmir, “CNG-Diesel Dual Fuel Controlling Concept for Common Rail Diesel,” International Journal of Integrated Engineering, vol. 10, no. 3, pp. 88–92, 2018.
[6] S. A. Osman, A. J. Alimin, and V. S. Liong, “Optimum combustion chamber geometry for a compression ignition engine retrofitted to run using compressed natural gas (CNG),” Applied Mechanics and Materials, vol. 315, no. 1, pp. 552–556, 2013. [7] Bahadori, Natural Gas Processing Technology and
Engineering Design, First Edition. Gulf Professional Publishing is an imprint of Elsevier, 2014.
[8] H. Baker, P. Watson, “MPI Air / Fuel Mixing for Gaseous and Liquid LPG Reprinted From : SI Combustion and Direct Injection SI Engine Technology,” Society of Automotive Engineers Technical paper No. 2005-01-0246, 2005.
[9] M. M. Tukiman, N. Mustaffa, M. Fawzi, and S. A. Osman, “A Comparative Study of an Lpg- Spark Ignition Engine using Liquid Sequential Injection Technique,” MATEC Web of Conferences, vol. 01050, no. 78, pp. 1–7, 2016.
[10] H. E. Saleh, “Effect of variation in LPG composition on emissions and performance in a dual fuel diesel engine,” Fuel, vol. 87, no. 1, pp. 3031–3039, 2008. [11] Trevor Morgan, “Autogas Incentive Policies; A
Country-By-Country Analysis of Why And How Governments Encourage Autogas And What Works,” 2017.
[12] L. Raslavičius, A. Keršys, S. Mockus, N. Keršiene, and M. Starevičius, “Liquefied Petroleum Gas (LPG) as A Medium-Term Option in The Transition to Sustainable Fuels and Transport,” Renewable and Sustainable Energy Reviews, vol. 32, pp. 513–525, 2014.
[13] P. X. Phuong, “Comparison of Liquid and Gaseous Liquefied Petroleum Gas Injection in a Spark Ignition Engine,” University of Sydney, 2006. [14] H. C. Watson and P. X. Phuong, “Why Liquid Phase
LPG Port Injection has Superior Power and Efficiency to Gas Phase Port Injection,” Society of Automotive Engineers Technical paper No. 2007-01-3552, 2007.
[15] N. Mizushima, S. Sato, Y. Ogawa, T. Yamamoto, U. Sawut, B. Takigawa, K. Kawayoko, and G. Konagai, “Combustion Characteristics and Performance Increase of an LPG-SI Engine with Liquid Fuel Injection System,” Society of Automotive Engineers Technical paper No. 2009-01-2785, 2009.
[16] M. Pecqueur, K. Ceustermans, P. Huyskens, and D. Savvidis, “Emissions Generated from a Suzuki Liane Running on Unleaded Gasoline and LPG under the Same Load Conditions,” Society of Automotive EngineersTechnical paper No. 2008-01-2637, 2008. [17] M. Y. Sulaiman, M. R. Ayob, and I. Meran,
Engine Fueled by LPG,” Procedia Engineering, vol. 53, pp. 579–585, 2013.
[18] R. R. Saraf, “Comparative Assessment on Performance and Emissions of LPG / Gasoline Bi-fuel Passenger Car PFI Engines,” Society of Automotive Engineers Technical paper, vol. 4970, 2014.
[19] Perusahaan Otomobil Nasional Berhad, Engine Overhaul Proton GEN 2 (S4PH) Manual, First edition. Malaysia: PROTON, 2004.
[20] N. Mustaffa, M. Fawzi, F. H. Zulkifli, and S. A. Osman, “Effects of Volumetric Efficiency on Spark Ignition Engine Fuelled by Liquefied Petroleum Gas ( LPG ): A Review,” Asian Research Publishing Network (ARPN), vol. 11, no. 18, pp. 11000–11003, 2016.
[21] B. R. Lutz, R. H. Stanglmaier, R. D. Matthews, and R. Wicker, “The Effects of Fuel Composition , System Design , and Operating Conditions on In-System Vaporization and Hot Start of a Liquid-Phase LPG Injection System,” Society of Automotive EngineersTechnical paper No. 981388, 1998. [22] A. Boretti and H. C. Watson, “Development of a
Direct Injection High Efficiency Liquid Phase LPG Spark Ignition Engine,” Society of Automotive EngineersTechnical paper No. 2009-01-1881, 2009. [23] M. M. Tukiman, N. Mustaffa, M. Fawzi, and S. A. Osman, “Investigating the Influences of Liquid LPG Injection on Spark Ignition ( SI ) Engine,” MATEC Web of Conferences, vol. 01075, no. 90,pp. 1–8, 2017.
[24] J. B. Heywood, Internal Combustion Engine Fundementals, 1st Editio. Singapore: McGraw-Hill, 1988.
[25] B. Erkus, A. Sürmen, and M. I. Karamangil, “A Comparative Study of Carburation and Injection Fuel Supply Methods in an LPG-Fuelled SI Engine,” Fuel, vol. 107, pp. 511–517, 2013.
[26] M. Gumus, “Effects of Volumetric Efficiency on The Performance and Emissions Characteristics of a Dual Fueled (Gasoline and LPG) Spark Ignition Engine,” Fuel Processing Technology, vol. 92, pp. 1862–1867, 2011.
[27] M. A. Khan, H. Watson, P. Baker, G. Liew, and D. Johnston, “SI Engine Lean-Limit Extension Through LPG Throttle-Body Injection for Low CO2 and NOX Reprinted From : SI Combustion and Direct Injection SI Engine Technology,” Society of Automotive EngineersTechnical paper No. 2006-01-0495, 2006. [28] K. Kang, D. Lee, S. Oh, and C. Kim, “Performance
of an Liquid Phase LPG Injection Engine for Heavy Duty Vehicles,” Society of Automotive Engineers Technical paper No. 2001-01-1958, 2001.
[29] M. Ihsan Karamangil, “Development of The Auto Gas and LPG-Powered Vehicle Sector in Turkey : A Statistical Case Study of The Sector for Bursa,” Energy Policy, vol. 35, pp. 640–649, 2007.
[30] M. A. Khan, H. C. Watson, and P. Baker, “Mixture Preparation Effects on Gaseous Fuel Combustion in SI Engines,” Society of Automotive Engineers
![Table 1 : Physical and chemical properties of the LPG and gasoline [14,15]](https://thumb-us.123doks.com/thumbv2/123dok_us/8437516.1700046/2.595.303.544.163.374/table-physical-chemical-properties-lpg-gasoline.webp)