a
Numerical
V
tudy on
V
mall
V
cale
Y
ertical
D
xis
Z
ind
W
urbine
Teresa Parra-Santos1,a, Armando Gallegos2, Cristóbal N. Uzarraga3 and Miguel A. Rodriguez1
1
University of Valladolid, Department of Energy and Fluid Mechanics, Valladolid, Spain 2
University of Guanajuato, Salamanca, Mexico 3Technologic Institute of Durango, Mexico
Abstract. The performance of a Vertical Axis Wind Turbine (VAWT) is numerically analyzed. The set-up is H-Darrieus with three straight blades airfoils NACA attached to a rotating vertical shaft. The wind turbine has solidity equals to the unity operating with wind velocity of 7 m/s. Influence of pitch angle is tested to get design tendencies. 2D, transient, Navier Stokes equations are solved using the code Ansys-Fluent. Conservation equations were solved with a Third-Order MUSCL scheme using SIMPLE to couple pressure and velocity. More than six revolutions must be simulated to get the periodic behavior. Two models of turbulence have been contrasted Realizable k-epsilon and Transition SST concluding the last one show more realistic flow features. Pitch angles of 0º, -6º and -10º have been tested with Tip Speed Ratios ranging from 0.7 and 1.6. The no null pitch angles improve the performance of the wind turbine. Instantaneous and averaged power coefficients as well as detailed flow field around the airfoils are showed.
1 Introduction
The computational model of an H- Darrieus wind turbine is built up using three air-foils NACA0015. The model is scaled down in order to match experimental requisites in a wind tunnel facility. Solidity of the wind turbine is the unity calculated as three times the ratio of chord versus diameter.
This research line is a collaboration of three teams from Universities of Valladolid (Spain), Guanajuato and Durango (Mexico). Previous works involved with this research line were carried out using k- turbulence models and non-arm configuration. For instance,
x The influence of the twist angle variation at the chord ends in symmetric airfoils NACA0015, [1].
x The analysis of the camber effect in non-symmetric airfoils NACA2425 and NACA7425, [2-3].
x The study of the solidity of the rotor NACA0025, [3-4].
Bearing in mind the Reynolds number is not very high, actual work uses the Transition SST turbulence model. Lanzafame states it performs well in this kind of applications, [5].
A secondary aim of this work is to analyze the influence of a fixed negative pitch angle, such as is proposed in [6].
2 Numerical model
The Reynolds number based on air velocity corresponds to a transitional turbulence regime.
Transient Navier Stokes equations are solved in a 2D computational domain with about 78 thousand cells. The numerical scheme is third order accuracy. SIMPLE is the method to coupling pressure and velocity resolution.
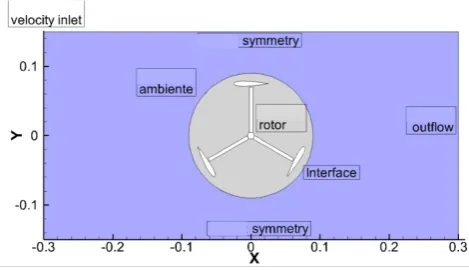
The domain considers two regions, ambient with poorer spatial resolution and rotor with a finer mesh. Moving reference mesh in stablished in the rotor zone, see figure 1 for a sample of the domain in a plane with arms.
Fig. 1. Set up of the computational domain of H-Darrieus.
DOI: 10.1051/
C
Owned by the authors, published byEDP Sciences, 201
/201 0 0 (201 ) epjconf
EPJ Web of Conferences1 ,
61
6
6
1
1 0 0
4
42 2 88
2.1 Boundary conditions
The geometrical details of the wind turbine [1] are summarized in table 1.
The wind is considered to be 7 ms-1 with an intensity of turbulence of 5%.
Table 1. Summary of geometrical details and the inlet conditions for VAWT.
Airfoil NACA0015
Shaft Radius 0.01 m
Rotor Radius (R) 0.07 m
Length (b) 0.2 m
Chord (c) 0.05 m
Area (A) 0.030 m2
Number of Blades (Z) 3
Solidity() 1.0
2.2 Sensibility to the mesh
Different meshes have been tested in order to stablish the optimal resolutions considering the computational cost constrain, see table 2 for details of cell numbers in the rotor and ambient regions.
a)
b)
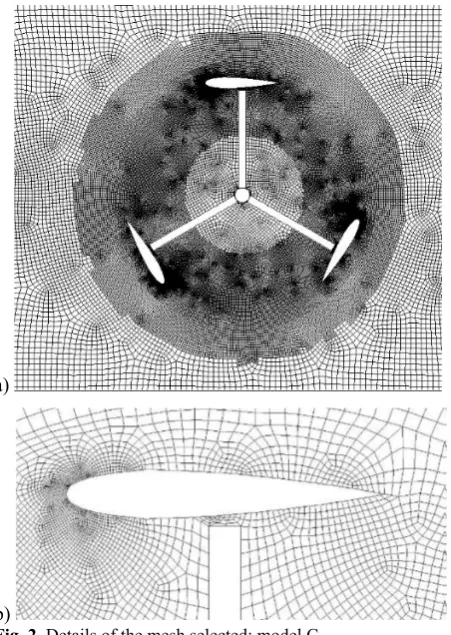
Fig. 2. Details of the mesh selected: model C.
Table 2. Details of mesh models.
Airfoil Model A Model B Model C
Rotor mesh 3737 14948 54320
Because of the imposed rotation of the mesh, the refinement criterion must warranty an axisymmetric mesh, see figure 2 for the selected mesh in a slice with arms.
Fig. 3. Averaged power coefficient versus the Tip Speed Ratio for NACA0015, solidity 1 with arms.
Each simulation with a certain rotation speed let obtain the corresponding averaged power coefficient that is a point of the characteristic curve. Changing the rotation speed, it is possible to build the curve. See figure 3 for a sample of influence of the mesh on the power coefficient curves.
Power coefficient depends on the torque T, rotation speed Z and wind velocity V, see equation 1,
ܥൌభ ்ఠ మఘ௩ಮయ
(1)
TSR stands for Tip Speed Ratio and is defined in equation 2.
ܴܶܵ ൌఠோ௩
ಮ (2)
2.3 Turbulence model
Transition SST is a suitable model for flow fields in the transition between laminar and turbulent regimes.
ப
ப୲ሺɏሻ ሺɏሬԦሻ ൌ ቆ൬Ɋ ஜ
ಋ൰ ሺɀሻቇ (3)
The source term has different contributions of production, P and destruction, D, of the laminar regime. Sub-index 1 is related to the strain tensor whereas sub-index 2 is function of rotation
ൌ ஓଵെ ஓଵ ஓଶെ ஓଶ (4)
ܴ݁௩ൌఘ௬ మௌ
ఓ (5)
ൌஜன (6)
Where S is the strain tensor, Z is the turbulent frequency scale and k is the turbulent kinetic energy.
Figure 4 shows the peak power coefficient using different turbulence models. The realizable k- and the transition SST provide similar results in agreement with the conclusions of [5].
Fig. 4. Comparison of different turbulence models for design conditions.
2.4 Validation of the model
In order to validate the results using the experimental measurements by Lanzafame [5], it was used a slice of the VAWT without arms.
Figure 5 shows the non-dimensional curves of averaged power coefficient versus the Tip Speed Ratio. The numerical model fails in the prediction of the range of TSR where the wind turbine can operate.
At least, the performance of the turbine is well predicted for TSR between 0.5 and 1.25.
Fig. 5. Averaged power coefficient versus the Tip Speed Ratio model without arms. Comparison of k- Realizable, Transition SST and experimental values from Lanzafame [5].
3
Flow pattern at design conditions
This section is devoted to the analysis of the flow pattern. The simulation corresponds with the design conditions, i.e. the maximum averaged power coefficient of the predicted characteristic curve.
Because of the periodic performance of the turbine, the instantaneous power coefficient changes along the revolution of the rotor. Then, there are positions of maximum and minimum instantaneous power coefficient.
The criterion to locate the airfoils is: 0º starts in 12 hours of a watch and the sense of rotation is against clockwise.
In the case of the model without arms, the most favourable position (maximum instantaneous power coefficient) is nearly when the air-foils are in positions 60º, 180º and 300º whereas the least favourable conditions are with air-foils near 0º, 120º and 240º.
In the case of model with arms, the flow pattern is completely different. The most favourable position is 0º, 120º and 240º while the least one is 60º, 180º and 300º.
Fig. 6.Contours of pressure NACA0015 for solidity 1 (top) at maximum instantaneous power coefficient (bottom) at minimum instantaneous power coefficient.
Figures 6 show contours of pressure. The higher pressure zone is up-winds from the rotor whereas the lower pressure is downwards. The suction side, associated with lower static pressure, is the inner part of the air-foils at positions 0º, 60º and 120º. Air-foils at 180º and 240º have the suction side in the outer part. The performance of the air-foil at 300º does not seem to be relevant.
The local minimum of pressure corresponds with the kernel of a vortex. These structures are consequence of the separation of the boundary layer. They can be observed near the suction side of air-foils located at 60º, 120º, 180º and 240º.
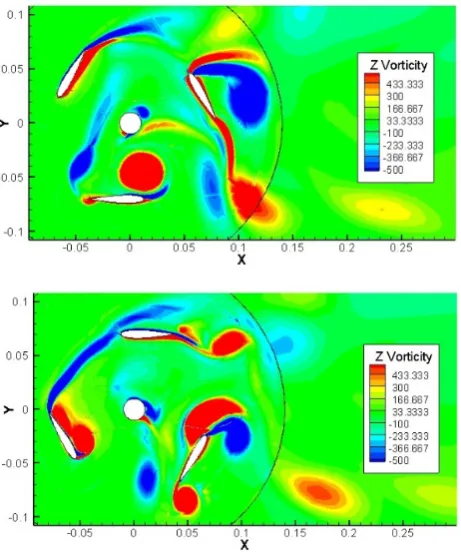
Fig. 7. Contours of vorticity NACA 0015 for solidity 1 (top) at maximum instantaneous power coefficient (bottom) at minimum instantaneous power coefficient.
Figures 7 show contours of vorticity. Positive values are assigned to vortices rotating against clockwise. It is easier to locate the vortex kernel as local minimum and maximum of vorticity. The vorticity flow field let identify the wake downstream of the turbine. At the position of minimum instantaneous power coefficient, the wake of blade at 120º interact with blade at 0º. Also the wake downstream of the turbine is larger than that for maximum instantaneous power coefficient.
4
Influence of the pitch angle
This kind of turbines is suitable for developing countries,
This section is devoted to see the performance’s tendency when the pitch angle is modified. A fixed pitch angle is used such as Lanzafame proposed in [6].
Figure 8 shows a scheme with a pitch angle negative. Mesh with angles -6º and -10º where tested.
Figures 9 show contours of pressure for different pitch angles on design conditions at the least favourable instantaneous conditions. The negative pitch angle is a precursor of lower pressure gradient on the three airfoils. Hence, smaller wakes are produced.
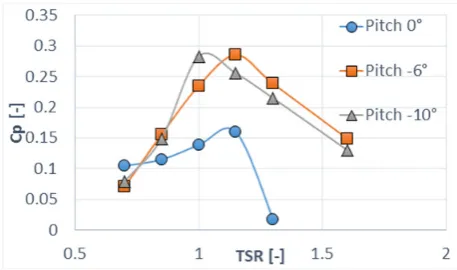
Figure 10 shows the non-dimensional curves of averaged power coefficient versus the Tip Speed Ratio without arms and with different fixed pitch angles. It is evident there is an increase of range of TSR operating as turbine for negative pitch angles. Also the peak power coefficient is increased.
Fig. 10. Averaged power coefficient versus the Tip Speed Ratio model without arms using transition SST and different pitch angles.
Conclusions
An H-Darrieus has been simulated using CFD. The set-up corresponds with 3 NACA0015 blades. Two slices were considered: with and without arms.
The model requests the transient resolution of conservation equations for incompressible and turbulent flows. Moving reference mesh is used to impose the rotation velocity.
As for the mesh refinement, it must be axisymmetric in order to achieve the periodicity of the flow.
Because the Reynolds number does not corresponds to fully developed turbulent flow, the turbulent model was transition SST that has been successfully used in the literature. It was found the results are similar to those provided by the realizable turbulence model. Besides, the convergence is adequate. It is a suitable model for flow fields between laminar and turbulent regimes.
The flow pattern for the maximum and minimum instantaneous power coefficient were analysed based on the pressure and vorticity fields. Suction sides and separation of the boundary layer were identified for the slice without arms.
The authors are aware that the characteristic curves of the averaged power coefficient versus the TSR show tendencies because no three-dimensional effects are considered.
The use of a pitch angle of -6º or -10º shows an increase of the performance of the turbine, increasing the range of TSR and the peak of the power coefficient. This conclusion matches the results found in the literature.
References
1. N.C. Uzarraga, A. Gallegos, M. T. Parra, J. M. Beltran. ASME ESFuelCell2012-91113 (2012) 2. T. Parra, C. Uzarraga, A. Gallegos, M.A. Rodriguez,
F. Castro. FEDSM2014Ǧ21356 (2014)
3. T. Parra, C. Vega, A. Gallegos; et al, EPJ Web of Conferences, 92 (2015) 02058
4. T. Parra, M. Esteban, F. Gonzalez, C. Uzarraga, A. Gallegos, F. Castro. International Conference of Advanced Technologies and Sciences (2014) pp. 770-772
5. R. Lanzafame, S. Mauro, M. Messina Energy Procedia 45, pp 131 – 140 (2014)
![Fig. 5. Averaged power coefficient versus the Tip Speed Ratio model without arms. Comparison of k-� Realizable, Transition SST and experimental values from Lanzafame [5]](https://thumb-us.123doks.com/thumbv2/123dok_us/8638653.1428361/3.595.310.540.329.606/averaged-coefficient-versus-comparison-realizable-transition-experimental-lanzafame.webp)