DOI: 10.1051/epjconf/20134302002 C
Owned by the authors, published by EDP Sciences, 2013
Old star clusters: Bench tests of low mass stellar models
M. Salaris
aAstrophysics Research Institute, Liverpool John Moores University, 12 Quays House, Birkenhead CH41 1LD, UK
Abstract. Old star clusters in the Milky Way and external galaxies have been (and still are) traditionally
used to constrain the age of the universe and the timescales of galaxy formation. A parallel avenue of old star cluster research considers these objects as bench tests of low-mass stellar models. This short review will highlight some recent tests of stellar evolution models that make use of photometric and spectroscopic observations of resolved old star clusters. In some cases these tests have pointed to additional physical processes efficient in low-mass stars, that are not routinely included in model computations. Moreover, recent results from theKepler mission about the old open cluster NGC6791 are adding new tight constraints to the models.
1. INTRODUCTION
Resolved old star clusters (globular and old open clusters) have been traditionally employed to estimate a lower limit for the age of the universe, determine the formation timescale of the Galactic halo (i.e. [33],[30]) and the time-delay between halo and disk formation (i.e., [32]). They can in principle also (weakly) constrain the baryonic mass density of the universe from the determination of the initial He-abundance in globular cluster stars (i.e., [13]) or their initial Li abundance. Unresolved old star clusters in external galaxies are also routinely employed to constrain the early stages of the star formation history of the host galaxies, by determining ages and initial metallicities from their integrated colours/spectra ([25]).
Here it is adopted the ‘evolutionary’ definition of ‘old’, i.e. clusters are denoted as ‘old’ when they are populated by stars that produce an electron degenerate He-core at the end of the Main Sequence (MS). In terms of Colour-Magnitude-Diagrams (CMDs) these clusters show a well developed Red Giant Branch (RGB). Their age is older than≈1 Gyr. Resolved old star clusters, and in particular the well populated globular clusters (GCs) of the Milky Way and the old clusters in the neighbouring Magellanic Clouds, are a formidable test bench for stellar evolution models of low mass stars. The next sections present a brief summary of some recent tests for stellar evolution models driven by photometric and spectroscopic observations of resolved, old star clusters.
2. PHOTOMETRIC DIAGNOSTICS
Photometry of large sample of stars produces CMDs and Luminosity Functions (LFs – star counts as a function of magnitude) that are compared to the corresponding predictions of theoretical isochrones, to highlight (in)consistencies between theory and observations. The common wisdom that GCs are simple stellar populations (SSPs) made of stars with the same age and initial chemical composition
ae-mail:[email protected]
EPJ Web of Conferences
has been recently shattered by observations of CNONa (and sometimes also MgAl) anticorrelations among stars within individual clusters (see, i.e., [10]). These observations are commonly interpreted in terms of multiple (quasi-coeval) generations of stars born out of primordial matter polluted by the winds of either massive AGB or fast rotating massive first generation stars (see, i.e., [27]). As a byproduct of these processes, one expects that also the He-abundance varies to some degree amongst stars in individual clusters. This undoubtedly makes the use of some observations for stellar model-testing more problematic.
2.1 RGB effective temperature
Due to the roughly ‘vertical’ nature of the RGB in bolometric magnitude-Teffdiagrams (that minimises the effect of uncertainties in distance moduli), and the independence of its location on age for old populations, Teff estimates for RGB stars in Galactic GCs have been since long used to test the adequacy for more advanced evolutionary phases (and different initial chemical compositions) of the solar calibration of the free parameter aml in the mixing length theory (MLT), used to calculate the temperature gradient in superadiabatic convective regions (see, i.e. [31]).
In fact, besides amlthere are 3 additional free parameters entering the MLT that are generally fixed a priori, before the calibration of aml. These three parameters – that determine the MLT ‘flavour’ – plus amlenter the equations that determinevc, the average convective fluxFcand the convective efficiency at each point within a convective region. Once these parameters are fixed, the temperature gradient and the resulting Teff, depend on the value of aml. On the other hand, when amlis kept fixed and one or more of the other three parameters are varied, the temperature gradients and Teffare also affected.
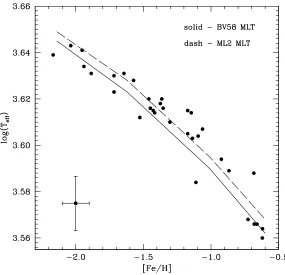
Figure1 displays a comparison between the average Teff at Mbol= −3 for a sample of Galactic GCs ([16]), and theoretical models calculated with a solar-calibrated aml for two different ‘flavours’ of the MLT ([29]). The dashed line displays models with the ‘standard flavour’ (BV58) of the MLT used in stellar evolution models ([8]), whereas the solid line displays models with the MLT flavour usually employed in WD model atmosphere calculations (MLT2). The value of solar calibrated amlis very different between the two cases (a difference by a factor∼3) but the two sets of predictions are very similar, with differences of only∼50 K, and are both generally consistent with the empirical Teff estimates.
2.2 RGB bump
The bump appearing in LF of RGB stars in GCs is produced by the encounter of the H-burning shell with the H-abundance discontinuity left over by the outer convection at its maximum depth, reached during the first dredge-up. The sharp increase in the H-abundance causes an abrupt decrease of the mean molecular weight (), that affects the efficiency of the H-burning shell, proportional to a high power of
Figure 1. Estimates of the average RGB Teffat Mbol= −3 for a sample of Galactic GCs (the typical error bars
are also displayed), compared to the corresponding values from models with two different ‘flavours’ of the mixing length theory.
conclusions). An alternative avenue explored recently ([14]) is offered by the magnitude difference between the MS Turn Off (TO) and the RGB-bump brightness VBumpTO . The values predicted by theoretical models for cluster ages estimated from the TO absolute magnitudes, are larger than observed in a small sample of well populated clusters with accurate photometry, as shown in Fig.3. Given that the observed TO magnitude is by definition matched by the theoretical isochrones to determine the TO age, this discrepancy implies that the absolute magnitude of the RGB-bump in the models is too bright. Realistic uncertainties in the cluster metallicities (and possible He spread within individual clusters associated to the CNONa abundance anticorrelations) and ages do not erase this difference. A possibility for mitigating the discrepancy is to include overshooting beyond the Schwarzschild boundary of the convective envelope. Convective overshooting decreases the RGB-bump brightness by∼0.8 mag/Hp(where Hp denotes the local pressure scale height). The discrepancy between theory and observations would disappear with the inclusion of convective overshooting of the order of∼0.25 below the Schwarzschild boundary of the convective envelope.
2.3 Tip of the RGB
EPJ Web of Conferences
Figure 2. The RGB-bump in the LF (right panel) obtained from GC photometric observations (left panel).
Figure 3. Difference between the values ofVbumpTO expected from the cluster TO ages, and measured values, as a function of the total metallicity [M/H].
considering the TRGB magnitude in a photometric system, the behaviour of the bolometric correction to the I-band as a function of [M/H] and effective temperature compensates for the variation of the bolometric luminosity with metallicity. The net effect is that MTRGB
I is predicted to be basically constant at values around MTRGB
Figure 4. TRGB magnitude in several photometric filters as a function of [M/H] for a typical GC age of 12 Gyr.
Empirical estimates forCen and 47Tuc are plotted with the estimated error bars.
Figure4shows the good agreement existing between modern theoretical predictions – that include recent advances in the determination of the14N(p, c)15O reaction rate and electron conduction opacities – for a typical GC age ([12]), and empirical estimates of the TRGB magnitude in different photometric bands for the Galactic GCsCen and 47Tuc ([7]). The cluster distances used in the empirical calibration are consistent with the values determined for eclipsing binaries in both clusters ([35] and [34]). This agreement highlights the reliability of TRGB He-core masses predicted by modern stellar evolution models and as a consequence, also the Zero Age HB theoretical predictions.
2.4 White Dwarf sequences
EPJ Web of Conferences
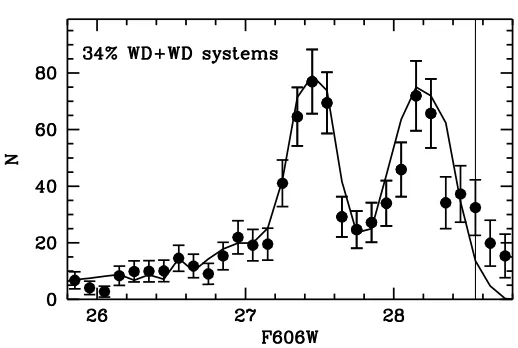
Figure 5. Observed WD luminosity function of NGC6791. Over-imposed is the theoretical counterpart for an age
of 6 Gyr and the labeled fraction of unresolved WD+WD binaries.
in the WD cores is produced by He captures on the14N left from H-burning via the CNO cycle. Because of its two excess neutrons relative to the predominant A=2Z nuclei, a downward force≈2mpg is exerted on 22Ne nuclei in the WD cores.This forces22Ne to settle towards the WD centre during the liquid phase. Sinking is stopped at the crystallization boundary. The variation of the 22Ne abundance provides additional energy through the term
LE
LX22Ne
T,V dX22Ne
dt (1)
that enters the WD energy generation coefficient. Here E is the internal energy per unit mass, V=1/q, and dX22Nethe mass fraction of22Ne.
3. SPECTROSCOPIC DIAGNOSTICS
Spectroscopic estimates of surface chemical abundances in GC stars belonging to different evolutionary stages, have disclosed ongoing shortcomings in our treatment of element transport in stellar interiors. 3.1 Chemical abundances from the TO to the RGB
Figure 6. Mean observed [Fe/H] values in 11 Teffbins, and associated errors, for a large sample of stars in the
Galactic GC M4, from the TO to the lower RGB. Solid and dashed lines display the predictions of an isochrone including diffusion, with initial [Fe/H]= −1.1 (solid line) after an age of 11 Gyr (dashed line).
example is given by
Dturb=400DHe(T0)
q q(T0)
−3
(2) that represents a turbulent mixing coefficient that is 400 times larger than the He atomic diffusion coefficient at a given temperatureT0 and varies as−3. The temperatureT0 is a free parameter that is tuned to adjust the region where this turbulent mixing is efficient. In practice, this corresponds to enhancing the diffusion term that opposes the creation of chemical gradients in radiative zones. Data for NGC6397 are reproduced for log(T0)∼6.0.
3.2 Chemical abundances along the RGB
Numerous observations in GC and field halo RGB stars (see, i.e., [1], [19]) provide compelling evidence of a mixing process that occurs when low-mass stars reach the RGB bump brightness along the RGB. At this stage, the surface carbon isotopic ratio drops, together with the abundances of lithium and carbon, while that of nitrogen increases slightly. Thermohaline mixing has been identified as the mechanism that should be the cause of these abundance variations. This additional transport mechanism is induced by the molecular weight inversion created by the 3He(3He, 2p)4He reaction in the external wing of the advancing H-burning shell. This reaction converts two particles into three and decreases the mean molecular weight. The instability is expected to set in after the burning shell has crossed the H-abundance discontinuity left over by the first dredge-up, and starts moving in a region of uniform composition. At this stage the small molecular weight inversion due to3He burning affects the chemical profile and enables thermohaline instability to set in. Formally, the thermohaline instability occurs in a stable stratification that satisfies the Ledoux criterion for convective instability,
∇ad− ∇ +
EPJ Web of Conferences
but the molecular weight decreases with depth: ∇:=d ln
d ln P <0 (4)
with ∇ =(*ln T/*ln P), =(*ln/*ln)P,T and = −(*ln/*ln T)P,, ∇ and ∇ad being the molecular weight gradient and the adiabatic gradient, respectively.
The element transport is treated as a diffusive process, with diffusion coefficient (that multiplies the chemical abundance gradients) equal to
Dt=CtK
−∇
(∇ad− ∇)
for∇<0, (5)
where K is the thermal diffusivity, and
Ct= 8 3
22, (6)
witha free parameter. A value Ct=1000 is necessary to reproduce the observational constraint ([15]). Recent hydrodynamics simulations ([36]) suggest however a much smaller value of Ct, of the order of 10, that would be largely insufficient to reproduce the observed post RGB-bump abundances.
3.3 Chemical abundances along the HB
Photospheric chemical abundances on the Horizontal Branch (HB) of Galactic GCs show striking variations with Teff. Above Teff∼11500 K He is underabundant and Fe, Ti, P, Cr Mn, Ni are enhanced by factors≈100 compared to cooler HB stars ([5]). The most straightforward explanation is that these anomalies develop through atomic diffusion processes, in particular gravitational settling and radiative levitation. However, the abrupt disappearance of strong abundance anomalies as one moves below ∼11500 K suggests that another factor plays an important role. In fact the only existing HB models that include self-consistently gravitational settling and radiative levitation ([21]) predict the onset of abundance anomalies at Teffwell below 11000 K.
A recent analysis ([26]) has addressed the observed correlation between the onset of abundance anomalies and surface rotation velocitiesv sinifor HB stars is a sample of Galactic GCs ([5], [6]). HB stars hotter than∼11000 K havev sinibelow∼5 km s−1, while at each Tefflower than this limit stars display a large range ofv sini, up to∼40 km s−1. First calculations ([26]) show that the dependence of abundance anomalies observed on the HB on Teffcan be explained by atomic diffusion transport if one introduces the competition of meridional circulation with the observed Teff dependence of the surface rotation velocity of HB stars. The prediction is that for stars cooler than∼11000 K, with high surface rotation velocities, meridional circulation is able to inhibit the effect of atomic diffusion.
4. CONCLUSIONS
References
[1] Angelou, G. C., Stancliffe, R. J., Church, R. P., Lattanzio, J. C., & Smith, G. H. 2012, ApJ, 749, 12
[2] Basu, S., Grundahl, F., & Stello, D. et al. 2011, ApJ, 729, L10 [3] Bedin, L. R. et al. 2005, ApJ, 624, L45
[4] Bedin, L. R. et al. 2008, ApJ, 678, 1279 [5] Behr, B. B. 2003a, ApJS, 149, 67 [6] Behr, B. B. 2003b, ApJS, 149, 101
[7] Bellazzini, M., Ferraro, F. R., Sollima, A., Pancino, E., & Origlia, L. 2004, A&A, 424, 199 [8] Böhm-Vitense, E. 1958, Zeitschrift für Astrophysik, 46, 108
[9] Brogaard, K., Bruntt, H., Grundahl, F., et al. 2011, A&A, 525, A2
[10] Carretta, E., Bragaglia, A., Gratton, R., & Lucatello, S. 2009, A&A, 505, 139 [11] Cassisi S., & Salaris, M. 1997, MNRAS, 285, 593
[12] Cassisi S., & Salaris, M. 2013, ’Old stellar populations: How to study the fossil record of galaxy formation’, Wiley, in press
[13] Cassisi, S., Salaris, M., & Irwin, A. W. 2003, ApJ, 588, 862
[14] Cassisi S., Marin-Franch A., Salaris M., Aparicio A., Monelli M., & Pietrinferni A., 2011, A&A, 527, A59
[15] Charbonnel, C., & Lagarde, N. 2010, A&A, 522, A10
[16] Frogel, J. A., Cohen, J. G., & Persson, S. E. 1983, ApJ, 275, 77
[17] Fusi Pecci, F., Ferraro, F. R., Crocker, D. A., Rood, R. T., & Buonanno, R. 1990, A&A, 238, 9 [18] Garcia-Berro, E et al. 2010, Nature, 465, 194
[19] Gratton, R. G., Sneden, C., Carretta, E., & Bragaglia, A. 2000, A&A, 354, 169 [20] Korn, A. J., Grundahl, F., & Richard, O. et al. 2007, ApJ, 671, 402
[21] Michaud, G., Richer, J., & Richard, O. 2007, ApJ, 670, 1178
[22] Miglio, A., Brogaard, K., & Stello, D. et al. 2012, MNRAS, 419, 2077
[23] Mucciarelli, A., Ferraro, F. R., Origlia, L., & Fusi Pecci, F. 2007, AJ, 133, 2053 [24] Mucciarelli, A., Salaris, M., & Lovisi, L. et al. 2011, MNRAS, 412, 81
[25] Puzia, T. H., Kissler-Patig, M., Thomas, D. et al. 2005, A&A, 439, 997 [26] Quievy, D., Charbonneau, P., Michaud, G. & Richer, J. 2009, A&A, 500, 1163 [27] Renzini, A. 2008, MNRAS, 391, 354
[28] Richard, O., Michaud, G., & Richer, J. 2005, ApJ, 619, 538 [29] Salaris, M., & Cassisi, S. 2008, A&A, 487, 1075
[30] Salaris M., & Weiss A., 2002, A&A, 388, 492
[31] Salaris, M., Cassisi, S., & Weiss, A. 2002, PASP, 114, 375 [32] Salaris, M., Weiss, A., & Percival, S. M. 2004, A&A, 414, 163 [33] Sandage, A., & Schwarzschild, M. 1952, ApJ, 116, 463
![Figure 3. Difference between the values of �VbumpTOexpected from the cluster TO ages, and measured values, as afunction of the total metallicity [M/H].](https://thumb-us.123doks.com/thumbv2/123dok_us/8992901.1437279/4.595.162.438.111.390/figure-difference-values-vbumptoexpected-cluster-measured-afunction-metallicity.webp)
![Figure 4. TRGB magnitude in several photometric filters as a function of [M/H] for a typical GC age of 12 Gyr.Empirical estimates for �Cen and 47Tuc are plotted with the estimated error bars.](https://thumb-us.123doks.com/thumbv2/123dok_us/8992901.1437279/5.595.147.436.124.408/figure-magnitude-photometric-lters-function-empirical-estimates-estimated.webp)
![Figure 6. Mean observed [Fe/H] values in 11 TGalactic GC M4, from the TO to the lower RGB](https://thumb-us.123doks.com/thumbv2/123dok_us/8992901.1437279/7.595.150.435.119.347/figure-mean-observed-fe-values-tgalactic-lower-rgb.webp)
