The Shear Response of Beryllium as a Function of Temperature
and Strain Rate
Carl M. Cady1, Cheng Liu1, Carl P. Trujillo1, Donald W. Brown1, and George T. Gray III1 1MST-8, MS-G755, Los Alamos National Laboratory, Los Alamos NM 87545, U.S.A.
Abstract. A new specimen design has been developed to measure the shear response of materials. This compact forced-simple-shear specimen (CFSS) has been utilized to measure the shear stress/shear strain response of other materials [1, 2]. Earlier, unpublished work on the shear response of beryllium using a split Hopkinson pressure bar (SHPB) with the shear compression specimen (SCS) [3] had limited success at higher strain rates due to compressive deformation in the web leading to tensile failure in the samples. The CFSS geometry was engineered to produce essentially “pure” simple shear, mode II in-plane shear, in a compact-sample geometry that eliminates the multi-mode loading of other sample geometries and produces direct measurements of shear deformation. The use of digital image correlation (DIC) to capture and calculate shear stress and shear strain when paired with this test geometry will be described. There are two competing mechanisms for the deformation in beryllium were observed, a brittle to ductile response due to increased temperature and a transition of the deformation mechanism from dislocation dominated slip to twin deformation as the strain rate is increased. The advantages of this specimen geometry and test results as a function of temperature and strain rate are discussed for high purity beryllium.
1 Introduction
The importance in understanding localization events in metals subjected to complex loading paths and/or high strain rates is frequently associated with shear failure. The development of predictive constitutive descriptions of strength, and thereafter damage-evolution and fracture models, requires an understanding of the microstructure and loading conditions when testing homogeneous engineered materials.
Because materials frequently develop shear bands during high-strain-rate loading, several experimental studies have focused on the development of techniques that can be readily used with high strain-rate loading equipment such as split-Hopkinson Pressure/Kolsky Bars, impact testing, drop-weight tests, and high-speed servo-hydraulic platforms. It is also important that these dynamic loading test methods are easily adaptable for testing over a range of temperatures while maintaining the ability to measure quantitatively the shear stress/shear strain response of the material of interest.
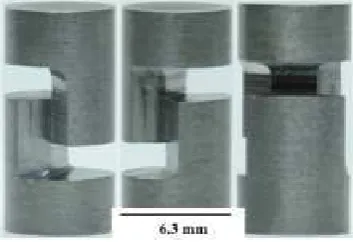
The compact forced-simple-shear sample design is shown in Fig. 1. The sample geometry is designed to align a single plane of shear parallel to the loading direction of the sample [4]. This geometry is useful because samples can be machined along specific orientations of crystallographic anisotropy to help evaluate properties specific to material texture
.
Along with the development and use of the new test geometry, digital image correlation (DIC) techniques were be used to directly measure local displacement and
strain. The underlying principle of digital image correlation as a deformation measurement technique is rather simple. It relies on the computer vision approach to extract the whole-field displacement data. This technique has been successfully used to measure deformation over a wide range of strain rates and has become an essential tool to measure both global and local strain [5].
Fig. 1. Photographs of CFSS test geometry from different orientations. The shear plane is 5 mm2 (2.65 mm long by 1.89
mm wide).
S200F beryllium as a function of temperature and strain rate.
2 Experimental procedure
2.1 Material and test samples
In this study tests were performed on S-200F beryllium from Brush Wellman, Inc. The total impurity level for this grade is typically below 1% and while the grain size varies considerably, the average is ~ 11 µm [6]. CFSS specimens were machined along the basal-textured, hot-pressing axis. The crystallographic texture in such samples is modest at <2 times random distribution [14]. The overall sample dimensions were 6.3 mm diameter by 12.7 mm long and further machined to the CFSS geometry. The undeformed shear area was measured to be 1.89 mm wide by 2.65 mm tall in the loading direction. There were two specimen sizes made for the shear compression samples (Fig 2.). The larger sample measured 12.20 mm tall by 6.1 mm wide by 6.1 mm thick. The web width was cut to ~ 1/3 the sample width (~2.03 mm) and a web height was ~ 2.8 mm measured vertically. The dimensions of the second sample were 9.3 mm tall by 4.8 mm wide by 4.8 mm thick and the web width was 1.7 mm and the web height axially was 2.36 mm. A speckle pattern was applied to the notch region of the sample using high temperature tolerant paint and an air brush to maintain a uniform and small speckle size. This speckle pattern was used to measure displacement and strain using the DIC techniques.
2.5 mm
Fig. 2. Photographs of compression shear test geometry from different orientations. The shear web in the loading direction is initially 2.36 mm tall and 1.7 mm wide (2.8 mm by 2.03 mm for the larger samples).
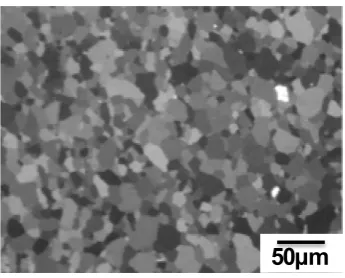
The microstructure of the hot pressed beryllium studied is shown in Fig.3. This image shows equiaxed randomly oriented grains. Notice also that there are few if any twin boundaries seen in this image.
2.2 Mechanical testing
Samples were loaded quasi-statically on an MTS 880 servo-hydraulic load frame equipped with heating platens that can uniformly heat the sample up to the desired test temperature. The SCS tests were run at a displacement rate of 0.0093 mm/s while the CFSS samples were loaded at 0.0127 mm/s.
50µm
Fig. 3. Optical micrograph from a hot-pressed beryllium billet showing equiaxed randomly oriented grain structure.
Both tests were run with strain control such that the sample could be immediately unloaded at the onset of sample failure. For the elevated temperature tests, the samples were held at the test temperature for a minimum of ten minutes prior to initiating the test. Time, displacement and load information were captured in order to calculate shear stress and shear strain and strain rate based on sample dimensions. Details of the stress strain calculation will be described later in the results section. A split-Hopkinson pressure bar (SHPB) was used to conduct dynamic testing on the two sample geometries. The SHPB system was a standard compression bar with 9.5 mm diameter 350 maraging steel bars and a 152 mm striker. The SHPB tests were conducted in a hazardous materials containment chamber to minimize potential exposure to beryllium dust in the event of specimen failure. There was no high-speed video capture of the compression shear tests, however, for the CFSS samples a video system was set up to capture images at 2 million frames per second and 108 frames were captured for the test. The strain rate of the test was calculated to be approximately 6000 s-1.
3 Experimental results
The load-displacement behavior for the hot pressed beryllium was found to be reproducible for both test geometries at low strain rates. Typical load versus displacement responses for the two test geometries are presented in Fig. 4 for the CFSS geometry and Fig. 5 for SCS geometry. The mechanical response of the two geometries is similar in that the material displays well defined shear deformation at low strain rates but at strain rates of ~ 103/s deformation is no longer clearly
shows very different mechanisms activated at the different strain rates.
Fig. 4. Load versus displacement response of the hot pressed beryllium for the CFSS geometry.
Fig. 5. Load versus displacement response of the hot pressed beryllium for the SCS geometry.
In the low rate tests the web width remained nearly constant and the “closing” gap changed by the amount consistent with the change in the angle of the top section relative to the bottom section indicating compression-shear deformation. However, besides the cracks that were observed on the loading surfaces additional differences in the deformation processes were noted. Specifically, the web was seen to collapse in compression producing a “barrel” shape in the web and the spacing of the slot was reduced by an amount that reflected more compressive displacement than shear. The image below shows that there was some shear deformation, but there was also a significant amount of compressive and tensile deformation. It is believed that the non-uniform compressive loads became large enough to initiate the tensile “split” that then propagated due to the low tensile strength of beryllium.
The CFSS test geometry proved to be equally well suited for low strain rate testing. However, it also proved to have limited success in obtaining the shear response of the beryllium at high strain rates. One area of success that was marginally better than the SCS geometry was the ability to more accurately determine the approximate yield stress under shear loading. All the samples tested at high strain rates exhibited failure off the plane of simple shear with cracking initiating in locations similar to that show in the right image of figure 7.
Fig. 6. The left image shows a low strain rate deformation image for the SCS geometry and the right image is of high strain rate deformation. Note in the high rate image the crack along the top surface of the sample.
The reasons for the minimal amount of shear deformation at high strain rates for both geometries is likely associated with a transition from a slip dominated deformation to twin dominated deformation that is oriented in such a way as to resist further “easy” shear displacement. More detail on this will be presented in the discussion section.
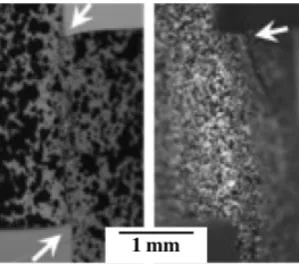
Fig. 7. Close up images of shear zone for the CFSS geometry. In the left image the arrows show clear indication of deformation indicating shear displacement. The arrow in the right image indicates a growing crack that is out of the plane of intended shear loading.
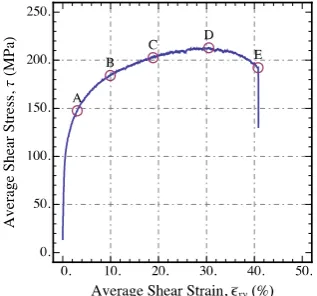
A sample analysis of a CFSS test at 300°C and a strain rate of ~ 0.0002 s-1 (Fig. 8) using DIC (Fig. 9)
shows that the strain fields are uniform during the deformation process up to the onset of failure at which time the strains localize and seem to propagate from the top and bottom of the gage length toward the center of the sample. The value of shear strain is obtained from the DIC analysis. It is obtained by measuring the average strain along the shear plane. Shear stress is calculated from the load over the gage area under shear loading.
section was about 8%. However, at low strain rates the material was able to be loaded to ~ 50% strain.
Fig. 8. Shear Stress versus Shear Strain with markers that correlate to the strain images shown in Fig. 9.
Fig. 9. Strain measurement using DIC at 300°C at a rate of 0.0002 s-1. Note the uniform strains in the sample up to the
maximum shear stress followed by localization upon further loading.
Fig. 10. Strain measurement using DIC on the low strain rate sample (300°C) (left) and high strain rate sample (20°C) (right). Note the magnitude difference in scale and the location of peak strain.
While beryllium is known to become much more ductile at elevated temperature, both test geometries nevertheless showed failures at strains considerably lower at high rates as compared with the low strain rate behavior.
The stress-strain response of the hot pressed beryllium is the SCS geometry (Fig. 11), and in the
CFSS geometry, (Fig. 12) shows a difference between the two techniques. The best comparison between the two plots is the 200 °C low rate tests. This comparison would indicate that there is a fundamental difference between the test techniques. Either the test geometry created the difference in strength or the calculation of the stress is incorrect for one of the two geometries.
Fig. 11. Shear Stress versus Shear Strain for the SCS geometry.
Fig. 12. Shear Stress versus Shear Strain for the CFSS geometry.
Stress was calculated using the following equations for the SCS geometry:
εeq = d/hw (1)
σeq = 0.85(1-0.2εeq)P/WgT (2)
with εeq being equivalent strain, d the displacement,
the height of the web, P is the applied load, Wg is the width of the gage, and T is the thickness of the sample. For the CFSS sample the average strain was measure from the image analysis file and the stress was calculated with the following equation.
τ = P/(Wg*Wh) (3)
4 Discussion and future directions
It has been shown in HCP metals that the relative contribution of active deformation modes may be shifted strongly by controlling deformation temperature and/or strain rate. It is well known, for instance, that increased strain rate (as well as decreased temperature) increases the activity of deformation twinning through the suppression of thermally-activated dislocation slip processes [15]. Earlier work on beryllium showed that the compressive response of this material was highly dependent on the strain rate of testing [16]. At the lowest strain rate applied to this material, deformation twinning is inactive and the increase in pole density near the straining direction is associated with slip on the basal system that rotates grains in a continuous manner and brings the slip plane normal parallel to the compression direction. At higher strain rates, deformation twinning becomes active as seen from optical microscopy (Fig. 13), and leads to an increase in the strength of this texture component.
Fig. 13. Post-deformation optical microscopy on samples tested at high strain rates provides direct evidence of the activity of twinning.
As in other hcp metals, deformation twinning in beryllium can be detected by bulk texture measurements. In this metal, deformation twinning results in a significant reorientation of the basal plane [9]. This dramatic change in the crystallographic orientation with strain induces substantial texture evolution and readily differentiates twinning from slip in a diffraction measurement. High-energy x-ray diffraction at beamline 1-ID at the Advance Photon Source was used to monitor the discrete texture evolution associated with deformation twinning in the SCS geometry on rolled beryllium. In the sample deformed at a low strain rate, the texture component associated with slipping grains is strong relative to that associated with twinning. At high strain rates, the “twin component” becomes much stronger. Initially, the basal poles are strongly aligned transverse to the rolling direction. Both basal slip and twinning act to align the basal poles with straining direction. Deformation twinning results in a discrete, rather than continuous, texture evolution at high rate. Thus increased twinning activity results in the increase development of the basal fiber.
As the scattering images indicate, twinning plays little role in the deformation at low strain rate. At the highest strain rate achieved (1500/sec), twinning is responsible for a more significant fraction of the
deformation but it is still not the predominant deformation mode. Thus, while it is certainly true that while twinning becomes more important at higher strain rates, it should not be considered to be the dominant deformation mode. Twin dominated deformation usually has a lower yield and flow stress behavior than dislocation dominated deformation. Once the ability for twinning is saturated dislocation dominated deformation dictates the strength of this material. When twin formation is suppressed or occurs discretely the material hardens much more rapidly, as seen in the high strain rate tests.
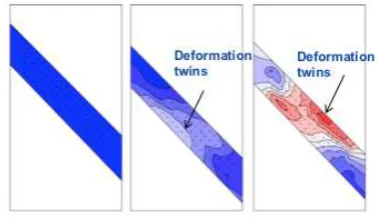
Fig 14. X-ray diffraction results showing basal peak intensity indicating the increase in twinning associated with different loading rates. The left image is of undeformed material, center is for low strain rate deformation and the right image is of a sample deformed at high strain rates (~ 1500/s).
The kinetics of the two deformation mechanisms in beryllium are very different. Dislocation-controlled deformation involves diffusion and is thermally activated. Deformation twinning can be akin to a diffusionless phase transformation (e.g. Martensitic), with no change in crystal symmetry. Thus, while twinning should be less sensitive to changes in temperature or strain rate (unless the strain rate approaches the speed of sound), prismatic slip becomes more difficult with either increased strain rate or decreased temperature. As a consequence, the balance between the activity of prismatic slip and deformation twinning can be strongly affected by manipulation of the temperature or strain rate.
Since a similar hardening effect is seen in the CFSS test geometry it is assumed that these processes are also present. There remains the principle difference between the two test geometries to consider: the combined shear-compression of the SCS versus the simple mode II shear loading of the CFSS geometry. Several questions arise because of the geometric differences. How does the test geometry influence the twin formation? How quickly does twin formation saturate in the much smaller strain region of the CFSS geometry? Does this saturation cause the sample to fail away from the shear plane, as seen in the high strain rate tests? It is hoped that further investigation using neutron scattering and other techniques will provide answers to these questions.
5 Conclusions
the characterization of beryllium at low and high strain rates over a range of temperatures. The advantages of the CFSS design over the SCS geometry is that the stress and strain state in the gage section is essentially “pure” simple shear, or mode II in plane shear, in a compact-sample geometry. When the compact-sample geometry is tested in combination with the DIC technique the shear strain in the notch root can be directly measured. Although the strain measuring technique is equally applicable to the SCS geometry there are still challenges with the interpretation of the strain data because of the combined compression and shear stress states deformation that occur in this geometry.
As mentioned above, the main drawback of the SCS geometry is that the sample design does not constitute a “simple” shear loading stress state, but is rather a three-dimensional stress state [12] within the gage section restricting the ability of investigators to resolve deformation mechanisms that are activated by different modes of strain. Additionally, lateral fiction constraints at the loading faces may impose bending moments. In order for this sample design to deform in less complicated compression-shear, interfacial friction must be close to zero as the sample is loaded. Realistically, the assumption of no lateral frictional constraint on the loading faces when using a split-Hopkinson Pressure Bar is suspect given inertial considerations alone and worthy of an investigation that would clarify this assumption. If friction plays a significant role during dynamic loading then added complications from radial inertial effects can significantly affect the sample response..
Although the CFSS geometry is nominally a simple shear test geometry that is capable of being used over a wide range of strain rates and temperatures, it too displayed complications for testing beryllium. It proved to be equally challenging to use on this material at high strain rates. In its favor, the CFSS geometry is easily machined. It is easy to acquire a force displacement that ties directly to the shear stresses and strains. Additionally, there are minimal effects of boundary conditions on the development of “simple” shear deformation. Although this investigation was looking at a homogeneous material, an added benefit of the CFSS geometry is for alignment of the planar shear region oriented along directions within a materials microstructure thereby allowing systematic investigation of the shear response in anisotropic materials in directions of interest.
It is clear that the use of image correlation in conjunction with either test geometry is of great utility. Analysis of the strain fields of the SCS geometry would require significantly more experience and care since the strains are a combination of compression and shear stress-state components. However, it was utilized in this study to show uniform strain in the shear plane up to the point of failure, thus providing a clear path of analyzing the shear stress as a function of the maximum shear strain.
Finally, the shear stress-shear strain response of high purity hot-pressed beryllium with a random distribution of grain orientations under shear loading was studied over a wide range of strain rates, 10-4 to ~5x10⁴ /s and
temperatures. In similar results to those seen in compression, the yield point was only modestly dependent on temperature or strain rate, over 7+ orders of magnitude of strain rate studied. Beyond the yield point, flow stress and hardening rate were strongly dependent on strain rate, and on the relative contribution of slip and twinning to deformation.
Thus the observed and predicted increases in twin activity with strain rate are due to thermally-activated dislocation slip becoming more difficult as the strain rate was increased. In other words, twinning does not become easier with strain rate, but slip becomes more difficult to activate. This process of a lower propensity for slip is hypothesized to be the reason for the limited success of both test geometries to deform uniformly in shear at high loading rates.
Los Alamos National Laboratory is operated by Los Alamos National Security, LLC, for the National Nuclear Security Administration of the U.S. Department of Energy under contract DE-AC52-06NA25396.
References
1. C. Zhu, T. Harrington, V. Livescu, G.T. Gray III, K.S. Vecchio, Acta Mat. 118, 383-394 (2016) 2. C. Zhu, V. Livescu, T. Harrington, O. Dippo, G.T.
Gray III, K.S. Vecchio, Int. J. of Plast. 92, 148-163 (2017)
3. D. Rittel, S. Lee, G. Ravichandran, Exp. Mech. 42 58-64 (2002)
4. G.T. Gray III, K.S. Vecchio, V. Livescu, Acta Mat. 103, 12-22 (2016)
5. M.A. Sutton, S.R. McNeill, J.D. Helm, Y.L. Chao, Topics Appl. Phys. 77 323–372 (2000)
6. W.R. Blumenthal, R.W. Carpenter, G.T. Gray III, D.D. Cannon, S.P. Abeln, AIP Conf. Proc. 429, 411-414 (1998)
7. K. Bennett, R.B. Von Dreele, R. Varma, Los Alamos National Laboratory Tech. Rep. LA-UR-97-1234 (1997)
8. J.W. Christian, S. Mahajan, Prog. Mat. Sci. 39 23-91 (1995)
9. M.H. Yoo, Met. Trans. A, 12A, 409 (1981) 10. A.E. Abey, J. Appl. Phys., 41, 5254-5259 (1970) 11. T.A. Sisneros, D.W. Brown, B. Clausen, C.M.
Cady, C. Liu, H.M. Mourad, J. Almer, Denver X-Ray Conf. – Proceeding (2014)
12. D. Rittel, G. Ravichandran, S. Lee, Mech. Mater. 34 627-642 (2002)
13. M. Vural, D. Rittel, G. Ravichandran, Metal. Mater. Trans. A 34 2873-2885 (2003)
14. W.R. Blumenthal, D.W. Brown, C.N. Tome AIP Conf. Proc. 706 (1), 525-528 (2004)
15. S.G. Song, G.T Gray III, Acta Metal. 43, 2325-2337 (1995)