(UDC: 616.718.4-089.11:519.673)
The optimum location and diameter of an entry hole in the proximal femur
A. Mantes1, D. A. Eftaxiopoulos1*, C. K. Yiannakopoulos2
1 Department of Mechanics, School of Applied Mathematical and Physical Sciences, National
Technical
University of Athens, Zografou Campus, 15780 Athens, Greece Email: [email protected], [email protected]
2 Iaso General Hospital, 264 Mesogeion Av., 15562 Holargos, Greece
Email: [email protected] *Corresponding Author
Abstract
The optimum location and diameter, of an entry hole for an intramedullary nail, in the upper proximal femur, is investigated in this article. A comparative study for five different entry hole positions and seven different hole diameters at each position, has been pursued. The entry holes were located at the tip of the trochanter, at the superior, anterior and posterior parts of the lateral neck close to the trochanter and at the superior, anterior and posterior, medial parts of the neck close to the femoral head. Finite element analyses of the proximal femur, with and without the open holes, have been performed. The third generation standardized femur model was used in these finite element calculations. Results were obtained for the maximum principal stresses, the maximum principal strains and the maximum strain energy densities, on the uppermost, entry hole perimeters, for the estimation of a secondary fracture risk. All results indicated that the preferred entry locations are the tip of the greater trochanter and the lateral, superior, anterior part of the neck, independent of the hole diameter. Holes with diameters less than 12mm, emanating from the trochanteric fossa, sustain a fracture risk, among the highest. For a hole emanating from the trochanteric fossa, a lower fracture risk seems to exist for hole diameters greater than 12mm, than for hole diameters less than 12mm. For holes starting at the trochanteric fossa and at the anterior, medial upper neck, the fracture risk seems to decrease, with increasing hole diameters between 9mm and 11mm. For the entry locations, at the tip of the trochanter, the anterior, lateral, upper neck and the posterior, medial, upper neck, the fracture risk seems to increase, with increasing hole diameters between 9mm and 11mm.
Keywords: proximal femur, entry hole, location, diameter, fracture risk
1 Introduction
[1998] reamed twenty pairs of femurs either at the trochanteric fossa or at the tip of the greater trochanter. The femurs were subjected to compression until failure. They concluded that reaming at the trochanteric fossa weakens the femoral neck and creates a localized fracture initiation point. Gausepohl et al [2002] determined the correct entry point for an intramedullary nail, by studying radiographs of the medullary cavity. They concluded that the medial border of the greater trochanter, overlaying the tendinous insertion of the piriformis muscle or a point at 0.7mm anterior to the dorsal edge of the greater trochanter, are best suited entry points for a straight or a bent nail.
Deep et al [1999] and Kahan et al [1995] reported the creation of fractures in the femoral neck, during the treatment of a fracture in the femoral shaft, far away from the femoral neck. The cause for such fractures was attributed to the existence of multiple entry points or a single wrong entry point, for the insertion of intramedullary nails. Ostrum et al [2005] compared three different entry points around and on the tip of the greater trochanter, using three different kinds of nails. Their conclusion was that the tip of the trochanter is close to the “universal” starting point for the insertion of an intramedullary nail. Mahaisavariya et al [2006] studied the stress, strain and strain energy distributions in the proximal femur with a trochanteric gamma nail and after the removal of it. They concluded that the removal of the nail may lead to high risk of femoral neck fracture.
The purpose of this work is the investigation of the optimum location and diameter of an entry hole for an intramedullary nail. This is effected by calculating the maximum principal stress, the maximum principal strain and the strain energy density fields at the upper most perimeter of the entry hole in the proximal femur. These quantities give an estimation of the fracture risk. Entry holes, emanating from five different locations on the upper femoral cortex and terminating at the upper end of the intramedullary canal, were opened. These locations were:
1. The lateral, posterior, superior part of the neck, close to the trochanteric fossa. 2. The tip of the greater trochanter.
3. The lateral, anterior, superior part of the neck close to the trochanter. 4. The medial, posterior, superior part of the neck, close to the femoral head. 5. The medial, anterior, superior part of the neck, close to the femoral head.
At each entry location, holes of five different diameters, ranging from 9mm to 15mm, at intervals of 1mm, were opened.
2 Methods
2.1 The Standardized Femur
The Standardized Femur, a geometrical analogue of the femoral bone, consisting of the cortical and the trabecular parts, was first proposed as a common basis for numerical and experimental analysis, by Viceconti et al [1996]. Such a proposal followed the results of an extensive validation study on a commercially available femoral bone analogue presented by Cristofilini [1996]. The solid model of the the Standardized Femur or composite femur, was made available at no cost from the web page of the Biomechanics European Laboratory 1, converted to several different file formats. In its first edition, the model did not contain the intramedullary canal. Cheung et al [2004] created a geometrical representation of the third generation Standardized Femur, which differed from its previous counterparts in the region of the neck. However, this realization did not contain the intramedullary canal too. Day et al [2005] modified the model of Cheung et al [2004], by incorporating the intramedullary canal in it. The new geometry was made publicly available via the web page of the Biomechanics European Laboratory. This last model, i.e the third generation Standardized Femur containing the cortical bone, the cancellous bone and the intramedullary canal, was used in the current analysis. The model consists of two parts, namely the cortical bone and the spongy bone and is in the Solidworks format (.sldprt). It was converted to ABAQUS (.sat) format for subsequent use and finite element analysis within the ABAQUS finite element package, by using the commercial converter product Transmagic.
Since our main interest lies on the proximal femur, the femoral model was cut in the middle of the diaphysis, retaining only the upper cortical and the upper cancellous bones, while the lower cancellous bone and the lower cortex were discarded. A picture of the augmented, intact i.e without holes, proximal femoral model, can be seen in Figure 1, in shaded mode.
Figure 1. The intact proximal femur.
As it is evident from Figure 1, our model corresponds to a proximal left femur. A similar picture in wire frame mode, where the cortical part, the trabecular part and the intramedullary canal appear, is included in Figure 2.
Figure 2. The cortex, the trabecular bone and the intramedullary canal, in the intact proximal femur.
2.2 The entry holes
On the intact, proximal, femoral geometrical model, obtained from the third generation Standardized Femur, we opened entry holes for intramedullary nails. The tool for opening the holes was the preprocessor ABAQUS/CAE 6.6 under the operating system Debian/GNU Linux. Five different entry positions on the upper femoral neck and on the greater trochanter were selected as locations of entry holes. These locations are shown in Figure 3.
Figure 3. The positions of entry holes on the upper femoral neck and on the trochanter.
ante
se the “correct” entry posi
per tapered part of the intramedullary canal. In Figure 4, a hole starting from the anterior, lateral part of the neck and terminating at the upper part of the intramedullary canal, is shown.
rior, lateral part of the neck, i.e at position 3 in Figure 3, led to a hole, almost coaxial to the intramedullary canal (see Figure 4).
Locations 3, 4 and 5 in Figure 3 are perceived as inappropriate entry points. However the knowledge of the mechanical field around holes reamed there, will help the comparative study with the field around holes opened at positions 1 and 2. The examination of the stress, the strain and the strain energy density fields around holes located at all the 5 positions that appear in Figure 3, having all the 7 diameters between 9mm and 15mm, will give insight into the secondary fracture risk, regarding each one of these 35 cases of hole reaming. Entry positions 3, 4 and 5 in Figure 3 may appear in surgical practice due to a miscalculation of the correct entry point, resulting to multiple entry points. Also these “wrong entry” locations may be used for on purpose eccentric piercing. Eccentric drilling may be opted for, becau
tion on the rear lateral part of the neck, i.e at the trochanteric fossa, may lead to secondary fractures at this location (Apivatthakakul and Arpornchayanon [2001] ).
All the holes that were opened, emanated from the upper part of the femoral cortex, were advanced through that cortex and through the upper trabecular bone and terminated at the up
A hole from the anterior, lateral part of the neck, to the upper pa
Figure 4. rt of the
s opened instead of a 14mm diameter one. In position 5, holes of d 15.2mm were opened, instead of 12mm, 13mm and 15mm
intramedullary canal.
At each entry location, from the five locations shown in Figure 3, holes of seven different diameters ranging from 9mm to 15mm, were created, at intervals of 1mm. In total, 35 different geometrical models of the proximal femur, pertaining to 5 different entry hole locations and 7 different hole diameters at each location, were created for subsequent finite element analysis. It should be noted that for a few particular diameters in some entry locations, the ABAQUS 6.6 CAE tool, did not succeed in opening the hole at exact intervals of 1mm. In these cases, the closest possible hole diameter at intervals of 0.1mm was sought and opened. In position 3, a hole of 13.6mm diameter wa
2.3 The finite element analysis
The 35 geometrical models of the proximal femur with the holes as well as the intact proximal femur without a hole, were analyzed via the finite element method. The commercial finite element package ABAQUS 6.6, under the open source operating system Debian/GNU Linux, was used for such an analysis. The two parts of the models, namely the cortical bone and the spongy bone, were meshed with linear, tetrahedral finite elements, each one containing 4 nodes. The number of elements varied in each of these 36 models, since the geometry in each model was
isotr
body was inclined at 11o to the vertical direction, within the frontal plane. Such a force corr
nsidered as fully bonded, i.e continuity of displacements was assumed along the interface between them.
femurs with holes or without a
sure that sma
different, due to the various hole diameters that were used. The cortical bone consisted of about 250000 elements on average and the spongy bone consisted of about 200000 elements on average.
Both the cortical and the trabecular bone materials were considered as linear, elastic and opic, with different material properties. According to Mahaisavariya et al [2006], values of 15GPa and 800kPa were assigned to the moduli of elasticity of the cortical and of the spongy bone respectively. A value of 0.3 was assigned to the Poisson’s ratio for both of these materials. According to Bay et al [1997] and Mahaisavariya et al [2006], a uniform pressure of 3.5MPa was applied on the femoral head, representing the hip contact surface traction. The surface where this pressure was applied, is the one that appears on the upper part of the femoral head in Figures 1 and 3 and has an area of about 520mm2. This surface was created from the
intersection of a horizontal plane with the outer cortex surface, when the longitudinal axis of the femoral
esponds to the hip contact and the intersegmental resultant, for a person weighing 60kg, during walking. The magnitude of the resultant force due to this contact pressure is about 1800N.
Zero displacements were imposed as boundary condition on the lower transverse surface of the diaphysis. The cortical and the cancellous parts were co
In all the 36 different geometrical models of
hole, that were studied, the analysis was quasi static.
3 Check on the convergence of the finite element method
As a check on the convergence of our finite element model, we analyzed the proximal femur with entry holes of different diameters, located in position 1, laterally and posterior at the neck, i.e at the trochanteric fossa, close to the footage of the greater trochanter (see Figure 3). The hole diameters varied from 9mm to 15mm, generally at intervals of 1mm, thus forming seven different geometrical models, with holes emanating from position 1. The intact model, i.e. the proximal femur with no hole in it, or equivalently with a hole of zero diameter, was also considered as an eighth case. For each one of these geometrical models, three different meshes were created for the cortical bone, with indicative average element sizes of 7mm, 3.5mm and 2.8mm respectively. In all these three cases the indicative average element size for the trabecular bone was kept constant at 5mm. For both the cortical and the trabecular bone regions, the curvature control during mesh generation, a measure of how accurately a curved geometrical surface is represented by the discrete, adjacent, finite element surfaces, was kept equal to 0.02. It should be noted that the smaller the curvature control is during mesh generation, the more accurately a curved surface is represented by the adjacent to the surface, finite elements. By taking a relatively small value for the curvature control, we make
trochanter, where we have small curvatures. This region is of our prime interest, because a fracture is most likely to start either from the upper neck or from the upper trochanter.
In Figure 5 the maximum principal stress distribution on the upper neck, head and trochanter of the intact (with no hole) femur is shown. The average element size for this mesh is 2.8mm. As it is evident, the extreme maximum value of the tensile principal stress, occurs on the upper neck. This is the location where secondary fractures usually initiate, due to hole reaming and nailing. On the right hand side and on the top of the femoral head, we can see the area of application of the hip contact uniform pressure of 3.5Mpa. In the main part of this area, the maximum principal stress variation is from -3.762MPa up to -1.980MPa. The applied hip contact pressure there is 3.5MPa, i.e within the range indicated by the result in Figure 5. This happens because no shear stress was applied on the upper head and the pressure there is a principal stress.
Figure 5. The maximum principal stress distribution on the upper intact femur.
Figure 6. The maximum principal stress distribution around a 15mm diameter hole, located at the trochanteric fossa (position 1).
Now the hole acts as a stress concentrator and the peak value of the tensile principal stress develops at the hole circumference. The stress concentration, i.e the ratio of this peak stress with respect to the peak stress on the upper neck of the intact femur, is about 4. Such a high stress level may be the reason for secondary fractures emanating from this location, like those reported by Apivatthakakul and Arpornchayanon [2001].
circumference (this was th l stress developed, on the
upper part of the head - neck - trochanter region) versus the hole diameter, for three different mesh di
In Figure 7 we can see the graphs for the maximum principal stress at the hole e position where the maximum principa
scretizations.
The triangles on each curve, represent the actual values of the maximum principal stress on the hole circumference, for each hole diameter. The triangles are interconnected by straight line segments, for visualization of the trend of the results. We observe that the two polylines that correspond to the finer meshes, i.e to the indicative average element sizes of 3.5mm and 2.8mm, ose to each other. These two lines are far enough from the curve which corresponds to the coarse mesh of average element size of 7mm. Such an observation is expected since the
nite element analysis has been performed correctly.
expect to have stress concentrations at the circumference of the hole. This is due to the cutting edge (wedge) that is created, along the hole circumference, at the entry point, on the upper femoral surface. Each hole has a circular cross section, but in the finite element mesh the trace of the hole on the upper femoral surface, is a polyline, non - planar one. Although the diameter of the cross section of the hole is the same, for all the three meshes, the trace of the entry polygonal line is different in each mesh. As our results indicated, the maximum principal stress for each hole diameter and mesh case, develops at the hole, polyline perimeter, on the upper femur. Since the perimeter has a different shape for each mesh and high stress values develop at this location, this may be the reason for the discrepancies in the values of the stresses, between the three curves.
4 Results
Results were obtained for the maximum principal stress, the maximum principal strain and the strain energy density in the cortical bone, on the superior part of the femoral neck and on the superior part of the greater trochanter, since these are the locations where secondary fractures m
w
In Figure 8 we can see the graphs for the maximum principal stress at the hole entry circ
are quite cl
geometry of the upper proximal femur is highly variant, especially at the entry hole region, and a coarse mesh, is by no means an appropriate option. However, in the case of an intact proximal femur, i.e a femur without an entry hole or equivalently with a hole of zero diameter, the value of the maximum principal stress is essentially the same for all the three meshes. This last observation is an indication that the fi
In the case of the femur with a hole, there are discrepancies in the values of the maximum principal stress that are obtained from the three different meshes, for most diameters. We
ay start, due to hole reaming. The former quantities were selected for calculation, since they ill indicate a possible fracture risk.
Figure 8. The maximum principal stress on the upper femur versus the hole diameter, for all five positions of the entry hole.
The average finite element size is 2.8mm. As it is evident from Figure 8, the smaller values of the stresses on the upper femur, occur when the entry hole emanates either from the lateral, anterior part of the neck or from the tip of the greater trochanter, independent of the hole diameter. The least values of the maximum principal stresses are obtained when the entry hole is located at the tip of the greater trochanter, independent from the hole diameter. The fact that the hole at the tip of the greater trochanter, generates a stress concentration which is the smallest among all the entry hole positions, may be attributed to the local geometry in this area, which in turn affects the local stress distribution. The second smallest stress values are obtained when the hole is located at the anterior, lateral part of the upper neck (position 3). All the other three entry locations (red, cyan and blue lines in Figure 3) seem to lead to significantly larger stress concentrations, on average 2.5 times larger, than the two aforementioned ones (yellow and green lines in Figure 3).
Note that, although location number 1 in Figure 3 is considered as an appropriate entry location in medical practice, in this study appears to sustain high stress concentrations. The stresses at this position, are among the highest, for diameters less than 12mm. This happens, although locations 4 and 5 near the head, are closer to the hip contact pressure application area, than location 1.
It is also interesting that, regarding this entry location at the trochanteric fossa, the stresses at the hole circumference are smaller for large diameters (greater than 12m ) than for small
di t
sen
evident from Figure 7 nce
are smaller for large diameters (greater than 12mm) than for small diameters. This is an indi
proximal femur, is highly variable around the trochanteric foss
may in turn relieve the high stresses.
m
ameters. In order to further investigate this “strange” behavior, we performed a finite elemen sititvity analysis with three different meshes and the results appear in Figure 7. As it is
, for all the three different meshes, the stresses at the hole circumfere
cation that the finite element analysis has been performed correctly. Note that the local geometry and topography of the
Further, at entry positions 1 and 5, i.e at the trochanteric fossa and at the anterior, medial part of the upper neck, the stresses either remain more or less stationary or decrease slightly, for diameters less than 11mm. For positions 2, 3 and 4, i.e at the tip of the greater trochanter, at the anterior, lateral upper neck and at the posterior, medial upper neck, the stresses follow a generally increasing trend, for diameters less than 11mm.
Figure 9 depicts the maximum principal stress distribution around a 9mm diameter hole, located at the medial, posterior part of the upper neck (location 4).
Figure 9. The maximum principal stress distribution around a 9mm diameter hole, located at the medial, posterior part of the upper neck (position 4).
The global maximum of the maximum principal stress develops at the circumference of the hole, in the cortical bone region.
In Figure 10 we can see the variation of the maximum principal strain at the hole entry perimeter, versus the hole diameter, at all the five different positions of the entry hole.
The average finite element size is 2.8mm. The trend of the maximum principal stains is qualitatively similar to the trend of the maximum principal stresses, shown in Figure 8. We note that we work with a linear elastic material for which the linear stress - strain relation holds. Looking at the values of the maximum principal strain, we see that these are less than 0.005, i.e they are small enough to justify a small strain analysis for the cortical bone.
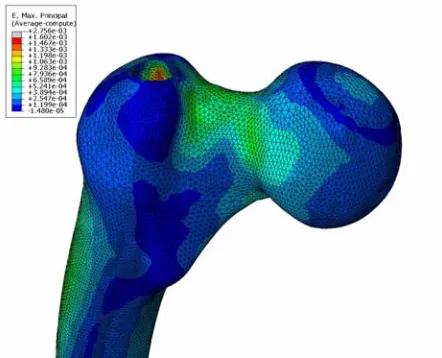
A representative view of the local strain distribution at the upper femur, with a 13mm diameter hole at position 2, i.e at the trochanter, is shown in Figure 11.
Figure 11. The maximum principal strain distribution around a 13mm diameter hole, located at the greater trochanter (position 2).
We observe a strain concentration at the hole, with the greatest strains developing in the spongy bone. The values of the maximum principal strains in the cortical
parable to the values of the maximum principal strain
the change of the maximum strain energy density at the h
bone, at the hole
periphery, are com s developing at the
upper neck.
In Figure 12 ole circumference,
e maximum strain energy density on the upper femur, versus th for all five positions of the entry hole.
e average element size is 2.8mm. The strain energy density is a e strains, for a linear elastic material. The evolution of the strain
Figure 12. Th e hole diameter,
Again, th quadratic form of
the stresses or th energy density
in Figure 12 is qualitatively similar to the evolution of the maximum principal stresses and strains. Again, independent of the hole diameter, the preferred positions for an entry hole are the tip of the greater trochanter and the lateral, anterior part of the neck.
A particular view of the strain energy density distribution around an 11mm diameter hole, located at the lateral, anterior part of the upper neck, is shown in Figure 13.
Figure 13. The strain energy density distribution around an 11mm diameter hole, located at the lateral, anterior part of the upper neck (position 3).
The absolute value of the latter is bigger than the value of the maximum principal stress captured at the hole periphery on the upper neck. This is the reason that the global maximum of the stra n energy density, which involves product terms of stresses and/or strains, develops at i the lower neck. These excessive compressive stresses at the lower neck region are not of our interest in this study. Cortical bone is a brittle material with much greater strength in compression than in tension. Our interest lies at the location where we have large tensile stresses in the cortical bone, i.e mainly at the upper neck and trochanter area. This is the location for a secondary fracture initiation due to tensile failure of the cortical bone.
An evince of the strain energy density distribution, around a 10mm diameter hole, at the medial, anterior part of the upper neck (location 5), is depicted in Figure 14.
Figure 14. The strain energy density distribution around an 10mm diameter hole, located at the medial, anterior part of the upper neck (position 5).
In this case the global maximum of the strain energy density, appears to be sited at the hole circumference. This is due to the proximity of this hole to the area of application of the hip contact pressure. The tensile stresses and strains have now bigger absolute values than their compressive counterparts at the medial part of the lower neck.
5 Conclusions
Finite element analyses of the proximal femur with open entry holes for an intramedullary nail, at five different locations and for seven different diameters, have been performed in this study. The secondary fracture initiation risk has been investigated, by calculating the maximum principal stress, the maximum principal strain and the strain energy density distributions, at the upper neck and trochanter. The main conclusions are:
• Regarding the entry location at the trochanteric fossa and for hole diameters less or equal to 12mm, the fracture risk seems to be among the highest ones, of all hole locations and diameters that were considered. Also all calculated quantities, i.e maximum principal stresses, maximum principal strains and strain energy density, seem to attain smaller values for large hole diameters (greater than 12mm) than for small hole diameters (less than 12mm).
• For holes emanating from the trochanteric fossa and from the anterior, medial part of upper the neck, the fracture risk remains more or less stationary or decreases slightly, for diameters less than 11mm. For all the other entry positions, i.e. at the tip of the greater trochanter, at the anterior, lateral, part of the upper neck and at the posterior, medial part of the upp
amedullary nail, there is a gap between the nail and the open hole. This gap is g
e literature as point forces, with much less magnitude than the hip contact force, at the walking state. Incorporation es in the current finite element model, albeit possible and straight forward, would xcessive values of stresses, strains and strain energy density, at the point of their
vici
from
Mis in relevant publications in the literature, e.g by Mahaisavariya et al
seco of the neck and on the
dist rior femoral neck and of the superior
trochanter. Cortical bone is generally a brittle material, while the von Mises stress is related to er neck, the fracture risk follows a generally increasing trend, for diameters less than 11mm.
6 Discussion
The intramedullary nail itself, was not considered in our analysis. The mechanical field around the open holes was calculated for two main reasons. In the initial healing process, after the insertion of the intr
radually filled by newly generated bone due to bone remodeling. Also, the intramedullary nail may be removed after healing and this may lead to increased risk of femoral neck fracture, as Mahaisavariya et al [2006] have reported. Thus the field around an open hole is important.
The loading case that we have dealt with in this study is related to the walking state of a 60kg heavy human. Examination of the case of a lighter or heavier human, would have led to exactly the same qualitative prediction, regarding the location and rank in terms of magnitude, of the maximum principal stresses, the maximum principal strains and the strain energy density. This holds because in linear elasticity the proportionality law between the applied loads and the output stresses and strains, holds.
Among all the forces that act on the proximal femur, we have used only the hip contact pressure and the intersegmental resultant. These forces are those that are considered as concentrated (point) forces acting at the center of the femoral head in the work by Mahaisavariya et al [2006]. In our current study we treated these forces as a distributed pressure load, acting on the upper part of the femoral head. We have not used muscular and other forces that act on the proximal femur. Most of the latter forces are reported in th
of these forc have led to e
application. It is well known that in linear elasticity theory, the stresses at the point of application of a concentrated force, are infinite. In a finite element analysis, the stresses at the
nity of the point of application of a concentrated force, increase in magnitude as the number of elements increases, making any check of convergence questionable. These excessive stresses might have led to the wrong conclusion that a fracture may start from the lower trochanter or the upper diaphysis, while clinical observation suggests that secondary fractures due to hole drilling start at the upper neck and trochanter area.
In this article the maximum principal stress was calculated in the results, instead of the von es stress, which is used
[2006]. As mentioned before, in this study our main interest lies on the study of the risk of ndary fracture initiation, which is localized on the superior part
the von Mises yield criterion, associated with ductile materials like the cancellous bone. Hence maximum principal stress was selected for evaluation. As it is evident from Figure 8, Figu
the re
the
den antity since it involves stresses and strains and it is also a scalar, i.e
Figu
aver
hole
quas
acci ey are more related to slowly varying activities, like walking.
and
the h
The third generation Standardized Femur model, that was used in this study for finite element analyses, is by no means a universal model, capable of encapsulating the geometrical shape of most human femurs. Its geometry may have significant differences, especially in the neck region (Greer et al [1999]), from real human femurs. Hence, conclusions drawn from this analysis, should not be automatically transferred to patient specific cases.
References
Apivatthakakul T, Arpornchayanon O (2001). Iatrogenic femoral neck fracture caused by mal-insertion of a curved intramedullary nail, Injury - International Journal for the Care of the Injured, 32, 727-729.
Bay BK, Hamel AJ, Olson SA, Sharkey NA (1997). Statically equivalent load and support conditions produce different hip joint contact pressures and periacetabular strains, Journal of Biomechanics, 30(2), 193-196.
Cheung G, Zalzal P, Bhandari M, Spelt JK, Papini M (2004). Finite element analysis of a femoral retrograde intramedullary nail subject to gait loading, Medical Engineering and Physics, 26, 93-108.
Cristofolini L, Viceconti M, Capello A, Toni A (1996). Mechanical validation of whole bone composite femur models, Journal of Biomechanics, 29, 525-535.
Day R, Sivandran S, Abeywickrema S. (2005). The third generation standardized femur with the intramedullary canal. Personal Communication.
Deep K, Sharpa I, Hay SM (1999). Femoral neck fracture complicating intramedullary nailing of femoral shaft. Injury - International Journal for the Care of theInjured, 30, 445-447. 10 and Figure 12, the qualitative trend of the results regarding the maximum principal stress,
maximum principal strain and the strain energy density, is the same. The strain energy sity, is a more global qu
direction independent. The qualitative agreement of the results in Figure 8, Figure 10 and re 12, justifies our selection of the quantities that were plotted.
Comparative results in Figure 7, Figure 8, Figure 10 and Figure 12, refer to average element values. Results for individual hole cases in the rest of the Figures, refer to average nodal values. Average element values generally have a different magnitude than nodal values at the nodes of an element. In this study, average element values were generally bigger than
age nodal values and this is the reason that they were used in the comparative results. Average nodal values give a continuous distribution of the calculated quantity (while average element values do not) in the bone and that is the reason that they were used in the individual
cases results.
In this work, we investigated the fracture risk at the superior neck and trochanter, using a i static analysis. These results are not applicable to fast dynamic loading cases, e.g. car dent injuries etc. Th
In our analysis, the proximal femur model consists of two parts, namely the cortical part the cancellous part. Each part is assigned a unique material property, i.e is considered as consisting of a homogeneous material. In reality, bone material properties vary at different locations, depending on bone density, trabecula orientation, trabecula dimensions e.t.c. Also, in current analysis bone material properties are considered as isotropic, while living bones ibit anisotropic mechanical response.
Gausepohl T, Pennig D, Koebke J, Harnoss S (2002). Antegrade femoral nailing: an anatomical determination of the correct entry point, Injury - International Journal for the Care of the Injured, 33, 701-705.
Greer B, Wang E, Jiang Y (1999). On the appropriateness of using the Standardized Femur for 669-670.
oral neck fracture: a
Mahaisavariya B, Sitthiseripratip K, Suwanprateeb J (2006). Finite element study of the proximal femur with retained trochanteric gamma nail and after removal of nail, Injury, 37,
E, Shrive N, Bray RC (1993). The effect of the entry hole for an he strength of the proximal femur, The Journal of Bone and Joint
(2005). A critical analysis of the eccentric starting c intramedullary femoral nailing, Journal of Orthopaedic Trauma,
esaeter LB, Gjerdet NR, Orner T (1998). Mechanical effects of of the point of entry in femoral nailing, Archive of Orthopaedic
ari B, Cristofilini L, Bassini S, Toni A (1996). The standardized posal for a reference geometry to be used for the creation of finite
e femur, Journal of Biomechanics, 29(9), 1241
FEA in the proximal region, Summer Bioengineering Conference of the ASME, 42,
Khan FA, Ikram MA, Badr AA, Al-Khawashki H (1995). Fem complication of femoral nailing, Injury, 26(5), 319-321.
778-785.
Miller SD, Burkart B, Damson intramedullary nail on t
Surgery, 75-B(2), 202-206.
Ostrum RF, Marcantonio A, Marburger R point for trochanteri
19(10), 681-686. Strand RM, Molster AO, Eng
different localization
Trauma and Surgery, 137, 35-38. Viceconti M, Casali M, Mass