GSJ: Volume 7, Issue 11, November 2019, Online: ISSN 2320-9186
www.globalscientificjournal.com
Optimal Placement of Distributed Generation in Power System
Using Particle Swarm optimization
Engr. Chizindu Stanley Esobinenwu1 and Engr. Dr. J.P.ILoh 2 1
Department of Electrical/Electronic Engineering, University of Port Harcourt, Rivers State, Nigeria. 2
Department of Electrical/Electronic Engineering, Chukwuemeka Odumegwu Ojukwu University Uli, Anambra State.
Email: [email protected]
Abstract
In electric power system, most of the electrical energy losses occur in the distribution system. Power loss in a distribution system is high because of low voltage and hence high current. The overall efficiency of the distribution system can be improved by integrating distributed generation (DG). However, the placement of DG unit at non optimal places can have a negative impact on the distribution system. This paper proposed the use of particle swarm optimization (PSO) for the optimal placement of Distributed Generation (DG) with the aim of reducing system losses and improving voltage profile. Etap 12.6 software was used to model the 73-bus system and the search space was reduced to 35 candidate buses using Newton-Raphson power flow method. The load flow result is further passed to PSO which determines the optimal DG placement. Distributed generation (DG) units of 25 MW gas turbine power plants were implemented on the test system The result obtained shows that 10 buses [Bus17, Bus21, Bus31, Bus37, Bus42, Bus54, Bus57, Bus59, Bus67, and Bus68] indicates the optimal location for DG placement. It was reviewed that the maximum reduction in line losses was achieved and the overall power losses reduced from [37.817MW, 239.832MVar] to [17.543MW,119.842MVar] using particle swarm optimization method. With DG integration at optimal location, the power demand required from the grid could be reduced thus cutting the need to strengthen the feeders connecting the network to the grid.
1.0 Introduction
centres. Unlike the conventional power generation system that are centralized, DGs are decentralized, modular, with more flexible technologies. Integration of DGs can impact negatively on the distribution system if placed at a non-optimal location. Therefore, it is important for planning engineers to adopt a proficient optimization method in solving problems related to DG placement and sizing. Growing interest in the application of artificial intelligence (AI) techniques to power system engineering has introduced the potential of using this state of the art technology. Some of the advantages of AI techniques over analytical and classical methods are the ability to adapt to nonlinearities and discontinuities commonly found in power systems. Secondly, they perform better in terms of accuracy and convergence for complex network. Thirdly, they are versatile for handling various qualitative constraints which enables them to compute multiple optimal solutions in a single simulation. Therefore, are quite suitable in solving multi-objective optimization problems. Particle swarm optimization (PSO) is a population-based optimization technique inspired by social behavior of bird flocking or fish schooling. The technique offers a powerful approach in finding the global solution for optimization problems. The PSO algorithm starts with a population of particles with random positions in the search space. Each particle is a solution of the problem and has a fitness value or objective function. A velocity is defined which directs each particle’s position and gets updated in each iteration. Particles gradually moves toward the optima position due to their personal best experience and the global best experience the entire swarm.
2.0 Literature Review
Several literature reviews on the success made in using PSO for optimal placement of DG and its impact in power distribution system formed a key basis in choosing PSO as the most effective optimization method. Mounika et al. (2017) proposed the work on particle swarm optimization application for optimal location of multiple distributed generators in power distribution network. The proposed technique effectively solved multiple DGs optimal location problem.
Shaik et al. (2017) presented loss minimization and voltage profile improvement using autonomous group particle swarm optimization in a distributed power system. The results show that AGPSO has merit compared to other algorithms in terms of convergence speed, particularly for problems of higher dimensionality. Noradin (2013) proposed a method for placement of distributed generation (DG) units using particle swarm optimization. The result showed that DG placement affects the active power loss, reactive power losses and voltage profile.
Ali et al. (2012) proposed PSO based multi objective approach for optimal sizing and placement of distributed generation. The obtained results showed that any change in the weight of each parameter in the destination function of PSO algorithm and in the matrix of coefficients leads to a meaningful change in the location and capacity of the prospective DG.
Deepak et al. (2014) has presented optimal placement and sizing of distributed generation(DG) to minimize active power loss using particle swarm optimization (PSO). The results showed the overall losses of the system are reduced by optimal placement of the DG.
Riccardo et al. (2007) presented an overview of particle swarm optimization. The paper comprises a snapshot of particle swarm from authors’ perspective, including variations in the algorithm, current and ongoing research, applications and open problems.
Musa et al. (2015) carried out a review of particle swarm optimization (PSO) algorithms for optimal distributed generation placement. The review has shown that PSO algorithms are very effective in handling the DG placement and sizing problem.
Krischonme et al. (2013) presents a new methodology using particle swarm optimization (PSO) for the placement of distributed generation (DG) in the radial distribution systems to reduce the power loss. The simulation results show that PSO can obtain the maximum power loss reductions.
Alrashidi (2006) presents a survey of particle swarm optimization applications in electric power systems. It highlights the PSO key features and advantages over various optimizations.
3.0
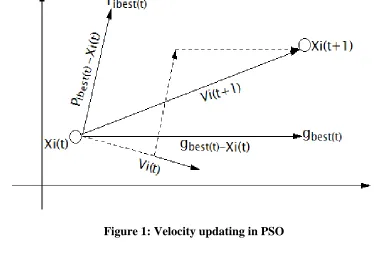
PSO Model for Optimal DG LocationFigure 1: Velocity updating in PSO
(
) ( ) (1)
(2)
Where
= initial position of particles = initial velocity of particles
= particle new position
= particle new velocity
= personal best experience of particles
c1,c2 = acceleration coefficient r1,r2 =random numbers[0,1] w = inertial coefficient
( ) = cognitive component ( ) = social component
4.0 Result and Discussion
Table 1: Bus Voltage Profile (PSO Method)
Bus ID Nominal kV Voltage(kV) Voltage (p.u)
BUS 1 132 135.96 1.03
BUS 2 132 133.007 1.01
BUS 3 132 133.951 1.01
BUS 4 132 134.566 1.02
BUS 5 132 132.652 1.00
BUS 6 33 33.362 1.01
BUS 7 33 33.867 1.03
BUS 8 33 33.17 1.01
BUS 9 33 32.866 1.00
BUS 10 33 32.319 0.98
BUS 11 33 33.011 1.00
BUS 12 33 32.979 1.00
BUS 13 33 32.626 0.99
BUS 14 33 32.887 1.00
BUS 15 33 31.86 0.97
BUS 16 33 32.707 0.99
BUS 17 33 33 1.00
BUS 18 33 32.752 0.99
BUS 19 33 32.712 0.99
BUS 20 33 32.561 0.99
BUS 21 33 33 1.00
BUS 22 33 32.304 0.98
BUS 23 33 32.87 1.00
BUS 24 33 31.786 0.96
BUS 25 33 32.369 0.98
BUS 26 33 32.682 0.99
BUS 27 33 32.499 0.98
BUS 28 33 32.76 0.99
BUS 29 33 31.797 0.96
BUS 30 33 32.352 0.98
BUS 31 33 33 1.00
BUS 32 33 32.636 0.99
BUS 33 33 32.852 1.00
BUS 34 33 32.407 0.98
BUS 35 33 32.097 0.97
BUS 36 33 32.349 0.98
BUS 37 33 33 1.00
BUS 38 33 32.73 0.99
BUS 39 33 31.39 0.95
BUS 40 33 31.749 0.96
BUS 41 33 32.341 0.98
BUS 42 33 33 1.00
BUS 44 33 32.778 0.99
BUS 45 33 32.876 1.00
BUS 46 33 32.601 0.99
BUS 47 33 32.694 0.99
BUS 48 33 32.512 0.99
BUS 49 33 32.59 0.99
BUS 50 33 32.58 0.99
BUS 51 33 32.587 0.99
BUS 52 33 32.591 0.99
BUS 53 33 32.431 0.98
BUS 54 33 33 1.00
BUS 55 33 32.58 0.99
BUS 56 33 32.518 0.99
BUS 57 33 33 1.00
BUS 58 33 32.79 0.99
BUS 59 33 33 1.00
BUS 60 33 32.089 0.97
BUS 61 33 31.573 0.96
BUS 62 33 31.489 0.95
BUS 63 33 32.411 0.98
BUS 64 33 32.672 0.99
BUS 65 33 32.241 0.98
BUS 66 33 32.742 0.99
BUS 67 33 33 1.00
BUS 68 33 33 1.00
BUS 69 33 32.691 0.99
BUS 70 33 31.713 0.96
BUS 71 33 31.698 0.96
BUS 72 33 32.274 0.98
BUS 73 33 32.242 0.98
Table 2: Line Flow And Losses (PSO Method)
ID MW Flow Mvar Flow kW Losses kvar Losses
Line1 318.416 227.289 3652 9419
Line2 130.417 92.29 1016 2395
Line3 75.213 53.284 406 740
Line4 42.134 24.725 59.591 -0.646
Line5 83.397 62.27 37.811 77.165
Line6 115.267 73.7 65.332 149
Line7 73.965 57.176 30.507 58.005
Line8 64.696 39.407 14.106 21.045
Line9 29.591 23.743 3.538 -6.677
Line10 35.111 26.752 4.79 -3.393
Line11 35.465 23.493 4.408 -4.542
Line12 39.342 29.051 5.826 -0.822
Line13 12.879 2.648 0.433 -14.517
Line14 29.192 22.099 3.36 -6.836
Line16 4 -8.677 6.263 6.086
Line17 9.564 5.931 8.799 9.091
Line18 10.781 6.755 169 178
Line19 28.801 17.893 80.439 93.481
Line20 2.7 4.5 1.889 0.935
Line21 17.471 10.843 30.136 34.255
Line22 14.89 9.282 108 121
Line23 20.268 12.583 41.861 48.103
Line24 15.418 9.567 23.385 26.299
Line25 10.604 6.576 10.861 11.525
Line26 9.513 5.899 8.842 9.161
Line27 13.618 8.448 17.817 19.711
Line28 11.898 7.381 14.441 15.809
Line29 15.594 9.677 23.947 26.963
Line30 0.301 -1.822 1.167 -5.075
Line31 26.235 16.377 219 254
Line32 8.848 5.494 27.323 27.473
Line33 11.053 6.877 59.481 63.792
Line34 17.732 11.109 231 262
Line35 10.449 6.507 70.92 75.191
Line36 0.9 -5.323 18.7 10.02
Line37 11.948 7.426 45.57 49.421
Line38 16.481 10.314 195 221
Line39 12.623 7.84 35.213 38.877
Line40 9.799 6.115 99.154 103
Line41 7.6 1.458 47.945 41.524
Line42 11.096 6.905 62.551 66.843
Line43 9.916 6.167 49.945 51.991
Line44 6.468 4.013 17.245 14.742
Line45 8.727 5.424 40.355 40.562
Line46 7.281 4.517 17.006 15.795
Line47 10.33 6.42 41.41 43.737
Line48 11.728 7.28 24.445 26.477
Line49 10.259 6.368 23.804 25.092
Line50 11.141 6.915 24.062 25.816
Line51 10.654 6.612 22.003 23.391
Line52 11.951 7.44 71.66 77.912
Line53 14.5 20.913 163 187
Line54 13.092 8.128 30.463 33.566
Line55 11.892 7.391 45.731 49.665
Line56 6.2 18.33 133 150
Line57 14.681 9.132 68.433 76.328
Line58 6.2 8.266 127 128
Line59 10.189 6.346 71.916 76.084
Line60 7.285 4.533 54.197 51.908
Line61 7.998 4.985 76.274 75.959
Line62 5.019 3.11 2.476 1.671
Line63 3.73 2.31 4.702 1.103
Line64 11.154 6.949 81.267 87.427
Line66 6.8 15.204 63.443 70.445
Line67 9.9 6.577 45.234 47.288
Line68 7.776 4.827 23.252 22.301
Line69 8.154 5.064 27.153 27.193
Line70 9.075 5.638 33.641 34.837
Line71 10.558 6.559 36.619 38.997
Line72 8.34 5.182 35.429 35.328
Line73 14.473 12.397 228 256
Line74 102.305 38.908 2861 3365
Line75 22.004 9.528 416 477
Line77 29.474 18.486 346 403
Line78 35 22.011 508 593
Line79 31.778 8.751 292 338
Line80 25.928 16.285 357 413
Line81 12.236 4.902 253 268
Line82 36.711 23.456 1160 1355
Line83 20.656 12.929 219 251
Line84 14.383 8.942 49.597 55.229
Line85 20.834 13.041 167 192
Line86 8.576 -6.002 126 127
The result obtained using PSO method for optimal DG placement in a distribution network is shown in table 1 and 2 respectively. Ten (10) buses [Bus17, Bus21, Bus31, Bus37, Bus42, Bus54, Bus57, Bus59, Bus67, and Bus68] indicates the optimal location for DG placement. Table1 shows the voltage profile of the distribution network using PSO method. A quick look at the voltage profile shows that there was no violation of bus voltage statutory limit (0. 95p.u – 1. 05p.u) that is 31.35KV- 34.65KV. Table 2 shows the line real and reactive power losses in the distribution system using PSO method. From table 2, it was reviewed that the maximum reduction in line losses was achieved and the overall power losses reduced from [37.817MW, 239.832MVar] to [17.543MW,119.842MVar]. With this, the power demand required from the grid could be reduced thus cutting the need to strengthen the feeders connecting the network to the grid.
5.0 Conclusion
process for PSO does not involve use of derivative function; instead it uses the fitness function value as a guide for finding optimal solution in problem space. This concept of PSO helps in eliminating the approximations and assumptions usually adapted on objective functions and constraints as in conventional optimization methods. For this reason, PSO is considered as a stochastic optimization method and found to be very efficient in handling problems that their objective functions are time varying or stochastic in nature.
REFERENCE
Ali, A., Mohsen, D., Majid, G., Mohammad, D.S., Robabe, J., Iraj, G., & Majid, D. (2012). PSO based multi objective approach for optimal sizing and placement of distributed generation. Research Journal of Applied Sciences. Engineering and Technology, Vol.4, No.22, pp. 4617-4624.
Alrashidi, M.R., EL-Naggar, K.M., & AL-Othman, A.K. (2009). Particle swarm optimization based approach for estimating the fuel-cost function parameters of thermal power plants with valve loading effects. Electrical Power Components and Systems, Vol.37, No.11, pp. 1219-123.
Bindumol, E.K. and Babu, C.A. (2016).Analytical and sensitivity approaches for the sizing and placement of single DG in radial system.Advances in Energy Research,4(2) 163-176.
Deepak, P., & Bhadoriya, J.S. (2014). Optimal placement and sizing of distributed generation(DG) to minimize active power loss using particle swarm optimization (PSO). International journal of Science and Technology Research, Vol.3, No.7, pp. 246-254.
Gupta B.R. (2005). Power system analysis and design. 14th ed. New Delhi: S. Chan &
Company.
Krischonme, B., & Weerachai, P. (2013). Optimal placement and sizing of distributed generation for loss reduction using particle swarm optimization. Energy Procedia, Vol.34, pp.307-317. Retrieved from https://doi.org/10.1016/j.egy.pro.2013.06.759
Mournika, L.P., Amit, J., & James, R.K. (2017). Particle swarm optimization application for optimal location of multiple distributed generators in power distribution network, Journal of Electrical and Electronic systems. Vol. 6, No.4, pp. 244- 248.
Musa, H., & Ibrahim, S.B. (2015). A review of particle swarm optimization(PSO) Algorithms for optimal distributed generation placement, International Journal of Energy and Power Engineering.Vol. 4, No.4, pp.232- 239.
Prakash, D.B., & Lakshminarayana, C. (2016). Multiple DG placement in distribution system for power loss reduction using PSO Algorithm. Procedia Technology, Vol. 25, pp.782-792. Retrieved from https://doi.org/10.1016/j.protcy.2016.08.173