R E G U L A R A R T I C L E
Open Access
The role of hidden influentials in the diffusion
of online information cascades
Raquel A Baños
1, Javier Borge-Holthoefer
1and Yamir Moreno
1,2**Correspondence:
[email protected] 1Institute for Biocomputation and
Physics of Complex Systems (BIFI), University of Zaragoza, Zaragoza, 50018, Spain
2Department of Theoretical Physics,
Faculty of Sciences, University of Zaragoza, Zaragoza, 50009, Spain
Abstract
In a diversified context with multiple social networking sites, heterogeneous activity patterns and different user-user relations, the concept of ‘information cascade’ is all but univocal. Despite the fact that such information cascades can be defined in different ways, it is important to check whether some of the observed patterns are common to diverse contagion processes that take place on modern social media. Here, we explore one type of information cascades, namely, those that are
time-constrained, related to two kinds of socially-rooted topics on Twitter. Specifically, we show that in both cases cascades sizes distribute following a fat-tailed distribution and that whether or not a cascade reaches system-wide proportions is mainly given by the presence of so-called hidden influentials. These latter nodes are not the hubs, which on the contrary, often act as firewalls for information spreading. Our results contribute to a better understanding of the dynamics of complex contagion and, from a practical side, for the identification of efficient spreaders in viral phenomena.
1 Introduction
Population-wide information cascades are rare events, initially triggered by a single seed or a small number of initiators, in which rumors, fads or political positions are adopted by a large fraction of an informed community. In recent years, some theoretical approaches have explored the topological conditions under which system-wide avalanches are pos-sible [–]; whereas others have proposed threshold [], rumor- [] or epidemic-like [] dynamics to model such phenomena. Beyond these efforts, digitally-mediated commu-nication in the era of the Web . has enabled researchers to peek into actual informa-tion cascades arising in a variety of platforms - blogs and Online Social Networks (OSNs) mainly, but not exclusively [, ].
Notably, these latter empirical works deal with a wide variety of situations. First, the online platforms under analyses are not the same. Indeed, we find research focused on distinct social networks such as Facebook [], Twitter [, ], Flickr [], Digg [] or the blogospehere [, , ] - which build in several types of user-user interactions to satisfy the need for different levels of engagement between users. As a consequence, although scholars make use of a mostly common terminology (‘seed’, ‘diffusion tree’, ‘adopter’,etc.) and most analyses are based on similar descriptors (size distributions, identification of in-fluential nodes,etc.), their operationalization of a cascade -i.e., how a cascade is defined -largely varies. This fact is perfectly coherent, because how information flows differs from one context to another. Furthermore, evenwithinthe same OSN different definitions may
be found (compare for instance [] and []). Such myriad of possibilities is not neces-sarily controversial: it merely reflects a rich, complex phenomenology. And yet it places weighty constraints when it comes to generalizing certain results. The study of informa-tion cascades easily evokes that of influence diffusion patterns, which in turn has obvious practical relevance in terms of enhancing the reach of a message (i.e.marketing) or for prevention and preparedness. In these applications a unique definition would be highly desirable, as proposed in classical communication theory []. On the other hand, the pro-fusion of descriptions and the plurality of collective attention patterns [] hinder some further work aimed to confirm, extend and seek commonalities among previous findings. In this work we capitalize on a type of cascade definition which pivots on time con-straints rather than ‘content chains’. Despite the aforementioned heterogeneity, all but one [] empirical works on cascades revolve exclusively around information forwarding: the basic criterion to include a nodeiin a diffusion tree is to guarantee that (a) the nodeisends out a piece of information at timet; (b) such piece of information was received from a
friendjwho had previously sent it out, at timet; and finally (c)iandjbecame friends
att, beforeireceived the piece of information (the notion of ‘friend’ changes from OSN
to OSN, and must be understood broadly here). Note that no strict time restriction exists besides the fact thatt>t>t, the emphasis is placed on whether thesamecontent is
flowing. This work instead turns to topic-specific data in which it is safely assumed that content is similar, and the inclusion in a cascade depends not on the retransmission of a message but rather on the engagement in a ‘conversation’ about a matter.
Beyond our conceptualization of a cascade, this work seeks first to test the robustness of previous findings in different social contexts [, ], and then moves on towards a better understanding of how deep and fast do cascades grow. The former implies reproducing some general outcomes regarding cascade size distributions, and how such cascades scale as a function of the initial node’s position in the network. The latter aims at digging into cascades, to obtain information about their temporal and topological hidden patterns. This effort includes questions such as the duration and depth of cascades, or the relation between community structure and cascade’s outreach. Our methodology allows to prove the existence of an evasive class of reputed nodes, which we identify as ‘hidden influentials’ after [], who have a major role when it comes to spawn system-wide phenomena.
2 Data
Our data comprise a set of messages publicly exchanged through www.twitter.com from the st of March, , to the st of March, . The whole sample of messages was filtered by the Spanish start-up companyCierzo development, restricting them to those that contained at least one of preselected hashtags (see Table ).Cierzo development exploits its own private SMMART (Social Media Marketing Analysis and Reporting Tool) platform, thus no details can be disclosed. The SMMART platform collects / of the total Twitter traffic, according to previous reports. The filtered hashtags correspond to distinct topics, thus we obtained different subsets to which we assign a generic tag.
Table 1 Filtered hashtags and keywords
Keyword Topic Hashtags Mentions Words
15m grassroots 389,818 3,475 132,049
acampada grassroots 13,732 3,423 76,689
acampadasol grassroots 251,344 90,737 3,866
anonymous grassroots 70,037 4,188 112,859
democraciarealya grassroots 81,256 1,893 8,798
indignados grassroots 23,371 348 185,615
nonosvamos grassroots 63,490 124 245
notenemosmiedo grassroots 35,249 106 55
occupy grassroots 18,223 1,467 39,037
perroflauta grassroots 1,394 20 26,325
spanishrevolution grassroots 242,426 926 3,123
20n elections 180,323 227 71,440
25m elections 59,812 40 11,887
elecciones elections 30,935 269 593,046
hondt elections 5 0 3,713
iu elections 2,726 1,127 33,168
nolesvotes elections 156,133 2,984 4,621
pp elections 20,412 3,106 201,136
psoe elections 14,896 22,681 122,222
vota elections 11,464 297 246,764
Both ‘grassroots’ and ‘elections’ data sets were collected filtering Twitter traffic according to related keywords, which are listed in this table. For each keyword we display the number of hashtags found (keywords preceded by ‘#’), the number of mentions (keywords preceded by ‘@’) and the number of words (keywords with no preceding symbol).
the M movement were included either for technical or for sociological reasons. For in-stance, ‘anonymous’ spontaneously arises from a previous ‘M’ dataset, which comprised messages exchanged from the th of April to the th of May, . During the gath-ering of data used in this work, this hashtag appeared with a relatively high frequency ( filtered tweets during the period under consideration) and therefore it was included in the filtering of messages. As far as ‘occupy’ is concerned, the movement at the origin of the hashtag (the Occupy Wall Street Movement) began long after the M grassroots appeared. However, one can find a clear correlation between both movements suggest-ing that M users were also involved in ‘occupy’. Indeed, it is well documented that the original call for mobilizations around Occupy Wall Street was inspired by both Egyptian uprising and the Spanish ‘indignados’ [, ].
The second dataset includes , filtered tweets that refer to the topic ‘Spanish elec-tions’, which were celebrated on the third week of November, . This sample was gen-erated by , unique users.
Using the Twitter API we queried for the list of followers for each of the users, discard-ing those who did not show outgodiscard-ing activity durdiscard-ing the period under consideration. In this way, for each data set, we obtain an unweighted directed network in which each node represents an active user (regarding a particular topic). A link from userito userjis es-tablished ifjfollowsi. Therefore, out-degree (kout) represents the number of followers
a node has, whereas in-degree (kin) stands for its number of friends,i.e., the number of
3 Methods
3.1 Time-constrained information cascades
Twitter is most often exclusivelydefined as a microblogging service, emphasizing its broadcasting nature. Such definition overlooks however other facets, such as the use of Twitter to interact with others, in terms of conversations[] orcollaboration, for in-stance connecting groups of people in critical situations [, ].Addressivityaccentuates these alternative features [, ]. Moreover, observed patterns of link (follower relation) reciprocity [] (see Table ) hint further the use of Twitter as an instant messaging sys-tem, in which different pieces of information around a topic may be circulating (typically over short time spans) in many-to-many interactions, along direct or indirect information pathways [].
It is precisely for this type of interactions where the definition of a time-constrained cascade is a useful tool to uncover how - and how often - users get involved in sequential message interchange, in which the strict repetition of contents is not necessary (possibly not even frequent). A time-constrained cascade, starting at aseedat timet, occurs
when-ever some of those who ‘hear’ the piece of information react to it - including replying or forwarding it - within a prescribed time frame (t,t+τ], thereby becomingspreaders.
The cascade can live further if, in turn, reactions show up int+ τ,t+ τ, and so on.
Thus, neighbors of a user that emits a message are considered part of the same cascade if they react to the message within a time windowτ. Moreover, since messages in Twitter are instantly broadcasted to the set of users following the source, we define listener cas-cades as those including both active (spreader) and passive participants. In considering so we account for the upper bound of awareness over a certain conversation in the whole
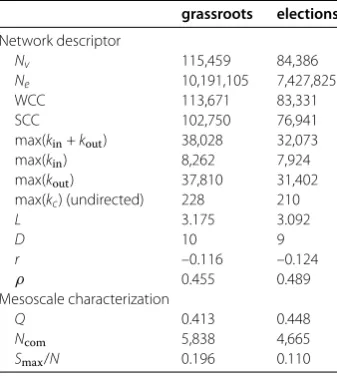
Table 2 Network properties summary
grassroots elections
Network descriptor
Nv 115,459 84,386
Ne 10,191,105 7,427,825
WCC 113,671 83,331
SCC 102,750 76,941
max(kin+kout) 38,028 32,073
max(kin) 8,262 7,924
max(kout) 37,810 31,402
max(kc) (undirected) 228 210
L 3.175 3.092
D 10 9
r –0.116 –0.124
ρ 0.455 0.489
Mesoscale characterization
Q 0.413 0.448
Ncom 5,838 4,665
Smax/N 0.196 0.110
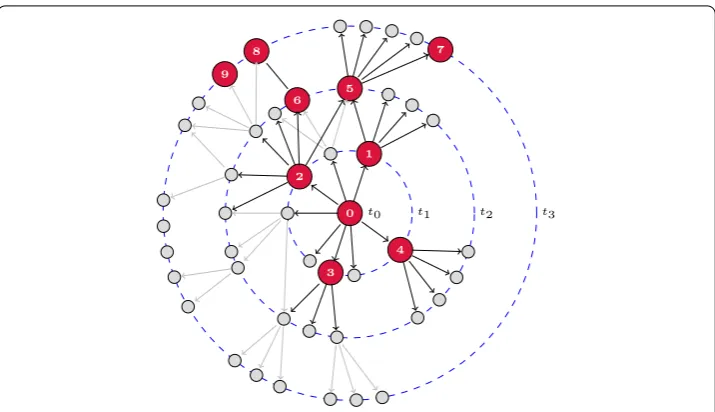
Figure 1 Time-constrained information cascade.Time-constrained cascades: nodes are disposed in concentric circles indicating the time when they received a specific tweet. Links between them represent the follower/friend relationship: an arrow fromitojindicates thatjfollowsi, as any tweet posted byiis automatically received byj. Red nodes are those who posted a new message at the corresponding time, whereas gray nodes onlylistenedto their friends. In this particular example, user 0 acts as the initial seed, emitting a message at timet0which is instantaneously sent to its nearest neighbors, laying on the first
dashed circle, who are counted as part of the cascade. Some of them (nodes 1, 2, 3 and 4) decide to participate at the following time step,t1=t0+τ, posting a new message and becoming intermediate
spreaders of the cascade. If any of their followers show activity att2=t0+ 2τthe process continues and the
cascade grows in size as new users listen to the message. The process finally ends when no additional users showed activity (as it happens in the cases of users 3 and 4), or when an intermediate spreader does not have any followers (users 7, 8 and 9).
population (see Figure for illustration). Admittedly, our conceptualization does not con-trol for exogenous factors which may be occurring at the onset of and during cascades.
We apply the latter definition [, ] to explore the occurrence of listener cascades in the ‘grassroots’ and ‘elections’ data. In practice, we take a seed message posted bysat timetand include all ofsfollowers in the diffusion tree hanging froms. We then check
whether any of these listeners showed some activity at timet+τ, increasing the depth
of the tree. This is done recursively, the tree’s growth ends when no other follower shows activity. Passive listeners constitute the set of leaves in the tree. In our scheme, a node can only belong to one cascade (but could participate in it multiple times); the mentioned restriction may introduce measurement biases. Namely, two nodes sharing a follower may show simultaneous activity, but their follower can only be counted in one or the other cascade (with possible consequences regarding cascade size distributions or depth in the diffusion tree). To minimize this degeneration, we perform calculations for many possible cascade configurations, randomizing the way we process data.
of circadian activity in human online behavior or the time differences due to individuals belonging to different geographical areas.
3.2 Community analyses
The identification of modules in complex networks has attracted much attention of the scientific community in the last years, and social networks constitute a prominent exam-ple. A modular view of a network offers a coarse-grained perspective in which nodes are classified in subsets on the basis of their topological position and, in particular, the density of connections between and within groups. In OSNs, this classification usually overlaps with node attribute data, like gender, geographical proximity or ideology [, ].
To detect statistically significant clusters we rely on the concept of modularityQ[]:
Q=
Ne
i
j
aij– kikj Ne
δ(Ci,Cj), ()
whereNeis the number of links in the network;aijis if there is a link from nodeitojand otherwise;kiis the connectivity (degree) of nodei; and finally the Kronecker delta function
δ(Ci,Cj) equals if nodesiandjare classified in the same community and otherwise. Summarizing,Qquantifies how far a certain partition is from a random counterpart (null model).
From the definition ofQ, algorithms and heuristics to optimize modularity have ap-peared ever faster and with an increased degree of accuracy []. All these efforts have led to a considerable success regarding the quality of detected community structure in net-works, and thus a more complete topological knowledge at this level has been attained. In this work we present results for communities detected using the Walktrap method [] in which a fair balance between accuracy and efficiency is sought. The algorithm exploits ran-dom walk dynamics. The basic idea is that a ranran-dom walker tends to get trapped in densely connected parts of the graph, which correspond to communities. Pons and Latapy’s pro-posal is particularly efficient because, asQis increasingly optimized, vertices are merged into a coarse-grained structure, reducing the computational cost of the dynamics. The re-sulting clusters at each stage of the algorithm are aggregated, and the process is repeated iteratively. Although results in the following section refer to a partition extracted through Walktrap, other methods (Louvain [] and Infomap []) have been tested with similar results.
A community analysis is useful because it provides a deeper understanding of the posi-tion of a node [] at an intermediate (i.e., mesoscale) topological level. In terms of infor-mation diffusion - and much like in [] - we explore whether community structure (and in particular, the relation of a seed node with the module it belongs to) has an impact on the success of a cascade. To do so we adopt the node descriptors proposed by Guimeràet al.in []: thez-score of the internal degree of each node in its module, and the partici-pation coefficient of a nodei(Pi) defined as how the node is positioned in its own module and with respect to other modules.
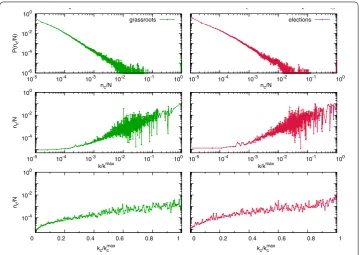
Figure 2 Cascade size distributions and seed attributes.Upper panels: cascade size distributions for the topics under consideration (left: ‘grassroots’; right: ‘elections’). Middle panels: average spreading capability (rescaled by the system size) grouped by the connectivity of the initial seed,k. Lower panels: spreading capability grouped by thek-core of the initial spreader. For the sake of comparison,kandk-core have been rescaled by their corresponding maxima.
deviation ofκinCi, then
zi=
κi–κCi σκCi
()
is the so-calledz-score.
The participation coefficientPiof nodeiis defined as:
Pi= – NM
C=
κiC ki
, ()
whereκiCis the number of links of nodeito nodes in moduleC, andkiis the total degree of nodei. Note that the participation coefficientPihas a maximum atPi= –NM, when thei’s links are uniformly distributed among all the modules (NM), while it is if all its links belong to its own module. Those nodes that deviate largely from average internal connectivity are local hubs, whereas large values ofPistands for connector nodes bridging different modules together.
4 Results
4.1 Cascade size distributions
manner, with only a small fraction of all cascades reaching system-wide proportions. This is also in good agreement with most preceding works, that have also found that large cas-cades occur only rarely. On the other hand, when cascas-cades are grouped together such that the reported size corresponds to an average over topological classes, we find that both the degreek(middle panels) and coreness (k-core, lower panels) of nodes correlate positively with cascades’ sizes. Some theoretical approaches predict similar behavior [, ].
4.2 Cascades’ temporal and topological penetration
Next, we characterize how deep - both temporally and structurally - a cascade unfolds. We define thetopological penetration,rof a cascade as the shortest path between the seed of the cascade and the farthest node involved in the cascade. The results shown in Figure (upper panels) give quantitative support to a well-known fact: over % of cas-cades actually die with one single spreader (instantaneous cascas-cades), which corresponds to a shallow tree - though it may be quite wide [, , ]. In this most frequent case, the cascade of listeners simply accounts for the out-degreekoutof the seed node (or a subset
of it, if any of its neighbors is already counted in another cascade). Additionally, the bulk of non-instantaneous cascades penetrates up tor= orr= (see middle panels in Figure ), both for ‘grassroots’ and ‘elections’, which is in the range of the average path length, but fairly below the upper bound, which is set by the network’s diameter ( and respectively; see Table ). Interestingly, as shown in the figure, when a cascade moves beyond the average path length between the initial node and any node on the network,
Figure 3 Topological and temporal penetration.Upper panels: distributions of topological and temporal penetrations for the topics under consideration (left: ‘grassroots’; right: ‘elections’).ris the largest shortest path length between the initial seed and any node involved in the same cascade, where astrefers to a cascade’s lifetime. Middle panels: box-plots for topological penetration. Note that large cascades occur mainly forrclose to the average path length (dashed vertical line). Lower panels: box-plots for temporal
namely, to nodes distantr> , a large fraction of the population will likely be engaged in a cascade that will reach system-wide sizes with high probability.
Temporal patterns, as given by the lifetimetof a cascade, follow a similar trend: most cascades die out after hours, which closely resembles previously reported results []. However, in Figure (upper panels) we observe a richer distribution (compared to topo-logical penetration r) such that cascades may last over days, suggesting that the survival of a conversation does not exhibit an obvious pattern. Again, this result confirms - from a different point of view - empirical results published elsewhere [, ]. Finally, the duration of cascades takes into account the fact that a node may participate multiple times in a single cascade - although it is counted just once. This is implicit in the defi-nition of a time-constrained cascade, which comprehends self-sustained activity. In any case, Figure (lower panels) illustrates that survival can not guarantee system-wide cas-cades, although an increasing pattern is observed as survival time grows.
4.3 Identification and role of hidden influentials
Up to now we have related a cascade’s size to certain features of the seed node. Al-though we observe a clear positively correlated pattern (the larger the seed’s descriptor, the larger the resulting cascade), one might fairly argue that in a wide range of values below the maximum, a similar outcome is obtained. So, for instance, seeds in the range –≤k/kmax≤–(Figure ) can sometimes trigger large cascades; the same can be said
forkc/kmax
c ≥.. This finding prompts us to hypothesize that the success of an activity cascade might greatly depend on intermediate spreaders characteristics, and not only on the properties of the seed nodes. That being so, a large seedkout(i.e.its follower set) may
be a sufficient but not a necessary condition for the generation of large-scale cascades. In this section we explore how some topological features of the train of spreaders involved in a cascade affects its final size.
To study the role of intermediate spreaders we split our results, distinguishing instan-taneous cascades (those with a unique spreader) from those with multiple spreaders. The former merely underlines the fact that the seed’skoutsuffices to observe large cascades.
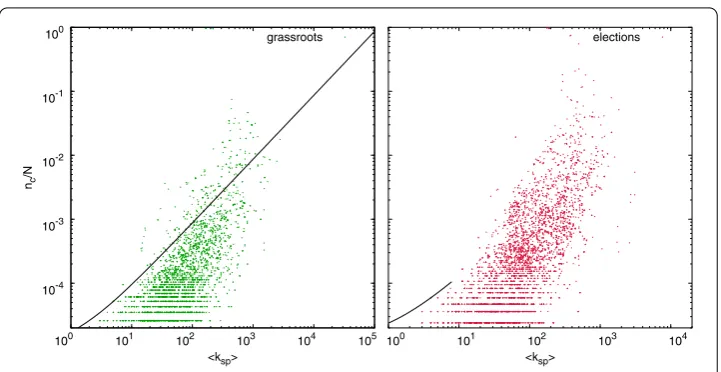
In-terestingly, the latter unveils a new character in the play:hidden influentials,i.e., relatively smaller (in terms of connectivity and centrality) nodes which, on the aggregate, can make chain reactions turn into global cascades. Figure , which confronts relative cascade sizes nc/Nwith the average degree of intermediate spreadersksp(that is, excluding the initial
seed), reveals these special users: note that larger effects are obtained for those spreaders who, on average, have to neighbors (both for ‘grassroots’ and ‘elections’). These
nodes do not occupy key topological positions that woulda prioriidentify them as influ-ential, and yet they play a major role promoting system-wide events [, ]. Therefore, getting these nodes involved has a multiplicative impact on the size of the cascades.
Figure 4 Intermediate spreaders connectivity.Cascade size vs. average connectivity of intermediate spreadersksp(left: ‘grassroots’; right: ‘elections’). Non-instantaneous cascades are displayed, where the initial
seed and its inactive listeners have been removed in order to dismiss the effect of the initial seed on the cascade size. There is a clear correlation between both magnitudes, although some unexpected behavior shows up: the existence of cascades containing ‘hidden spreaders’, users who are capable of generating large cascades despite not having hub-like connectivity. In both panels the functiony= (x+ 1)/Nis drawn as a reference.
Figure shows howl is distributed as a function ofkout. Top panels represent the
proportion of nodes withl> andl≤ per degree class. In this case, normalization takes into account all possiblekoutand alll(above and below ) counts, so as to evidence
that in most cases cascades progressively shrink as they advance. The fact that the area corresponding to the regionl> is much smaller than that forl≤ tells us that most cascades are small, which is consistent with the reported cascades’ size distribution. On the other hand, bottom panels in Figure focus on the same quantity, but in this case we represent the probabilityP(kout,l> ) (P(kout,l≤)) that a node of out-degreekout
has (does not have) a multiplicative effect. As before, the results indicate that, in both datasets, the most-efficient spreaders (those with a multiplicative number larger than one) can be found most often in the degree classes ranging fromkout= tokout= ,i.e.,
significantly belowkmax(see Table ). These nodes are the actual responsible that cascades
go global and must be engaged if one would like to increase the likelihood of generating system-wide cascades.
The previous features of hidden influentials poses some doubts about what is the actual role of hubs in cascades that are not initiated by them. Interestingly, we next provide quan-titative evidence that, in contrast to what is commonly assumed, hubs often act as cascade firewalls rather than spawners. To this end we have measuredknn(average nearest
neigh-bors degree) with respect to seed nodes. Each point in Figure represents the relationship between the size of cascades andknn. The initial trend is clear and expected: the larger
the average degree of the seed’s neighbors is, the deeper the tree grows. However, at some point this pattern changes, indicating that cascades may die out when they encounter a hub, more often than not. If this were not the case, one would observe a monotonically increasing dependence withknn. This counterintuitive hub-effect is mirrored in classical
Figure 5 Quantifying the multiplicative effect.Top panels represent the distribution of the multiplicative number,lfor both datasets as indicated. In most casesl≤1, which reflects the rare occurrence of large cascades. The bottom panels, instead, represent the probabilitiesP(kout,l> 1) (above 0 baseline) and P(kout,l≤1) (below it) that a node of out-degreekouthas or has not a multiplicative effect, respectively.
Both low- and high-connectivity nodes do not exhibitl> 1.
Figure 6 Nearest neighbors average degree.Cascades’ outreach as a function of seed’s average nearest neighbors degreeknn: remarkably, nodes with the highest connectivity do not enhance, but rather
diminish, cascades growth. As in the previous figure, largest cascades are obtained when second spreaders (the seed’s neighbors) have, on average, 102<k
out< 103for the (left: ‘grassroots’; right: ‘elections’).
4.4 The role of community structure in information diffusion
geographical and political information [], suggesting that a large fraction of interactions take place locally, but many of them also correspond to global modules - for instance, users rely on mass media accounts to amplify their opinion. Focusing on information diffusion, inter- and intra-modular connections in OSNs have already been explored [] regard-ing the nature of user-user ties. We instead investigate other questions, such as: (i) are modules actual bottlenecks for information diffusion?; (ii) is the spreading of information more successful for ‘kinless’ nodes (those who have links in many communities besides their own one)? Or (iii) do local hubs - those with larger-than-expected intra-modular connectivity - have higher chances to trigger system-wide cascades?
We apply the community analysis described in Section . and obtain a network par-tition inS= , andS= , modules, for the ‘grassroots’ and ‘elections’ data sets respectively, with optimizedQvalues and maximum module sizeSmax given in Table
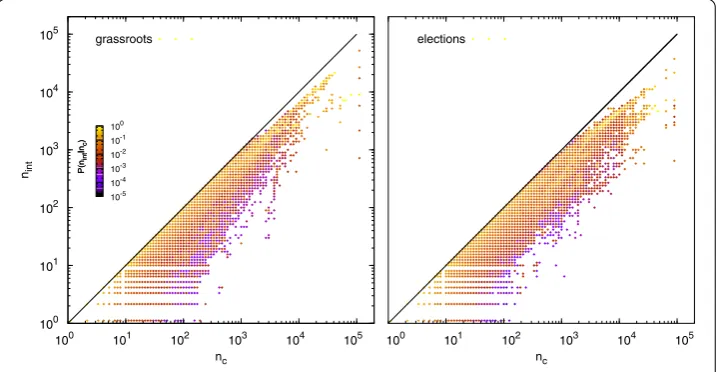
(note that we report only on results for the Walktrap algorithm). Next, for each cascade we compute how many nodes in the resulting diffusion tree belong to the same cluster of the seed (nint). This allows us to know, as shown in Figure , how often a cascade spills
over the module where it began. Interestingly, small to medium-sized cascades (∼)
mainly diffuse within the same community where they were initiated, which suggests that influence occurs within friendship circles or specialized topics []. Note however that our approach to community analysis is blind to contents or user metadata (age, name, hobbies,etc.), and relies solely on the underlying topology. Thus we can only make an ed-ucated guess regarding whether modules cluster users around a certain topic or personal acquaintance (i.e.assuminghomophily[, ]). Remarkably, our results match - qualita-tively at least - the predicted behavior in [, ] regarding cascades in modular networks, in the sense that inter-modular boundaries place actual constraints on information flow.
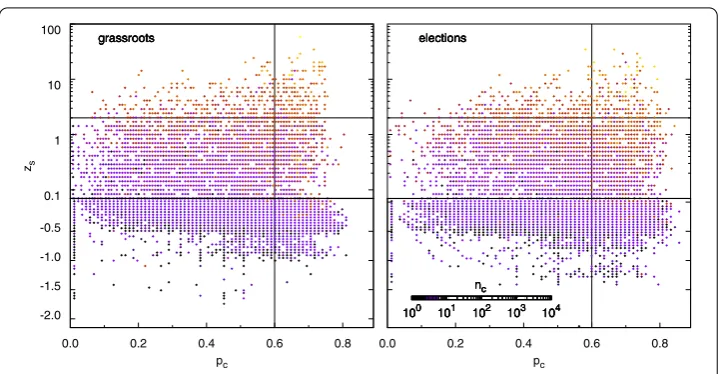
Turning to the individual level, the results depicted in thez-Pplane of Figure confirm the importance of connectivity - in this case, within-module leadership - to succeed when
Figure 7 Inter- and intra-modular cascading events.Inter- and intra-modular cascading events for the topics under consideration (left: ‘grassroots’; right: ‘elections’). Binned representation of the relationship between the number of nodes in a cascade that unfolds in the same community of the initial seed (nint) and
the size of the cascade itself (nc). Proportions have been normalized column-wise,i.e.by the total number of
cascades with same size. Note that cascades affecting up to 103nodes mostly lie close to the diagonal,i.e.a
Figure 8 Relation between seeds’ position in the mesoscale and final cascade size.Color-codedz-P planes to assess whether the modular structure of the following/friend network places dynamical constraints in the growth of cascades (left: ‘grassroots’; right: ‘elections’). A first clear result is that when local leaders (z> 2) precipitate information cascades, these tend to be more successful. More interestingly, connector nodes (Pi> 0.6) also succeed quite often, suggesting that a node’s position in the mesoscale can sometimes play a
more important role than a rich connectivity.
a cascade is triggered. Indeed, most nodes for which z> elicit large cascades in both samples. However, and most interestingly, it suggests that connector or kinless (Pi> .) nodes [] can perform better than expected at precipitating system-wide cascades if only internal connectivity is attended. As shown in the figure, nodes with az-score between and acting as connectors are still able to generate system-wide cascades because they compensate their relative lack of connectivity by bridging different modules. This feature is specially noticeable in the case of the ‘election’ dataset (right panel). Altogether, our results establish that topological modules indeed represent dynamical bottlenecks, which need to be bypassed - through high but also low connectivity users - to let a cascade go global.
5 Discussion
In just one decade social networking sites have revolutionized human communication routines, placing solid foundations to the advent of the Web .. The academia has not ig-nored such eruption, some researchers foreseeing a myriad of applications ranging from e-commerce to cooperative platforms; while others soon realized that OSNs could rep-resent a unique opportunity to bring empirical evidence at large into open sociological problems. Information cascades fall somewhere in between, both attracting the interest of viral marketing experts - who worry about optimal outreach and costs - and collective social action and political scientists - concerned about grassroots movements, opinion contagion,etc.
done to confirm results testing its robustness across different social platforms and social contexts.
In this regard, the present work capitalizes on previous research to collect, in new large datasets, the statistics of time-constrained information cascades. Message chains are re-constructed assuming that conversation-like activity is contagious if it takes place in rel-atively short time windows. The main preceding observed trends are here reproduced successfully. Furthermore, we extend the study to uncover other internal facets of these cascades. First, we have discussed how long in time and how deep in the topology cas-cades go, to realize that, as in neuronal activity, time-constrained cascas-cades can exhibit self-sustained activity. We have then paid attention not only to the nodes that trigger a cascade, but also to those that actively participate in and sustain a cascade beyond its on-set.
Our main results point at two counterintuitive facts, by which hubs can short-circuit information pathways and close-to-average users - hidden influentials - fuel system-wide events. We have found that for a cascade to be successful in terms of the number of users involved in it, key nodes should be engaged. These nodes are not the hubs, which more than often behave as firewalls, but belong to a middle class that either has a high multi-plicative capacity or bridges the modules that make up the system. Presumably, modular topologies - abundant in the real world - entail the presence of information bottlenecks (poor inter-modular connectivity) which place constraints to efficient diffusion dynamics. Indeed, we find that medium-sized and small cascades (the most frequent ones) happen mainly within the community where a cascade originated. Furthermore, those seed nodes which happen to be poorly classified (they participate in many modules besides their own) are more successful at triggering large cascades.
A better understanding of time-constrained cascading behavior in complex systems leads to new questions. First, it seems clear that the bulk of theoretical work devoted to information spreading is not meant to model this conversation-type dynamics - it is rather focused on rumor and epidemic models. Other approaches need to be sought to fill this gap. Also, time-constrained cascades have always been studied in the context of political discussion and mobilization. As such, this is a fairly limited view of what happens in a ser-vice with (as of late ) over million active users. Results like the ones obtained here will anyhow provide new hints for a better understanding of social phenomena that are mediated by new communication platforms and for the development of novel manmade algorithms for effective and costless dissemination (viral) dynamics.
Competing interests
The authors declare that they have no competing interests.
Authors’ contributions
RAB, JBH and YM conceived the experiments. RAB and JBH performed the analysis. All authors wrote and approved the final version of the manuscript.
Acknowledgements
We thank A Rivero for helping us to collect and process the data used in this paper. We are also indebted to
S González-Bailón and JP Gleeson for their useful comments on the manuscript. This work has been partially supported by MINECO through Grant FIS2011-25167; Comunidad de Aragón (Spain) through a grant to the group FENOL and by the EC FET-Proactive Project PLEXMATH (grant 317614). RAB acknowledges support from the FPI program of the Government of Aragón, Spain.
References
1. Watts D (2002) A simple model of global cascades on random networks. Proc Natl Acad Sci USA 99(9):5766-5771 2. Galstyan A, Cohen P (2007) Cascading dynamics in modular networks. Phys Rev E 75(3):036109
3. Gleeson J, Cahalane D (2007) Seed size strongly affects cascades on random networks. Phys Rev E 75(5):056103 4. Gleeson J (2008) Cascades on correlated and modular random networks. Phys Rev E 77(4):046117
5. Hackett A, Melnik S, Gleeson J (2011) Cascades on a class of clustered random networks. Phys Rev E 83(5):056107 6. Centola D, Eguíluz V, Macy M (2007) Cascade dynamics of complex propagation. Phys A, Stat Mech Appl 374:449-456 7. Borge-Holthoefer J, Moreno Y (2012) Absence of influential spreaders in rumor dynamics. Phys Rev E 85:026116 8. Leskovec J, McGlohon M, Faloutsos CG, Hurst M (2007) Cascading behavior in large blog graphs. In: Proc. 7th SIAM int.
conf. on data mining (SDM), pp 29406-29413
9. Liben-Nowell D, Kleinberg J (2008) Tracing information flow on a global scale using Internet chain-letter data. Proc Natl Acad Sci USA 105(12):4633-4638
10. Miritello G, Moro E, Lara R (2011) Dynamical strength of social ties in information spreading. Phys Rev E 83(4):045102 11. Sun E, Rosenn I, Marlow C, Lento T (2009) Gesundheit! Modeling contagion through Facebook news feed. In: Proc.
ICWSM
12. Kwak H, Lee C, Park H, Moon S (2010) What is Twitter, a social network or a news media. In: Proceedings of the 19th international conference on World Wide Web. ACM, New York, pp 591-600
13. Bakshy E, Hofman J, Mason W, Watts D (2011) Everyone’s an influencer: quantifying influence on Twitter. In: Proceedings of the fourth ACM international conference on web search and data mining. ACM, New York, pp 65-74 14. Cha M, Mislove A, Gummadi K (2009) A measurement-driven analysis of information propagation in the Flickr social
network. In: Proceedings of the 18th international conference on World Wide Web. ACM, New York, pp 721-730 15. Lerman K, Ghosh R (2010) Information contagion: an empirical study of the spread of news on Digg and Twitter
social networks. In: Proceedings of 4th international conference on weblogs and social media (ICWSM)
16. Gruhl D, Guha R, Liben-Nowell D, Tomkins A (2004) Information diffusion through blogspace. In: Proceedings of the 13th international conference on World Wide Web. ACM, New York, pp 491-501
17. Adar E, Adamic L (2005) Tracking information epidemics in blogspace. In: Web intelligence, 2005. Proceedings. The 2005 IEEE/WIC/ACM international conference on. IEEE Press, New York, pp 207-214
18. Rogers E (1962) Diffusion of innovations. Free Press, New York
19. Lehmann J, Gonçalves B, Ramasco JJ, Cattuto C (2012) Dynamical classes of collective attention in Twitter. In: Proceedings of the 21st international conference on World Wide Web. ACM, New York, pp 251-260
20. González-Bailón S, Borge-Holthoefer J, Rivero A, Moreno Y (2011) The dynamics of protest recruitment through an online network. Sci Rep 1:197
21. Borge-Holthoefer J, Rivero A, Moreno Y (2012) Locating privileged spreaders on an online social network. Phys Rev E 85:066123
22. González-Bailón S, Borge-Holthoefer J, Moreno Y (2013) Broadcasters and hidden influentials in online protest diffusion. Am Behav Sci (in press). doi:10.1177/0002764213479371
23. Adbusters (2011) https://www.adbusters.org/blogs/adbusters-blog/occupywallstreet.html
24. Gerbaudo P (2012) Tweets and the streets: social media and contemporary activism. Pluto Books, London 25. Honey C, Herring SC (2009) Beyond microblogging: conversation and collaboration via Twitter. In: System sciences,
2009. HICSS’09. 42nd Hawaii international conference on, IEEE Press, New York, pp 1-10 26. Mungiu-Pippidi A, Munteanu I (2009) Moldova’s ‘Twitter revolution’. J Democr 20(3):136-142
27. Cha M, Haddadi H, Benevenuto F, Gummadi K (2010) Measuring user influence in twitter: the million follower fallacy. In: 4th international AAAI conference on weblogs and social media (ICWSM)
28. Garlaschelli D, Loffredo MI (2004) Patterns of link reciprocity in directed networks. Phys Rev Lett 93(26):268701 29. Kossinets G, Kleinberg J, Watts D (2008) The structure of information pathways in a social communication network.
In: Proceeding of the 14th ACM SIGKDD international conference on knowledge discovery and data mining. ACM, New York, pp 435-443
30. Newman M (2003) Mixing patterns in networks. Phys Rev E 67(2):26126
31. Conover M, Ratkiewicz J, Francisco M, Gonçalves B, Flammini A, Menczer F (2011) Political polarization on Twitter. In: Proc. 5th intl. conference on weblogs and social media
32. Conover M, Gonçalves B, Flammini A, Menczer F (2012) Partisan asymmetries in online political activity. EPJ Data Sci 1:6
33. Newman MEJ, Girvan M (2004) Finding and evaluating community structure in networks. Phys Rev E 69:026113 34. Fortunato S (2010) Community detection in graphs. Phys Rep 486(3-5):75-174
35. Pons P, Latapy M (2005) Computing communities in large networks using random walks. In: Computer and information sciences. Lecture notes in computer science, vol 3733, p 284
36. Blondel V, Guillaume J, Lambiotte R, Lefebvre E (2008) Fast unfolding of communities in large networks. J Stat Mech Theory Exp 2008:P10008
37. Rosvall M, Bergstrom C (2008) Maps of random walks on complex networks reveal community structure. Proc Natl Acad Sci USA 105(4):1118
38. Arenas A, Borge-Holthoefer J, Gomez S, Zamora-Lopez G (2010) Optimal map of the modular structure of complex networks. New J Phys 12:053009
39. Grabowicz PA, Ramasco JJ, Moro E, Pujol JM, Eguiluz VM (2012) Social features of online networks: the strength of intermediary ties in online social media. PLoS ONE 7:e29358
40. Guimerà R, Amaral LAN (2005) Functional cartography of complex metabolic networks. Nature 433:895-900 41. Kitsak M, Gallos L, Havlin S, Liljeros F, Muchnik L, Stanley H, Makse H (2010) Identification of influential spreaders in
complex networks. Nat Phys 6:888-893
42. Borge-Holthoefer J, Meloni S, Gonçalves B, Moreno Y (2012) Emergence of influential spreaders in modified rumor models. J Stat Phys 148(6):1-11
43. Watts D, Dodds P (2007) Influentials, networks, and public opinion formation. J Consum Res 34:441
45. Arenas A, Díaz-Guilera A, Pérez-Vicente C (2006) Synchronization reveals topological scales in complex networks. Phys Rev Lett 96(11):114102
46. Danon L, Arenas A, Díaz-Guilera A (2008) Impact of community structure on information transfer. Phys Rev E 77(3):36103
47. McPherson M, Smith-Lovin L, Cook JM (2001) Birds of a feather: homophily in social networks. Annu Rev Sociol 27:415-444
48. Centola D, Gonzalez-Avella JC, Eguiluz VM, San Miguel M (2007) Homophily, cultural drift, and the co-evolution of cultural groups. J Confl Resolut 51(6):905-929
doi:10.1140/epjds18