ISSN: 2149-214X
www.jeseh.net
A Study of Developing an Environmental
Attitude Scale for Primary School
Students
Eyup Artvinli, Zulfiye Melis Demir Eskişehir Osmangazi University
To cite this article:
Artvinli, E. & Demir, Z.M. (2018). A study of developing an environmental attitude scale
for primary school students.
Journal of Education in Science, Environment and Health
(JESEH), 4(1), 32-45.
DOI:10.21891/jeseh.387478
This article may be used for research, teaching, and private study purposes.
Any substantial or systematic reproduction, redistribution, reselling, loan, sub-licensing,
systematic supply, or distribution in any form to anyone is expressly forbidden.
Authors alone are responsible for the contents of their articles. The journal owns the
copyright of the articles.
A Study of Developing an Environmental Attitude Scale for Primary
School Students
Eyup Artvinli, Zulfiye Melis Demir
Article Info
Abstract
Article History
Received: 01 June 2017
The aim of this research is to develop an instrument that measures environmental attitudes of third grade students. The study was completed in six stages: creating scale items, content validity study, item total and remaining item correlation study, determining item discrimination, determining construct validity study and examining the internal consistency reliability of Cronbach’s Alpha. In this research, quantitative research methods and techniques were used. According to the data obtained from exploratory factor analysis, scale came under three sub-factors as “Positive Environmental Behaviors”, “Environmental Knowledge and Awareness” and “Negative Environmental Behaviors”. As a result of the confirmatory factor analysis, it is determined that chi square/df, RMSEA value and the other statistical significance levels are consistent with the collected data. Cronbach’s Alpha coefficient was taken between 0.71-0.94 for sub-scales and 0.93 for the total scale. In the light of these data, it is concluded that the environmental attitude scale has the validity and reliability.
Accepted: 04 December 2017
Keywords
Exploratory and confirmatory factor analysis
Validity Reliability Attitude Environment Elementary school
Introduction
Environment was basically defined as all of the natural and artificial elements that condition the human life (Keleş and Hamamcı, 2005). It is possible to say that environmental problems are one of the most important problems of today. In order for the current problems to be minimized and the future generations to live in a healthy place, the role of the educators is huge. Because, as gradually accumulating, wrong behaviors can lead to bigger problems. For that reason, it is crucial to raise environment conscious individuals, for not doing any mistakes at early ages, even if they seem minor and unimportant. For the first time in the world history, humankind seems to become a part of this process as a separate problem other than those originating from the world itself (Demir, 2016).
It is a fact that the education activities are important in the approaches on permanent solutions on environmental problems. Because, the easiest, cheapest and firmest way to develop such approaches, is to educate our children starting from early ages. Accordingly, raising individuals conscious and aware of environment comes out as the most effective way to solve those problems (Benli, Ay and Kahramanoğlu, 2011). It is clear that individuals with negative attitudes towards the environment will be inconsiderate towards environmental problems and will continue to pose problems to the environment (Uzun and Sağlam, 2006). Environmental condition in long-term, is related with the future generations to take care of the environment. In a report published by the Childhood Alliance, it is indicated that the childhood is a critical period in acquiring anxiety, interest, awareness, tendency, dignification and knowledge acquisition related to natural world. For this reason, it is crucial to start studies concerning the environment at early ages (Yaşaroğlu, 2012). Students who cannot develop positive attitudes regarding the environment at early ages may face the risk of not being able to develop positive attitudes for the rest of their lives. Provided that the student develops negative attitude at early ages, these negativities become permanent and lay the foundations of unwanted behaviors in the future. Positive attitude acquired at early ages, forms the basis of the following years (Chapman&Sharma, 2001; Erten, 2004; Gökçe, Kaya, Aktay and Özden, 2007).
environment-oriented positive attitudes, the attitudes gained at earlier ages are important. It is emphasized in researches that the attitudes acquired at early ages will continue to be in the future (Chapman&Sharma, 2001; Erten, 2004; Gökçe and et al. 2007). Thus, it is important to develop such scale in order to emphasize the environmental education of children at early ages and measure to what extent they develop environmental consciousness, which is not included in the literature.
Sustainable development which is one of the learning sub-fields of Science-Technology-Society-Environment of Science lesson contains “enabling future generations to meet their needs by using natural resources economically, developing conscious on individual, society and economic benefits of an economical usage.” (MEB, 2013). In order for sustainable development conscious to be improved, students have to hold the environmental attitude. It will be possible to reach a measuring instrument which shows to what extent this program succeeded in instilling the objectives of the program in the students. It also will help determine the environmental attitudes of the students who have not attended Science class since the class is introduced at the 3rd grade. There is a need for a scale that includes the dimensions of cognition, perception and behavior in regard to the importance of environmental attitude to be acquired at early ages. Individuals, who are conscious of environmental attitude, have to have the environmental knowledge, recognize the environmental problems, be sensitive to these problems and act accordingly.
Method
Study Group
Since this study is a scale development study, population and sample method had not been chosen. Study group was determined by easily accessible sampling method. The study group of the research consists of 416 third grade students studying in four elementary schools in 2014-2015 academic year in central district of Eskişehir. Demographic information of 416 voluntary participants of the study can be seen on Table 1.
Table 1. Distributions according to the demographic attributes of the study group
Variables N Mean
Gender
F 198 47.6
M
Unspecified 209 9
50.2 2.2
Total 416 100
In the sampling group, there are 198 male and 209 female students. 9 students did not mark the gender selection. Since 66 students did not fully complete the scale form, they were not included in the study group and thus, the study group regarded as 416 students. In this study, three point Likert scale was chosen since the study is conducted among the 3rd grades. Draft scale was prepared as three point Likert as Agree (3), Partially Agree (2), Disagree (1).
Creating the Scale Items
In order to develop data collection tool, Education Program of Science and 3rd grade Science Lesson books were examined. In accordance with “Sustainable Development” - one of the sub-learning fields of Science-Technology-Society-Environment, which includes the acquirements that take place in the educational program as “Knows the environment and takes active roles in cleaning these places. Understands the importance of
natural habitat on living creatures and takes precautions in order to save the natural habitat. Understands the importance of economical usage of the resources such as electric and water and acts accordingly. Understands the importance of the required situations for a healthy life and performs in daily life. Discusses the harms of waste batteries to the environment and actions to be taken about them.” and enables future generations to meet their needs by using natural resources economically, develops conscious on individual, society and economic benefits of an economical usage, a 65-item scale pool was created.
Content Validity Study
opinions were taken into consideration when determining the scale items whether they are enough by means of number and quality or not. Scale items were rearranged according to expert’s suggestions. Draft scaling form consisting of 65 items was asked for three different experts’ opinions. The experts consisted of Associate Professor of the department of School Teaching who had studies on science and environmental education, Associate Professor of the department of School Teaching who is a geography teacher and had environmental education studies and Assessment and Evaluation Expert (Associate Professor). Expert evaluation form was created and all the experts asked to evaluate the items on the draft form. Evaluations made as “has to be removed, revised or acceptable). Evaluations of three experts were examined and 5 items decided to be left out considering that they will not help scaling the environmental attitude.
The Study of Face Validity
“Face validity is defined as scaling the feature aimed to be scaled, the name of the measuring instrument, its instructions, organization and items and the questions reflecting this.” (Büyüköztürk, 2004; p.117). In that study, two expert opinions were taken for face validity of the draft measuring instrument. Following the content and face validity, pilot testing was carried out with twenty students which did not take part in the sample group of the draft form. The unknown words by these students were determined. The synonyms were used or changes made on draft scaling form by writing the definitions in brackets. Validity and reliability analyses were performed on 416 primary third grade students. Draft scale was prepared as three-point Likert scale as Agree (3), Partially Agree (2), Disagree (1). For the item discrimination of scale items and for the determination of remaining item coefficient, Pearson’s product moment correlation analysis was carried out and for the comparison of %27 subgroup and super group item points, independent samples t test was performed. In order to determine the construct validity, exploratory and then confirmatory factor analysis were carried out. For
internal consistency, Cronbach’s alpha coefficient was calculated.
Validity and reliability calculations of the scale were conducted considering the SPSS and LISREL 8 programs.
Data Analysis
In research, before dealing with the data analysis collected by the data collection tool, measuring instruments were numerated from 1 to 416. After the numbering process, data were transferred to computer environment in accordance with the given numbers. Following the transfer, environmental attitude scale and validity and reliability of the sub dimensions were calculated in the SPSS 21 Windows package software. Besides, descriptive analysis of the scale such as percentage, arithmetic mean and standard deviation, were carried out. The significance level for statistical analyses on this research was determined as 0,01.
Findings
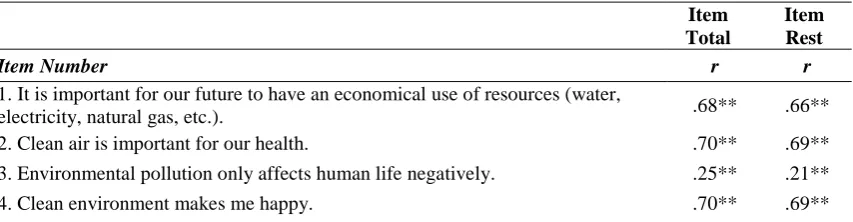
In order to determine the item scales by means of features to see how effective they are to discriminate the people, item total and item rest correlations on the collected data obtained from 416 students, were calculated. The obtained correlation coefficient is the validity coefficient of that item and it indicates its consistency with the overall test. The correlation coefficients obtained from the item total correlations changes from 0.12 to 0.73, whereas the correlation coefficients taken from the item rest correlations changes from 0.06 to 0.73. As a result of item total correlation, item 8 “If there is a recycling box, I throw my garbage on it.” had been removed from the scale items since it had not regarded as statistically significant. As concluded from the item rest correlation, item 15 “Pollution of the sea only affects the animals living in the sea.” And item 46 “I should not take part in cleaning the class.” had been removed from the scale items since it had not regarded as statistically significant.
Table 2. Item total and item rest correlation coefficients of the item scale Item Total
Item Rest
Item Number r r
1. It is important for our future to have an economical use of resources (water,
electricity, natural gas, etc.). .68** .66**
2. Clean air is important for our health. .70** .69**
3. Environmental pollution only affects human life negatively. .25** .21**
5. Trees and flowers need clean water. .64** .63** 6. Damage to forests affects the natural life negatively. .30** .26** 7. Environmental pollution is dangerous to all living creatures. .56** .54**
8. If there is a recycling box, I throw my garbage on it. .12 .06
9. I discuss current environmental problems with my family. .50** .47**
10. Recycling contributes to the national economy. .52** .49**
11. All living creatures need a clean world. .67** .65**
12. Protecting the nature is important for endangered animals. .45** .42** 13. I separate trashes at home for throwing them on recycling boxes. .48** .45**
14. I feed street animals. .50** .47**
15. Pollution of the sea only affects the animals living in the sea. .15* .09 16. Random disposal of used batteries damages the environment. .51** .48**
17. I know the plants in my environment. .36** .32**
18. I love animals. .66** .65**
19. We may have trouble finding clean drinking water in the future. .36** .32**
20. Recycling is important. .65** .64**
21. We do less harm to environment when we use public transport instead of cars. .26** .20**
22. I know the things that can be recycled. .44** .42**
23. I know where the recycling boxes are for used batteries. .50** .47**
24. I do not throw garbage on street. .66** .64**
25. It is not my responsibility to protect the environment. .41** .38** 26. The garbage thrown away at school attracts my notice. .50** .48** 27. I don’t be upset about the pollution in my environment. .46** .43**
28. I use water economically. .44** .42**
29. Trees and flowers need clean soil. .73** .72**
30. I do my part regarding the cleanliness of our class. .63** .62**
31. I get upset about fishes living in dirty water. .57** .55**
32. I watch documentaries about living creatures. .43** .40**
33. I would like to participate in environmental cleaning activities. .65** .63**
34. I do not damage trees. 70** .69**
35. We should protect the nature. .72** .71**
36. I take part in environmental activities. .49** .46**
37. I talk about current environmental problems with my friends. .45** .42** 38. Environmental pollution affects the habitats of some living things. .36** .32** 39. Unconscious hunting causes some animals to be extinct. .39** .35**
40. I don’t do harm to animals. .69* .67**
41. I know the animals in the environment I live. .56** .53**
42. I enjoy watching documentaries about living creatures. .40** .37**
43. The lights left open do not attract my attention .23** .18**
44. People throwing litter makes me sad. .64** .62**
45. I would like to plant trees. .66** .65**
46. I should not take part in cleaning the class. .17** .12
47. Damaging forests do not affect the natural life negatively. .28** .23**
48. Animal extinction makes me sad. .59** .57**
49. When I see a flowing faucet, I close it. .63** .62**
51. I do harm to animals. .47** .44**
52. I plant trees. .53** .50**
53. Garbage on street attracts my notice. .62** .60**
54. I would like to work for my environment to be clean. .60** .59**
55. I feel sorry when I see the wasted taps. .59** .57**
56. I throw waste pills on waste battery box. .66** .64**
57. Feeding animals makes me happy. .67** .66**
58. I turn off the lights that are left on. .71** .69**
59. I do not use the water economically. .28** .24**
60. I do not harm the plants. .58** .57**
n=416 *p<.05 **p<.01 Item Discrimination Power
In order to determine the discriminating power of the items on the scale, item analysis was made. For every item, obtained points were sorted as biggest to smallest and independent group t test was performed for %27 top and bottom parts. In Table 3, independent group t test results which had been carried out so as to determine the item discriminating powers are given below.
Table 3. Results of the independent group T test results determining the item discrimination powers
Item No t
1. It is important for our future to have an economical use of resources (water, electricity, natural gas, etc.).
4.806*
2. Clean air is important for our health. 5.070*
3. Environmental pollution only affects human life negatively. 17.356*
4. Clean environment makes me happy. 4.967*
5. Trees and flowers need clean water. 5.114*
6. Damage to forests affects the natural life negatively. 17.525* 7. Environmental pollution is dangerous to all living creatures. 7.016* 9. I talk about current environmental problems with my family. 16.182*
10. Recycling contributes to the national economy. 7.683*
11. All living creatures need a clean world. 5.689*
12. Protecting the nature is important for endangered animals. 1.459 13. I separate trashes at home for throwing them in recycling bins. 16.654*
14. I feed street animals. 11.175*
16. Random disposal of used batteries damages the environment. 7.975*
17. I know the plants in my environment. 15.989*
18. I love animals. 7.067*
19. We may have trouble finding clean drinking water in the future. 16.776*
20. Recycling is important. 4.410*
21. We do less harm to environment when we use public transport instead of cars. 24.269* 22. I know the things that can be recycled in my environment. 11.535* 23. I know where the recycling boxes are for used batteries. 16.029*
24. I do not throw garbage on street. 6.342*
25. It is not my responsibility to protect the environment. 9.376*
26. The garbage thrown away at school attracts my notice. 8.210*
27. I don’t be upset about the pollution in my environment. 6.742*
29. Trees and flowers need clean soil. 5.145*
30. I do my part regarding the cleanliness of our class. 6.459*
31. I get upset about fishes living in dirty water. 7.046*
32. I watch documentaries about living creatures. 15.986*
33. I would like to participate in environmental cleaning activities. 10.621*
34. I do not damage trees. 4.980*
35. We should protect the nature. 4.737*
36. I take part in environmental activities. 16.165*
37. I talk about current environmental problems with my friends. 16.437* 38. Environmental pollution affects the habitats of some living things. 9.586* 39. Unconscious hunting causes some animals to be extinct. 10.278*
40. I don’t do harm to animals. 4.600*
41. I know the animals in the environment I live. 15.989*
42. I enjoy watching documentaries about living creatures. 16.062*
43. The lights left open do not attract my attention 13.382*
44. People throwing litter makes me sad. 7.842*
45. I would like to plant trees. 6.517*
47. Damaging forests do not affect the natural life negatively. 19.811*
48. Animal extinction makes me sad. 7.846*
49. When I see a flowing faucet, I close it. 6.183*
50. I would like to grow plants. 6.991*
51. I do harm to animals. 5.529*
52. I plant trees. 10.894*
53. Garbage on street attracts my notice. 8.000*
54. I would like to work for my environment to be clean. 8.112*
55. I feel sorry when I see the wasted taps. 7.704*
56. I throw waste pills on waste battery box. 6.279*
57. Feeding animals makes me happy. 6.630*
58. I turn off the lights that are left on. 5.345*
59. I do not use the water economically. 10.914*
60. I do not harm the plants. 4.778*
n= 230, SD= 124 , *p<.01
According to the values on Table 3, item 12 “Protecting the nature is important for endangered animals.” had been removed since the item is not p<.01 and do not have statistical significance.
Construct Validity
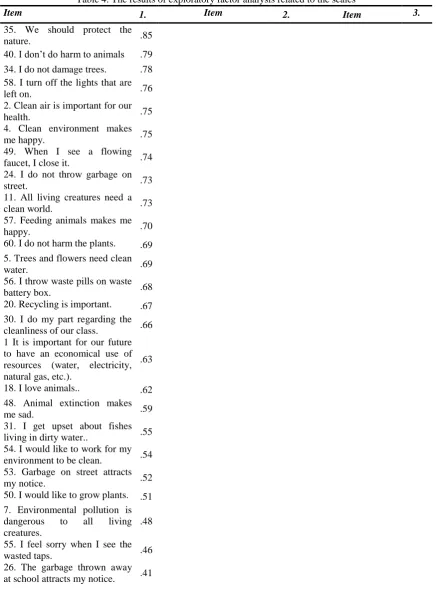
Technique is preferred since the scale has a multifactor structure and it is aimed at the generalizability of the data obtained (Acat, Tüken&Karadağ, 2010). According to Büyüköztürk (2004), if the item-total correlation is positive and high; it indicates that the items on the scale exemplify similar behaviors and that the internal consistency of the test is high. Generally, item-total correlations valued .30 and higher contribute to the measurement of the overall measure of the scale. If one variable is below the factor load of 0.30; it is considered as low level and these items have to be removed from the scale (Kline, 1994). As a result of the factor analysis carried out, items with inappropriate factor loadings were removed from the scale (factor load <0.30). In Table 4, three sub-factors and item loadings that came out as a result of the exploratory factor analysis are given.
Table 4. The results of exploratory factor analysis related to the scales
Item 1. Item 2. Item 3.
35. We should protect the
nature. .85
40. I don’t do harm to animals .79 34. I do not damage trees. .78 58. I turn off the lights that are
left on. .76
2. Clean air is important for our
health. .75
4. Clean environment makes
me happy. .75
49. When I see a flowing faucet, I close it. .74 24. I do not throw garbage on
street. .73
11. All living creatures need a
clean world. .73
57. Feeding animals makes me
happy. .70
60. I do not harm the plants. .69 5. Trees and flowers need clean
water. .69
56. I throw waste pills on waste
battery box. .68
20. Recycling is important. .67 30. I do my part regarding the cleanliness of our class. .66 1 It is important for our future to have an economical use of resources (water, electricity, natural gas, etc.).
.63
18. I love animals.. .62 48. Animal extinction makes
me sad. .59
31. I get upset about fishes living in dirty water.. .55 54. I would like to work for my environment to be clean. .54 53. Garbage on street attracts
my notice. .52
50. I would like to grow plants. .51 7. Environmental pollution is dangerous to all living creatures.
.48 55. I feel sorry when I see the
wasted taps. .46
28. I use water economically. .38 38. Environmental pollution affects the habitats of some living things.
.32 5
37. I talk about current environmental problems with my friends.
.65 17. I know the plants in
my environment. .62
32. I watch documentaries about living creatures. .56 23. I know where the recycling boxes are for used batteries.
.54 41. I know the animals in the environment I live. .48 21. We do less harm to environment when we use public transport instead of cars.
.48
14. I feed street animals. .47 19. We may have trouble finding clean drinking water in the future.
.46 22. I know the things that can be recycled in my environment.
.44 16. Random disposal of used batteries damages the environment.
.40
47. Damaging forests do not affect the natural life negatively.
.68 59. I do not use the
water economically. .66 43. The lights left open do not attract my attention.
.65 27. I don’t be upset about the pollution in my environment.
.61 25. It is not my responsibility to
protect the
environment.
.54
51. I do harm to
animals. .48
Table 5. Eigenvalues and variances explained by the scale factors
Subscales Eigenvalues Variance
1. Positive Environmental Behaviors 14.70 34.19 2. Environmental Information and Awareness 2.53 5.47
3. Negative Environmental Behaviors 2.11 4.90
Total 19.34 44.56
Bogner and Wiseman (2006) and Costello and Osborne (2005) propose a confirmatory factor analysis to test the correctness of the model which resulted from the exploratory factor analysis. Table 9 shows the results of confirmatory factor analysis.
Table 6. Compliance parameters related to the confirmatory factor analysis model of the scale
Conformity Parameter Index
GFI (Goodness of Fit Index) 0.65
AGFI (Adjusted Goodness of Fit Index) 0.62
RMSEA (Root Mean Square Error of Approximation) 0.089
Df 857
x² 2120.64
(Chi-square) x²/df 2,47
In Figure 1, the standard value diagram of the proposed model is presented:
The results of confirmatory factor analysis and exploratory factor analysis were verified. x²/df value was found significant. If x²/df ratio is below 3, it is the perfect fit, whereas below 5 is satisfactory. In this case, x²/df ratioof the scale is a perfect fit ( imşek, 2007).
RMSEA is acceptable between .05 and .08 and it is regarded as perfect fit when the value is between .00 and 0.50 (Brown and Cudeck, 1993). According to these values, RMSEA value was considered acceptable. Pearson’s product-moment correlation analysis was used. Correlations between subscale points of the scale are changed between 0.26 and 0.59 and statically significant. Table 7 shows the correlations between all subscales.
Table 7.Correlation coefficients between the subscales
Subscales 1 2 3
1. Positive Environmental Behaviors - 0.59** 0.35** 2. Environmental Information and
Awareness
- 0.26**
3. Negative Environmental Behaviors -
** p<.01
Findings Related to the Reliability of the Scale For the reliability, Cronbach’s Alpha coefficient was calculated. In Table 8, subfactors of scale and Cronbach’s Alpha coefficient values of all are given.
Table 8. Cronbach’s alpha coefficients of scale subscales
Subscales Alpha
Positive Environmental Behaviors 0.94 Environmental Information and
Awareness 0.75
Negative Environmental Behaviors 0.71
Total 0.93
Cronbach’s Alpha coefficient was determined between 0.71-0.94, and 0.03 for all of the scale. These values indicate that the scale can measure consistently. According to Büyüköztürk (2004) reliability coefficients over 0.70 and above is acceptable, whereas encan (2005) stated that although this value is acceptable in scientific studies, interest and talent type of researches requires scales to have at least 0.85 reliability coefficient.
Discussion and Suggestions
attitudes, and the relationship between useful behaviors towards the environment and intentions, emotions, information and internal-external control focus. Kuhlemeier, Bergh and Lagerweij (1999) examined the relationship between environmental knowledge, environmental attitude and behavior in their studies. Uzun and Sağlam (2006) dealt with the “behavior” and “thought” of attitude’s three dimensions, and left “emotion” dimension to their next study. Beklan Çetin (2002) examined environmental information, environmental attitudes and environmental behaviors. It was found that environmental knowledge has a significant influence on environmental attitudes.
In scale development studies, performing analysis as exploratory factor analysis with induction, confirmatory factor analysis with deductive contributes to the theoretical foundation to be steady (Okur and Yalçın-Özdilek, 2012). In this respect, besides the exploratory factor analysis in scale development studies, using other factor analyses in literature will contribute to studies to build on strong foundations. The environmental attitude scale developed for primary school students, was prepared to include cognition, perception and behavior dimensions of environmental attitudes of the third grade students. Moreover, while developing the scale, exploratory and confirmatory factor analyses were used. For that reason, scale development study is important.
Teachers can use the scale in their classrooms in order to determine the environmental attitudes of the students. With this developed scale, survey studies can be carried out in province, region or throughout Turkey. In surveys, joint studies can be carried out with the help of the academicians and form teachers in order to raise individuals who have positive attitude for environment, in schools and classes that the scale gives low results. The scale can be used by the teachers implementing educational programs and also by program developing experts in an attempt to determine the situation and the needs. Being individuals having positive attitudes towards the environment is a prior condition required for health of today’s world and its continuity. It is significant to acquire this attitude at early ages. Changing the acquired wrong attitudes is harder than acquiring new attitudes. It is important to spend less energy and resources, and try to acquire environmental attitude at early ages so that nature gets least harm.
Note
This article was produced from a postgraduate thesis entitled "A Study of Developing an Environmental Attitude Scale for Primary School Students”.
References
Acat, M. B., Tüken, G., &Karadağ, E. (2010). The scale of scientific epistemological beliefs Adapting for Turkish culture, language validity & examination of factor structure. Journal of Turkish Science Education, 7(4), 67-94.
Alp, E., Ertepınar, H., Tekkaya, C. & Yılmaz. A. (2006). A study on Environment-Oriented Attitude and Knowledge of Primary School Students, VII. National Congress on Education in Science and Mathematics, Gazi University, 07-09th September 2006, Abstracts Book. pg 110.
Altınöz, N. (2010). Literacy Levels of Teacher Candidates of Science (unpublished post-graduate thesis). Sakarya University, Sakarya.
Atasoy, E. (2005). Education for Environment:A Study on Environmental Attitude and Knowledge of Primary School Students (unpublished doctoral thesis). Uludağ University, Bursa.
Atasoy, Ü. Ö. (2012). Acqusition level of STSE related to the topics of Primary School curriculum and researching the attitudes of the students towards these topics. (unpublished post-graduate thesis). Gazi University, Ankara.
Atasoy, E. & Ertürk, H.(2008). A Field Study on The Environmental Attitude and Knowledge of Primary School Students.Erzincan Faculty of Education Periodical, 10(1), 105-122.
Baloğlu, N., Karadağ, E. & Karaman, H. (2008). Strategical Planning Attitude Scale Study of Exploratory and Confirmatory Factor Analyses. Educational Sciences on Theory and Practice8 (2), 407-437
Beklan Çetin, O. (2002). nvironmental knowledge attitude and behavior in ski ehir. (unpublished doctoral thesis). Middle East Technical University, Ankara.
Bogner, F. X. &Wiseman, M. (2006). Adolescent’ attitudes towards nature and environment quantifying the 2-MEV model. TheEnvironmentalist, 26, 247-254.
Brown, M.,&Cudeck, R. (1993). EQS structural equations program manual. Multivariate Software Inc., Los Angeles.
Büyüköztürk, . (2004). Data analysis handbook for social sciences. Statistics, research design, SPSS
applications and comments. Ankara: Pegem Academy.
Chapman, D. &Sharma, K. (2001). Environmental attitudes and behavior of primary and secondary students in asiancities: an overwiev strategy for implementing an eco-schools programme, TheEnvironmentalist, 21, 265-272. doi: 10.1023/A:1012996016601
Costello, A. B.&Osborne, J. W. (2005). Best practices in exploratory factor analysis: four recommendations forgetting the most from your analysis. Practical Assessment Research& Evaluation, 10 (7), 1-9. Demir, Z. M. (2016). Environmental attitude scale developing study for primary school students. (unpublished
post-graduate thesis). Eskişehir Osmangazi University, Eskişehir.
Erdoğan, M. & Ok, A. (2008). Environmental literacy assessment of Turkish children: the effects of background
variables. The WCCI 13th World Conference in Education, September 02-06, Antalya, Turkey.
Ergezin, Ö. U. & Çetin Teke, E. (2013). A study on developing an environmental behavior and attitude scale for university students. Journal of Educational and Instructional Studies in the World. 3(2), 49-56.
Erten, S. (2004). What is environmental education and consciousness, How should environmental education be?
Environment and People Journal, Ministry of Environment and Forestry Media Organ, Number 65/66.
Gökçe, N., Kaya, E., Aktay, S. & Özden, M. (2007). Attitudes of Primary School Students towards Environment. Primary Education Newswire, 6(3), 452-468.
Karataş, A. (2013). The role of environmental education concerning the environmental consciousness and Niğde University Faculty of Education. (unpublished doctoral thesis). Ankara University, Ankara.
Kele . amamc . . nvironmental olic th rint . nkara mge ookstore.
Kline, P. (1994). An easy guide to factor analysis. New York, NY: Routledge.
Kuhlemeier, H.,Bergh, H. &Lagerweij, N. (1999). Environmental knowledge, attitudes and behavior in Dutch secondary education, Journal of Environmental Education, 30 (2). 4-14.
MEB (Ministry of National Education) (2013). Primary Education Institutions (primary and middle schools) science lesson (3, 4, 5, 6, 7, 8th grades) education programs. Ankara: MEB Publications
Okur, E. & Yalçın-Özdilek, . (2012). Environmental attitude scale developed with Structural Equation Modelling. Primary Education Online, 11(1), 85-94.
imşek, Ö. F. (2007). Introduction to structural equation modeling. (basic principles and LIS EL applications). Ankara: Ekinoks.
Uzun, N.,&Sağlam, N. (2006). Developing environmental attitude scale for middle school studens and the validity. Hacettepe University Faculty of Education Periodical ,30, 240-250.
Yaşaroğlu, C. (2012). Environmental attitude and behavior assessment of primary school students.(unpublished doctoral thesis). İnönü University, Malatya.
Author Information
Eyup Artvinli
Eskişehir Osmangazi University Eskişehir/Turkey
Zulfiye Melis Demir
Eskişehir Osmangazi University Eskişehir/Turkey
Appendix
Environmental Attitude Scale
Note: The original scale has been developed in Turkish. It is necessary to ensure the language validity for using in different languages.
A. Positive Environmental Behaviors Agree Partially Agree Disagree
We should protect the nature. I don’t do harm to animals. I do not damage trees.
I turn off the lights that are left on. Clean air is important for our health. Clean environment makes me happy. When I see a flowing faucet, I close it. I do not throw garbage on street. All living creatures need a clean world. Feeding animals makes me happy. I do not harm the plants.
Trees and flowers need clean water. I throw waste pills on waste battery box. Recycling is important.
I do my part regarding the cleanliness of our class. It is important for our future to have an economical use of resources (water, electricity, natural gas, etc.). I love animals.
Animal extinction makes me sad.
I get upset about fishes living in dirty water.
I would like to work for my environment to be clean. Garbage on street attracts my notice.
I would like to grow plants.
Environmental pollution is dangerous to all living creatures.
I feel sorry when I see the wasted taps.
The garbage thrown away at school attracts my notice. I use water economically.
Environmental pollution affects the habitats of some living things.
B. Environmental Knowledge and Awareness Agree Partially Agree Disagree
I talk about current environmental problems with my friends.
I know the plants in my environment. I watch documentaries about living creatures.
I know where the recycling boxes are for used batteries.
I know the animals in the environment I live.
I feed street animals.
We may have trouble finding clean drinking water in the future.
I know the things that can be recycled in my environment.
Random disposal of used batteries damages the environment.
C. Negative Environmental Behaviors Agree Partially Agree Disagree Damaging forests do not affect the natural life
negatively.
I do not use the water economically.
The lights left open do not attract my attention
I don’t be upset about the pollution in my environment.