Volume 21 Number 2 pp. 84–88 C The Author(s) 2018. This is an Open Access article, distributed under the terms of
the Creative Commons Attribution licence (http://creativecommons.org/licenses/by/4.0/), which permits unrestricted re-use, distribution, and reproduction in any medium, provided the original work is properly cited. doi:10.1017/thg.2018.12
Comment on ‘Large-Scale Cognitive GWAS
Meta-Analysis Reveals Tissue-Specific Neural
Expression and Potential Nootropic Drug Targets’
by Lam et al.
W. David Hill1,2
1Centre for Cognitive Ageing and Cognitive Epidemiology, University of Edinburgh, Edinburgh, UK 2Department of Psychology, University of Edinburgh, Edinburgh, UK
Intelligence and educational attainment are strongly genetically correlated. This relationship can be ex-ploited by Multi-Trait Analysis of GWAS (MTAG) to add power to Genome-wide Association Studies (GWAS) of intelligence. MTAG allows the user to meta-analyze GWASs of different phenotypes, based on their ge-netic correlations, to identify association’s specific to the trait of choice. An MTAG analysis using GWAS data sets on intelligence and education was conducted by Lam et al. (2017). Lam et al. (2017) reported 70 loci that they described as ‘trait specific’ to intelligence. This article examines whether the analysis con-ducted by Lam et al. (2017) has resulted in genetic information about a phenotype that is more similar to education than intelligence.
Keywords:GWAS, general cognitive ability, nootropics, gene expression, neurodevelopment, synapse, calcium channel, potassium channel, cerebellum
Intelligence, often simply referred to as g (Spearman, 1904), general cognitive ability or general cognitive func-tion (Davies et al., 2015), describes the variance that is shared between different tests of cognitive function. This shared variance explains approximately 40% of the varia-tion between individuals’ scores on tests of cognitive func-tion (Carroll,1993). Intelligence predicts both educational and occupational success (Strenze,2007), whereby individ-uals with a higher level of intelligence tend to stay in school longer, and attain higher qualifications, than those with a lower relative level of intelligence. Intelligence is also pre-dictive of physical and mental health, as well as of longevity, with a higher level of intelligence being associated with a lower risk of illness, and a greater lifespan (Calvin et al., 2017; Deary et al.,2010). This link between intelligence with physical and mental health is partially explained by genetic variants that act across traits (Bulik-Sullivan et al.,2015; Hill et al.,2015).
The heritability of intelligence is around 50% when con-sidering variants from across the full spectrum of the allelic frequency (Hill et al.,2018), and around 20% when includ-ing only common variants tagged by genotyped sinclud-ingle nu-cleotide polymorphisms (SNPs; Marioni et al.,2014). Con-sistent with other quantitative phenotypes such a height
(Wood et al., 2014), and schizophrenia (Schizophrenia Working Group of the Psychiatric Genomics Consortium, 2014), the discrepancy between the heritability estimate and the variance explained by SNPs that attain genome-wide significance, is indicative of a phenotype where each variant captures only a negligible portion of a sizable genetic influence. In order to reliably detect such small individual effects, large sample sizes are required.
Such sample sizes are typically attained by meta-analyzing multiple Genome-wide Association Studies (GWAS) on intelligence (Davies et al.,2015,2017). How-ever, a recently published method, Multi-Trait Analysis of GWAS (MTAG) (Turley et al., 2018), enables a meta-analysis to be conducted on genetically correlated traits; crucially, and unlike similar methods that test against a null hypothesis that each SNP is associated with none of the traits (Bolormaa et al.,2014; Zhu et al.,2015), MTAG
received 18 January 2018; accepted 14 February 2018
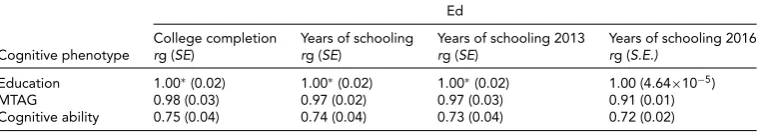
TABLE 1
Genetic Correlations Between the Three Cognitive Phenotypes Used in the Analysis of Lam et al. (2017), Years of Education from Okbay et al. (2016) Labelled ‘Education’, ‘Cognitive Ability’ Grom a Meta-Analysis of Sniekers et al. (2017) and Trampush et al. (2017), and the Deemed ‘Intelligence-MTAG’ Meta-Analysis of Lam et al. (2017), with Four Education Phenotypes
Ed
College completion Years of schooling Years of schooling 2013 Years of schooling 2016 Cognitive phenotype rg (SE) rg (SE) rg (SE) rg (S.E.)
Education 1.00∗(0.02) 1.00∗(0.02) 1.00∗(0.02) 1.00 (4.64×10⁻⁵)
MTAG 0.98 (0.03) 0.97 (0.02) 0.97 (0.03) 0.91 (0.01) Cognitive ability 0.75 (0.04) 0.74 (0.04) 0.73 (0.04) 0.72 (0.02)
Note: These figures are taken from Supplementary Table 14 of Lam et al. (2017). As can be seen, following the application of MTAG, the genetic correlation between Cognitive ability and Education approaches unity (middle row of Table 1). All genetic correlations greater than 1∗(education from Okbay et al. (2016) with College completionrg=1.11, education
from Okbay et al. (2016) with Years of Schoolingrg=1.08, education from Okbay et al. (2016) with Years of Schooling
2013rg=1.09) were treated as 1 (Walters,2016).
can produce associations specific to one of the traits an-alyzed. This affords the advantage that, should a trait be burdensome to measure, as is the case for intelligence, a proxy phenotype can be used to ensure that a sufficiently large sample size can be generated, improving the chance of detecting individual loci associated with the trait of interest.
Educational attainment, measured as either years spent in education or a binary classification of whether or not a participant attained a college or university-level degree, has been used as a proxy phenotype for intelligence (Rietveld et al.,2014). The ease with which educational attainment can be measured facilitates the collection of large samples. Moreover, education’s strong genetic correlation of ∼0.70 with established tests of intelligence (Bulik-Sullivan et al., 2015) demonstrates that this simple-to-measure trait has a very similar genetic architecture to intelligence and, there-fore, may be used as a proxy phenotype for intelligence (Ri-etveld et al., 2014). Lam et al. (2017) recently reported a large-scale GWAS of intelligence, which they called ‘cogni-tive ability’. Using MTAG (Turley et al.,2018) to combine GWAS data sets on the correlated phenotypes of cognitive ability and education, Lam et al. derived 70 loci that they described as ‘trait-specific’ (page 2609) to cognitive ability. The purpose of this commentary is to examine whether the use of MTAG, in this case (Lam et al.,2017), has resulted in genetic information about a phenotype that is more similar to education than to cognitive ability.
Methods, Results, and Discussion
Lam et al. (2017) correctly state that MTAG (Turley et al., 2018) can generate trait-specific associations from a meta-analysis of different, genetically correlated traits. However, this is not the case when the statistical power for the dif-ferent GWASs of the meta-analyzed traits are highly dis-similar, as seen below. The level of power in a GWAS data set can be gauged by examining the meanχ2 statis-tic. Whereas these statistics are absent from Lam et al.’s
published manuscript, they were presented by Lam et al. and can be viewed at the following URL (https://youtu.be/ e9K1EOQSat4?t=19m29s;beginning at 19 min and 29 s). These are reported as meanχ2 =1.245 for the cognitive ability phenotype (labeled Sniekers+COGENT (Sniekers et al.,2017; Trampush et al.,2017)), and meanχ2=1.638 for the ‘years of education’ phenotype (taken from the pub-lically available data provided by Okbay et al.,2016). These represent very different levels of statistical power, and the authors of the MTAG (Turley et al.,2018) method clearly state that the False Discovery Rate (FDR) can become sub-stantial if MTAG is applied to GWAS that differ a great deal in power. This issue applies to the analysis of Lam et al. (2017). Indeed, this potential problem is the reason that, in the MTAG method manuscript, all the traits presented had a meanχ2statistic that was quite similar.
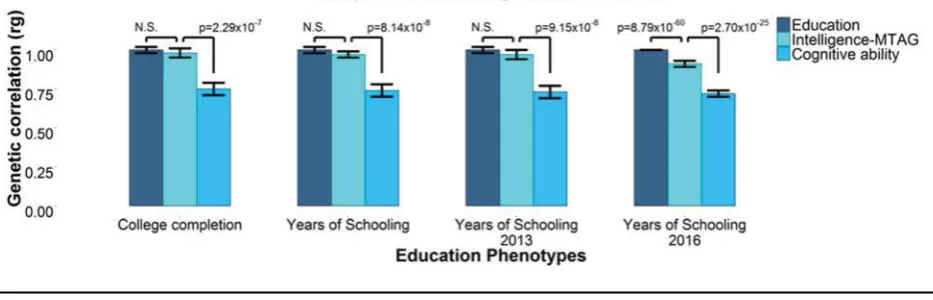
FIGURE 1
(Colour online) Lam et al. (2017) used three phenotypes (‘Education’ (Okbay et al.,2016), ‘Cognitive ability’ from a meta-analysis of Sniekers et al. (2017) and Trampush et al. (2017), and the so-called ‘Intelligence-MTAG’ meta-analysis of Lam et al. (2017)) to derive genetic correlations with four measures of education.
Note: Each of the 12 genetic correlations were plotted to examine whether the Intelligence-MTAG phenotype was more similar to Education than it was to Cognitive ability. The genetic correlations between Cognitive ability and each of the education phenotypes were significantly different from the genetic correlations between the MTAG phenotype and each of the four education phenotypes. However, the genetic correlations between the Intelligence-MTAG phenotype and three of the four education phenotypes were not significantly different from the genetic correlation between Education and each of the four education variables. This indicates that the Intelligence-MTAG phenotype derived by Lam et al. (2017) is more similar to Education than it is to Cognitive ability. N.S. indicates no significant differences between the genetic correlations.Pvalues are for a test examining the difference between two genetic correlations. Error bars indicate±1 standard error as derived in linkage disequilibrium score regression (Bulik-Sullivan et al.,2015). These figures were taken from Supplementary Table 14 of Lam et al. (2017). All genetic correlations greater than 1 were treated as 1 (Walters,2016).
from that of a GWAS data set composed solely of cognitive measures (see Appendix).
The genetic correlations derived using years of educa-tion from Okbay et al. (2016) and the four measures of education examined by Lam et al. (2017) were around unity, as would be expected when comparing data sets mea-suring highly similar phenotypes (Table 1). However, the genetic correlations derived using Lam et al.’s ostensible ‘intelligence-MTAG’ also approached unity with these same four measures of education. There were no significant dif-ferences between three of the four genetic correlations of the supposedly intelligence-MTAG data set with education, and those of the Okbay education data set with education (Figure 1).
This demonstration, carried out using the information in the manuscript of Lam et al. (2017), illustrates that the MTAG meta-analysis conducted by Lam et al. (2017) has not produced associations specific to cognitive ability but, rather, the polygenic signal found within the meta-analytic data set derived using MTAG is more similar to that of ed-ucation.
Further supportive evidence for this conclusion includes the result that the genetic correlation with schizophre-nia switches from negative, rg = -0.19, SE= 0.03,p = 2.85×10⁻¹⁰ consistent with previous findings (Hill et al.,
2015) when examining Sniekers+COGENT (Sniekers et al.,2017; Trampush et al., 2017; i.e., a solely cognitive combination), to near-zero (rg = -0.04,SE = 0.03,p = .11) when including education (which elsewhere has a zero or positive genetic association with schizophrenia (Bulik-Sullivan et al.,2015; Hagenaars et al.,2016; Hill et al.,2015).
Focusing on bipolar disorder, another change is observed: a non-significant genetic correlation with Sniekers+COGENT (Sniekers et al., 2017; Trampush et al.,2017) is first observed,rg=-0.02,SE=0.04,p= .66, consistent with other findings (Bulik-Sullivan et al., 2015; Hill et al., 2015) that examined the genetic corre-lation between bipolar disorder and cognitive ability, but this changes to a significant positive genetic correlation, rg=0.16,SE= 0.03,p=1.09×10⁻⁶, after education is added (positive associations are typically observed between bipolar disorder and education (Bulik-Sullivan et al.,2015; Hagenaars et al.,2016; Hill et al.,2015)). These observa-tions, too, point to a phenotype with a genetic architecture more similar to education than cognitive ability.
In addition, Lam et al. (2017) did not report the ‘max FDR’ calculation, as recommended by the authors of the MTAG methodology manuscript, which can show the ex-tent of the false positive associations in this data set. This is an important step in the MTAG analysis and could have alerted the authors to the problems in their analysis.
Acknowledgments
This was undertaken at The University of Edinburgh Cen-tre for Cognitive Ageing and Cognitive Epidemiology, sup-ported by funding from the Biotechnology and Biological Sciences Research Council (BBSRC) and the Medical Re-search Council (MRC; MR/K026992/1) and the University of Edinburgh. WDH is supported by a grant from Age UK (Disconnected Mind Project).
References
Bolormaa, S., Pryce, J. E., Reverter, A., Zhang, Y., Barendse, W., Kemper, K., … Goddard, M. E. (2014). A multi-trait, meta-analysis for detecting pleiotropic polymorphisms for stature, fatness, and reproduction in beef cattle.PLoS Ge-netics, 10, e1004198.
Bulik-Sullivan, B., Finucane, H. K., Anttila, V., Gusev, A., Day, F. R., Loh, P.R., … Neale, B. M. (2015). An atlas of genetic correlations across human diseases and traits.Nature Ge-netics, 47, 1236–1241.
Calvin, C. M., Batty, G. D., Der, G., Brett, C. E, Taylor, A., Pattie, A., … Deary, I. J. (2017). Childhood intelligence in relation to major causes of death in 68 year follow-up: Prospective population study.BMJ, 357, j2708.
Carroll, J. B. (1993). Human cognitive abilities: A survey of factor-analytic studies. New York, NY: Cambridge Univer-sity Press.
Davies, G., Armstrong, N., Bis, J. C., Bressler, J., Chouraki, V., Giddaluru, S., … Deary, I. J. (2015). Genetic contributions to variation in general cognitive function: A meta-analysis of genome-wide association studies in the CHARGE con-sortium (N=53 949).Molecular Psychiatry, 20, 183–192. Davies, G., Lam, M., Harris, S. E., Trampush, J., Luciano, M.,
Hill, W. D., … Deary, I. J. (2017). Ninety-nine indepen-dent genetic loci influencing general cognitive function in-clude genes associated with brain health and structure (N= 280,360).https://doi. org/10.1101/176511.
Deary, I. J., Weiss, A., & Batty, G. D. (2010). Intelligence and personality as predictors of illness and death: How re-searchers in differential psychology and chronic disease epidemiology are collaborating to understand and address health inequalities.Psychological Science in the Public Inter-est, 11, 53–79.
Hagenaars, S. P., Harris, S. E., Davies, G., Hill, W. D., Liewald, D. C., Ritchie, S. J., … Deary, I. J. (2016). Shared genetic ae-tiology between cognitive functions and physical and men-tal health in UK Biobank (N=112 151) and 24 GWAS con-sortia.Molecular Psychiatry, 21, 1624–1632.
Hill, W. D., Arslan, R. C., Xia, C., Luciano, M., Amador, C., Navarro, P., … Penke, L. (2018). Genomic analysis of fam-ily data reveals additional genetic effects on intelligence and personality.Molecular Psychiatry. Advance online publica-tion.
Hill, W. D., Davies, G., The CHARGE Cognitive Working Group, Liewald, D. C., McIntosh, A. M., & Deary, I. J. (2016). Age-dependent pleiotropy between general cogni-tive function and major psychiatric disorders.Biological Psychiatry, 80, 266–273.
Lam, M., Trampush, J. W., Yu, J., Knowles, E., Davies, G., Liewald, D. C., … Lencz, T. (2017). Large-scale cognitive GWAS meta-analysis reveals tissue-specific neural expres-sion and potential nootropic drug targets.Cell Reports, 21, 2597–2613.
Marioni, R. E., Davies, G., Hayward, C., Liewald, D., Kerr, S. M., Campbell, A., … Deary, I. J. (2014). Molecular ge-netic contributions to socio-economic status and intelli-gence.Intelligence, 44, 26–32.
Okbay, A., Beauchamp, J. P., Fontana, M. A., Lee, J. J., Pers, T. H., Rietveld, C. A., … Benjamin, D. J. (2016). Genome-wide association study identifies 74 loci associated with ed-ucational attainment.Nature, 533, 539–542.
Rietveld, C. A., Esko, T., Davies, G., Pers, T. H., Turley, P., Benyamin, B., … Koellinger, P. D. (2014). Common genetic variants associated with cognitive performance identified using the proxy- phenotype method.Proceedings of the Na-tional Academy of Sciences of the United States of America, 111, 13790–13794.
Schizophrenia Working Group of the Psychiatric Ge-nomics Consortium. (2014). Biological insights from 108 schizophrenia-associated genetic loci. Nature, 511, 421–427.
Sniekers, S., Stringer, S., Watanabe, K., Jansen, P. R., Coleman, J. R. I., Krapohl, E., … Posthuma, D. (2017). Genome-wide association meta-analysis of 78,308 individuals identifies new loci and genes influencing human intelligence.Nature Genetics, 49, 1107–1112.
Spearman, C. (1904). ‘General intelligence,’ objectively deter-mined and measured.The American Journal of Psychology, 15, 201–292.
Strenze, T. (2007). Intelligence and socioeconomic success: A meta-analytic review of longitudinal research.Intelligence, 35, 401–426.
Trampush, J. W., Yang, M. L. Z., Yu, J., Knowles, E., Davies, G., Liewald, D. C., … Lencz, T. (2017). GWAS meta-analysis reveals novel loci and genetic correlates for general cog-nitive function: A report from the COGENT consortium. Molecular Psychiatry, 22, 336–345.
Turley, P., Walters, R. K., Maghzian, O., Okbay, A., Lee, J. J., Fontana, M. A., … Social Science Genetic Association Con-sortium. (2018). Multi-trait analysis of genome-wide asso-ciation summary statistics using MTAG.Nature Genetics, 50, 229–237.
Walters, R. T. (2016). Response to query on LD Score Regres-sion user forum, 4/25/16. Retrieved from February 1, 2018, fromhttps://groups.google.com/forum/#!topic/ldsc_users/ UY2vlI4AJbc.
Wood, A. R., Esko, T., Yang, J., Vedantam, S., Pers, T. H., Gustafsson, S., … Frayling, T. M. (2014). Defining the role of common variation in the genomic and biological archi-tecture of adult human height.Nature Genetics, 46, 1173– 1186.
Appendix
Here, the scripts are presented to derive apvalue (two-sided) de-scribing whether the differences between the correlations found in Supplementary Table 14 of Lam et al. (2017) are significant. Cognitive ability is labeled as METAL (Sniekers et al., 2017; Trampush et al.,2017), and the MTAG analysis is labeled MTAG (Okbay et al.,2016; Sniekers et al.,2017; Trampush et al.,2017), finally education is labeled Education (Okbay et al.,2016), as can be seen in Lam et al. (2017). All genetic correlations greater than 1 were treated as 1 (Walters,2016).
METAL (Sniekers et al.,2017; Trampush et al.,2017) vs. MTAG (Okbay et al.,2016; Sniekers et al.,2017; Trampush et al.,2017)
## Years of schooling (proxy cognitive performance) 2∗pnorm(-abs(abs(0.7373 - 0.9673) / sqrt(0.0356^2+
0.0239^2)))
##Years of schooling 2013
2∗pnorm(-abs(abs(0.7282 - 0.9654) / sqrt(0.0362^2+ 0.0257^2)))
##Years of schooling 2016
2∗pnorm(-abs(abs(0.7176 - 0.9143) / sqrt(0.0182^2+ 0.0052^2)))
##College completion
2∗pnorm(-abs(abs(0.7509 - 0.9847) / sqrt(0.0366^2+ 0.0265^2)))
Education (Okbay et al.,2016) vs. MTAG (Okbay et al., 2016; Sniekers et al.,2017; Trampush et al.,2017) ## Years of schooling (proxy cognitive performance) 2∗pnorm(-abs(abs(1 - 0.9673) / sqrt(0.0208^2+
0.0239^2)))
##Years of schooling 2013
2∗pnorm(-abs(abs(1 - 0.9654) / sqrt(0.0225^2+ 0.0257^2)))
##Years of schooling 2016
2∗pnorm(-abs(abs(0.9991 - 0.9143) / sqrt(0.000046449^2+0.0052^2))) ##College completion